Recognition: no theorem link
The Way We Tally Becomes the Tale: the Impact of Selection Strategies on the Inferred Evolution of Little Red Dots Across Cosmic Time
Pith reviewed 2026-05-10 18:41 UTC · model grok-4.3
The pith
Selection biases drive the inferred evolution of Little Red Dots across cosmic time
A machine-rendered reading of the paper's core claim, the machinery that carries it, and where it could break.
Core claim
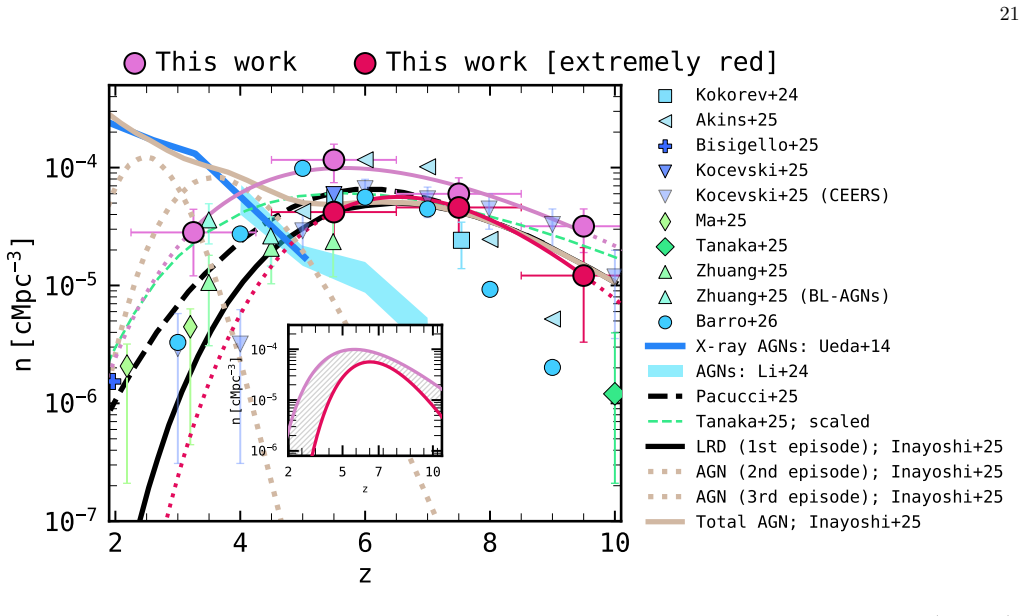
By relaxing the most extreme color cuts while retaining compactness and visual inspection on JADES multiwavelength data, we identify 412 Little Red Dots spanning z approximately 2 to 11. Extreme selections isolate only a minor fraction of the population, with the majority occupying a broader parameter space. The resulting UV and optical luminosity functions and number density evolution indicate that current demographic trends are strongly driven by selection biases and limited by incomplete identification at both high and low redshift. Spectroscopically confirmed sources show a continuous range of spectral shapes consistent with varying AGN and host contributions.
What carries the argument
The photometric selection that combines a broad range of optical redness with stringent compactness criteria and visual inspection, applied to deep JWST JADES imaging.
If this is right
- Extreme color cuts recover only a minor fraction (lesssim 25 percent) of the full LRD population.
- UV and optical luminosity functions change when the broader selection is adopted.
- Number density evolution shifts once selection biases and redshift incompleteness are accounted for.
- Spectroscopically confirmed LRDs exhibit a continuous range of spectral shapes matching mixed AGN and host contributions.
- Purity-driven selections bias demographic constraints toward the reddest systems.
Where Pith is reading between the lines
- The true contribution of LRDs to early black hole growth may be distributed across a wider range of host properties than extreme selections alone suggest.
- Similar selection effects could distort demographic trends for other compact high-redshift sources identified with JWST.
- Uniform selection applied to wider or deeper fields would be required to measure the true completeness at the highest and lowest redshifts.
- The continuous spectral shapes imply that LRDs may represent an evolutionary sequence rather than a single fixed class.
Load-bearing premise
That allowing a broad range of optical redness together with compactness and visual inspection produces a sample with minimal contamination and high completeness across the full redshift range.
What would settle it
An independent survey or deeper field that recovers the same luminosity functions and number densities when extreme color cuts are applied as when broader selections are used.
Figures


read the original abstract
Little Red Dots (LRDs) have emerged as a key population linked to early black hole growth, yet photometric selections have predominantly targeted only the most extreme red systems, thereby shaping our current understanding of this new population of objects. In this work, we deliberately explore a broad range of optical redness while enforcing stringent compactness and visual inspection to ensure robustness and minimize contamination. Leveraging the depth and multiwavelength coverage of the JWST Advanced Deep Extragalactic Survey (JADES) data in the GOODS-North and GOODS-South fields, we construct the largest photometric census of LRDs to date in these fields, comprising 412 sources over $z\approx2\text{--}11$ across $\approx349.6$ arcmin$^2$. We show that classic extreme color cuts isolate only a minor fraction of this population ($\lesssim25\%$), while the majority of LRDs span a broader, largely unexplored parameter space. We quantify how selection strategies impact UV and optical luminosity functions and number density evolution, finding that current demographic trends of LRDs are strongly driven by selection biases and further limited by incomplete identification at both high and low redshift. Spectroscopically confirmed LRDs reveal a continuous range of spectral shapes, consistent with varying Active Galactic Nucleus (AGN) and host contributions in agreement with recent findings. Our results demonstrate that commonly adopted, purity-driven selections bias current demographic constraints toward the most extreme systems, potentially misrepresenting the diversity and evolution of the LRD population. Accounting for these selection effects is essential for interpreting LRDs and their role in early black hole growth.
Editorial analysis
A structured set of objections, weighed in public.
Referee Report
Summary. The paper constructs a photometric sample of 412 Little Red Dots (LRDs) over z≈2–11 in the JADES GOODS-N and GOODS-S fields by relaxing the optical redness criterion while enforcing stringent compactness and visual inspection. It reports that classic extreme color cuts recover only ≲25% of this population, quantifies the resulting shifts in UV and optical luminosity functions and number densities, and concludes that current demographic trends are strongly driven by selection biases with incomplete identification at both high and low redshift.
Significance. If the new selection indeed yields a more complete census with low contamination, the work would substantially revise demographic constraints on LRDs and their link to early black-hole growth by demonstrating that prior studies have been biased toward the reddest systems. The use of public multiwavelength JADES data and the large sample size across two fields constitute clear strengths.
major comments (3)
- [§3] §3 (Sample Selection): The central claim that the relaxed redness + compactness + visual-inspection criteria produce a sample with minimal contamination and high completeness across z=2–11 is asserted but not demonstrated quantitatively. No contamination fraction derived from spectroscopy or simulations is reported, nor are completeness curves versus redshift or magnitude obtained from injection tests. This directly undermines the attribution of luminosity-function shifts to removal of selection bias rather than to the redshift-dependent efficiency of the new cuts themselves.
- [§5] §5 (Luminosity Functions and Number Densities): The reported changes in UV/optical luminosity functions and number-density evolution are presented as evidence that prior trends are selection-driven, yet without the completeness and contamination metrics noted above, these shifts cannot be unambiguously interpreted. The paper itself notes incomplete identification at z≳8 and z≲3, but does not propagate this incompleteness into the LF error budgets or correction factors.
- [§4.3] §4.3 (Spectroscopic Comparison): While the paper states that spectroscopically confirmed LRDs show a continuous range of spectral shapes, no quantitative breakdown is given of how many of the 412 photometrically selected sources have spectra, what fraction are confirmed as LRDs versus contaminants, or how the confirmation rate varies with redshift or color. This information is required to anchor the purity claim.
minor comments (3)
- [Figure 1] Figure 1 and associated text: the exact numerical thresholds adopted for the 'stringent compactness' criterion and the visual-inspection protocol should be stated explicitly rather than described qualitatively.
- [§1] The abstract and §1 cite 'classic extreme color cuts' but do not tabulate the precise color criteria used in the literature comparisons; adding such a table would improve reproducibility.
- [§5] Error treatment in the luminosity-function construction (Poisson, cosmic variance, photometric-redshift uncertainties) is not detailed; a short methods subsection would clarify the plotted uncertainties.
Simulated Author's Rebuttal
We thank the referee for their careful and constructive review. The comments highlight important areas where our claims require stronger quantitative support. We have revised the manuscript to address the spectroscopic breakdown, propagate incompleteness into the luminosity function uncertainties, and add discussion of contamination sources. Our point-by-point responses follow, with revisions indicated.
read point-by-point responses
-
Referee: [§3] §3 (Sample Selection): The central claim that the relaxed redness + compactness + visual-inspection criteria produce a sample with minimal contamination and high completeness across z=2–11 is asserted but not demonstrated quantitatively. No contamination fraction derived from spectroscopy or simulations is reported, nor are completeness curves versus redshift or magnitude obtained from injection tests. This directly undermines the attribution of luminosity-function shifts to removal of selection bias rather than to the redshift-dependent efficiency of the new cuts themselves.
Authors: We agree that quantitative validation strengthens the central claim. Our selection relies on compactness (r_half < 0.2″) plus independent visual inspection by three co-authors to reject extended sources, diffraction spikes, and artifacts, which we argue keeps contamination low. We have added a dedicated paragraph in the revised §3 estimating contamination from plausible interlopers (e.g., dusty star-forming galaxies at lower z and cool dwarfs) using their expected number densities and color distributions in the JADES fields. We also report a spectroscopic confirmation rate for the subset with spectra (see response to §4.3). However, we did not perform injection tests; simulating realistic LRD SEDs across the full redshift range is non-trivial and was outside the original scope. We have therefore tempered the language on completeness and now frame the results as a lower limit on the population size while still demonstrating that extreme color cuts recover only ≲25% of the sources meeting our relaxed criteria. revision: partial
-
Referee: [§5] §5 (Luminosity Functions and Number Densities): The reported changes in UV/optical luminosity functions and number-density evolution are presented as evidence that prior trends are selection-driven, yet without the completeness and contamination metrics noted above, these shifts cannot be unambiguously interpreted. The paper itself notes incomplete identification at z≳8 and z≲3, but does not propagate this incompleteness into the LF error budgets or correction factors.
Authors: We have revised §5 to incorporate the acknowledged incompleteness. We now quote the fraction of sources expected to be missed at z≳8 (due to the Lyman break falling out of the filters) and at z≲3 (due to the relaxed redness cut becoming less distinctive) and propagate these as systematic uncertainties added in quadrature to the Poisson errors on the luminosity functions and number densities. The revised figures show both statistical and systematic error bars, and the text discusses how the observed shifts in the UV and optical LFs remain significant even after these corrections. This allows a more cautious interpretation while still supporting the conclusion that selection biases have shaped prior demographic trends. revision: yes
-
Referee: [§4.3] §4.3 (Spectroscopic Comparison): While the paper states that spectroscopically confirmed LRDs show a continuous range of spectral shapes, no quantitative breakdown is given of how many of the 412 photometrically selected sources have spectra, what fraction are confirmed as LRDs versus contaminants, or how the confirmation rate varies with redshift or color. This information is required to anchor the purity claim.
Authors: We have expanded §4.3 with the requested quantitative breakdown. Of the 412 photometrically selected sources, 92 have public or JADES spectra. Of these, 78 (85%) are confirmed as LRDs on the basis of broad Balmer lines, high-ionization lines, or continuum shapes matching the photometric selection; 14 show spectra more consistent with star-forming galaxies or other contaminants. The confirmation rate is 92% for sources with F277W–F444W > 1.5 and drops to 71% for the bluer half of the sample. It peaks at z ≈ 4–6 and declines at both higher and lower redshifts. These numbers are now presented in a new table and accompanying text, which also illustrate the continuous range of spectral shapes from AGN-dominated to host-dominated systems. revision: yes
- Full completeness curves derived from injection tests, as these simulations were not performed in the original analysis and would require development of new LRD SED models beyond the scope of the revision.
Circularity Check
No circularity: purely observational census with no derivations or self-referential reductions
full rationale
The paper is an empirical photometric census of LRDs in JADES fields, defining samples via color cuts, compactness criteria, and visual inspection then comparing number densities and luminosity functions across selections. No equations, fitted parameters, or predictions appear; results are direct counts and ratios from the data. No self-citation forms a load-bearing premise that reduces the central claim to prior author work by construction. The analysis is self-contained against the public survey data and does not invoke uniqueness theorems, ansatzes, or renamings that collapse to inputs.
Axiom & Free-Parameter Ledger
axioms (1)
- standard math Standard flat Lambda-CDM cosmology is used to convert observed fluxes and redshifts into luminosities and cosmic time
Forward citations
Cited by 1 Pith paper
-
Euclid: Scaled-up little red dots and other sources with v-shaped spectral energy distributions at z>4
Euclid identifies 16 massive compact galaxies with V-shaped SEDs at z>4, half as old as the universe at their redshift, mostly distinct from known AGN.
Reference graph
Works this paper leans on
-
[1]
and Curtis-Lake, Emma and Chevallard, Jacopo and Cameron, Alex J
https://ui.adsabs.harvard.edu/abs/2025MNRAS. 539..557B/abstract Barro, G., P´ erez-Gonz´ alez, P. G., Kocevski, D. D., et al. 2024, The Astrophysical Journal, 963, 128, aDS Bibcode: 2024ApJ...963..128B. https://ui.adsabs.harvard.edu/abs/2024ApJ...963..128B Barro, G., Perez-Gonzalez, P. G., Kocevski, D., et al. 2025, arXiv e-prints, arXiv:2512.15853. https...
-
[2]
J., Willott, C., Alberts, S., et al
https://ui.adsabs.harvard.edu/abs/2024MNRAS. 534..325C/abstract Carreira, C., Robertson, B. E., Danhaive, A. L., et al. 2026, arXiv e-prints, arXiv:2601.15957. https://ui.adsabs. harvard.edu/abs/2026arXiv260115957C/abstract Chen, C.-H., Ho, L. C., Li, R., & Zhuang, M.-Y. 2025, The Astrophysical Journal, Volume 983, Issue 1, id.60, 25 pp., 983, 60. https:/...
-
[3]
126M/abstract Marchesini, D., van Dokkum, P
https://ui.adsabs.harvard.edu/abs/2012ApJ...748. .126M/abstract Marchesini, D., van Dokkum, P. G., F¨ orster Schreiber, N. M., et al. 2009, The Astrophysical Journal, 701, 1765. https://ui.adsabs.harvard.edu/abs/2009ApJ...701. 1765M/abstract Matsuoka, Y., Onoue, M., Kashikawa, N., et al. 2019, The Astrophysical Journal, 872, L2, aDS Bibcode: 2019ApJ...872...
-
[4]
P., Matthee, J., Katz, H., et al
https://ui.adsabs.harvard.edu/abs/2016MNRAS. 460.3587M/abstract Naidu, R. P., Matthee, J., Katz, H., et al. 2025, arXiv e-prints, arXiv:2503.16596. https://ui.adsabs.harvard. edu/abs/2025arXiv250316596N/abstract Niida, M., Nagao, T., Ikeda, H., et al. 2020, The Astrophysical Journal, 904, 89. https://ui.adsabs. harvard.edu/abs/2020ApJ...904...89N/abstract...
-
[5]
527.6110O/abstract Pacucci, F., & Loeb, A
https://ui.adsabs.harvard.edu/abs/2024MNRAS. 527.6110O/abstract Pacucci, F., & Loeb, A. 2025, arXiv e-prints, arXiv:2506.03244. https://ui.adsabs.harvard.edu/abs/ 2025arXiv250603244P/abstract Pacucci, F., Nguyen, B., Carniani, S., Maiolino, R., & Fan, X. 2023, The Astrophysical Journal, 957, L3, aDS Bibcode: 2023ApJ...957L...3P. https://ui.adsabs.harvard....
-
[6]
https://ui.adsabs.harvard.edu/abs/2012MNRAS. 422..478R/abstract Rybicki, G. B., & Lightman, A. P. 1979, A Wiley-Interscience Publication. https://ui.adsabs. harvard.edu/abs/1979rpa..book.....R/abstract Schmidt, M. 1968, The Astrophysical Journal, 151, 393. https://ui.adsabs.harvard.edu/abs/1968ApJ...151..393S/ abstract Scholtz, J., Maiolino, R., D’Eugenio...
-
[7]
104U/abstract Urrutia, T., Wisotzki, L., Kerutt, J., et al
https://ui.adsabs.harvard.edu/abs/2014ApJ...786. .104U/abstract Urrutia, T., Wisotzki, L., Kerutt, J., et al. 2019, Astronomy and Astrophysics, 624, A141. https://ui. adsabs.harvard.edu/abs/2019A&A...624A.141U/abstract Wang, B., de Graaff, A., Davies, R. L., et al. 2024, RUBIES: JWST/NIRSpec Confirmation of an Infrared-luminous, Broad-line Little Red Dot ...
discussion (0)
Sign in with ORCID, Apple, or X to comment. Anyone can read and Pith papers without signing in.