DustPedia and Local Volume Legacy samples as benchmarks for dust evolution in galaxies
Pith reviewed 2026-05-10 17:57 UTC · model grok-4.3
The pith
Combining DustPedia and LVL samples shows the dust-to-stellar mass ratio rises with mass at low values then falls at high values.
A machine-rendered reading of the paper's core claim, the machinery that carries it, and where it could break.
Core claim
The log10(sM_dust) versus log10(M*) trend is not monotonic. With the wide mass coverage from the merged samples it is possible to fit two smoothly joined linear correlations: positive slope for log10(M*/M⊙) ≲ 9.5 (dominated by LVL late spirals and irregulars) and negative slope for higher masses (dominated by DustPedia spirals), while early types remain more dispersed in the same high-mass regime. For log10(M*/M⊙) > 9.5 there is also a tight positive correlation between sM_dust and sSFR, but dwarf galaxies lie below this relation with large scatter. Chemical evolution models interpret both the mass and sSFR trends primarily through differences in initial gas mass budget and galaxy age; low s
What carries the argument
Two smoothly-joined linear correlations fitted to the log10(specific dust mass) versus log10(stellar mass) data, interpreted with chemical evolution models that vary initial gas mass, galaxy age, photofragmentation rate of large grains, and grain-growth efficiency in clouds.
If this is right
- The specific dust mass increases with stellar mass below 10^9.5 solar masses but decreases above that threshold.
- A tight sM_dust-sSFR correlation exists only for galaxies more massive than 10^9.5 solar masses; dwarfs show large scatter.
- Initial gas mass budget mainly sets the mass dependence while galaxy age mainly sets the sSFR dependence.
- Low-mass Sm-Irr galaxies match observations only when models adopt high photofragmentation rates or low grain-growth rates.
Where Pith is reading between the lines
- The transition mass near 10^9.5 solar masses may mark where dust destruction begins to outpace production in more massive systems.
- These local benchmarks can be compared directly with dust predictions from cosmological simulations to test sub-grid dust physics.
- Repeating the same mass-binned analysis at higher redshifts would reveal whether the non-monotonic shape changes with cosmic time.
- Alternative dust-mass estimators applied to the same objects could test whether the broken-linear shape survives changes in measurement method.
Load-bearing premise
Spectral energy distribution fitting yields dust masses and star formation rates accurate enough across the full mass and morphology range that the claimed non-monotonic trend and model interpretations remain valid.
What would settle it
An independent dust-mass catalog for the same galaxies, derived without SED fitting such as from direct submillimeter continuum scaling, that produces a single monotonic trend instead of the two joined linear segments.
Figures


read the original abstract
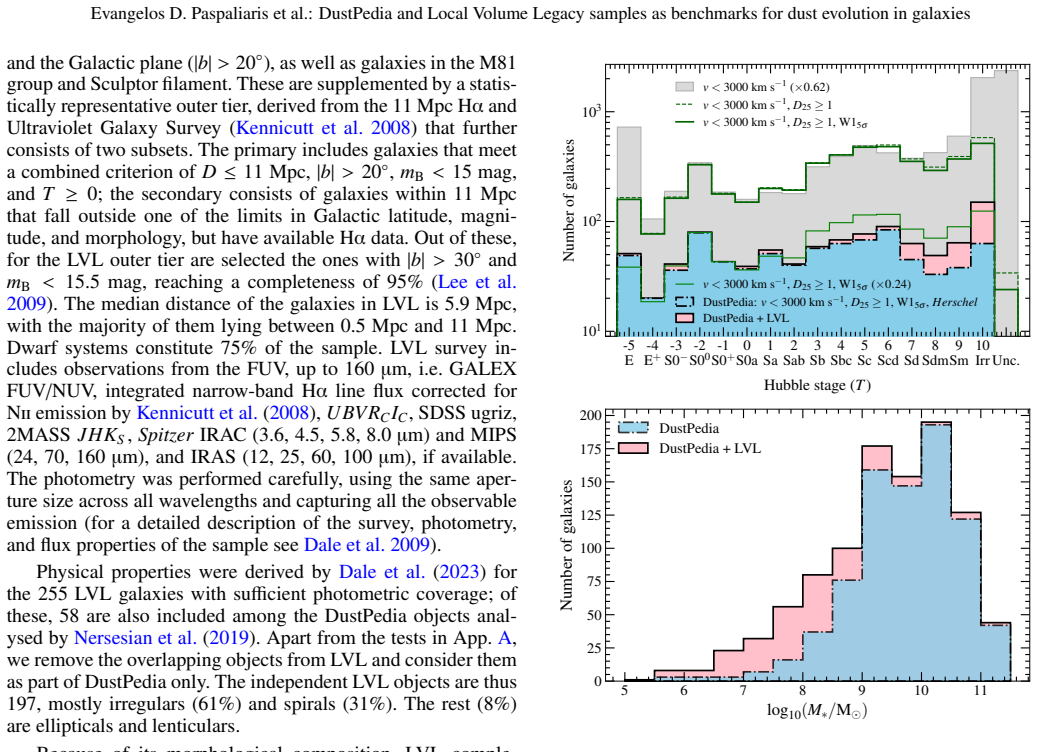
DustPedia and LVL are two samples representative of the local galaxy population, including in total 1011 unique objects of all morphological types, with a wide range of stellar masses ($M_*$) and star-formation activity, and a spectral coverage from the FUV to the FIR. The purpose of this work is to show that these samples cover two complementary ranges in $M_*$ and morphology, making them an ideal set for constraining the dominant processes in the evolution of the galactic dust content. Using the multiwavelength data provided by the two surveys, we fitted the galaxies' spectral energy distribution and estimated their physical properties, in particular the $M_*$, $sM_\mathrm{dust}=M_\mathrm{dust}/M_*$, and sSFR = SFR$/M_*$. By combining DustPedia and LVL, we highlight that the $\log_{10}(sM_{\rm dust})$-$\log_{10}(M_*)$ trend is not monotonic. Thanks to a large number of objects across a wide range of $M_*$, we have been able to fit two smoothly-joined linear correlations: a positive for $\log_{10}(M_{*}/$M$_\odot)\lesssim9.5$ (mainly LVL late spirals and irregulars), and a negative one for larger-mass, mainly DustPedia spirals (early types are distinct and more dispersed in the same mass regime). For $\log_{10}(M_{*}/$M$_\odot)>9.5$, we confirm a strong sM_{\rm dust}-sSFR correlation; dwarf galaxies, instead, lie below this trend, with a large scatter of $sM_{\rm dust}$, for -10.5<$\log_{10}$(sSFR/yr$^{-1}$)<-9.0. By using chemical evolution models we find that the observed $\log_{10}(sM_{\rm dust})$-$\log_{10}(M_{*})$ and $\log_{10}(sM_{\rm dust})$-$\log_{10}$(sSFR) trends can be interpreted mainly by variations in the initial gas mass budget and the galaxy ages, respectively. Low-mass Sm-Irr galaxies with low $sM_{\rm dust}$ and high sSFR can only be reproduced by the models by assuming high photofragmentation rate of large grains, and/or low grain-growth in clouds.
Editorial analysis
A structured set of objections, weighed in public.
Referee Report
Summary. The paper combines the DustPedia and Local Volume Legacy (LVL) samples (1011 unique galaxies) spanning wide ranges in stellar mass and morphology. Multiwavelength SED fitting is used to derive M*, sM_dust = M_dust/M*, and sSFR. The central claim is that the log10(sM_dust)–log10(M*) relation is non-monotonic: a positive slope for log10(M*/M⊙) ≲ 9.5 (dominated by LVL late spirals/irregulars) joined smoothly to a negative slope at higher masses (DustPedia spirals), with early types more dispersed. Chemical evolution models are invoked to interpret the trends primarily via initial gas mass budget and galaxy age, with high photofragmentation rates (and/or low grain growth) required to match low-sM_dust, high-sSFR dwarfs.
Significance. If the non-monotonic trend proves robust against SED systematics, the work supplies useful observational benchmarks for dust evolution across the dwarf-to-spiral regime. The complementary mass and morphological coverage of the two samples is a clear strength, as is the attempt to link both the sM_dust–M* and sM_dust–sSFR planes to a single set of chemical-evolution parameters. The large sample size enables the claimed break to be located with reasonable statistics.
major comments (3)
- [§3] §3 (results on the sM_dust–M* plane): The smoothly joined linear fits with a break at log10(M*/M⊙) ≈ 9.5 are presented without a quantitative justification for the break location (e.g., change-point analysis, BIC comparison of single vs. broken power-law, or bootstrap stability). Because the low-mass positive slope is carried almost entirely by LVL Sm/Irr galaxies and the high-mass negative slope by DustPedia spirals, any residual sample-dependent bias in the common SED pipeline would produce exactly this kink.
- [Methods / §4] Methods section on SED fitting and §4 (model interpretation): No details are given on the specific dust-emission templates, FIR photometry quality cuts, or how uncertainties in sM_dust are propagated when fitting the two slopes. Low-mass LVL galaxies have sparser 70–160 µm coverage and lower surface brightness than DustPedia spirals; without a dedicated test (e.g., mock SEDs or cross-check with independent dust-mass estimators), it remains possible that the observed break is partly an artifact of template assumptions or emissivity choices.
- [§4] §4 (chemical-evolution models): The models reproduce the low-sM_dust, high-sSFR dwarfs only after increasing the photofragmentation rate and/or decreasing grain-growth efficiency. These parameters are adjusted to the same trends they are meant to explain, creating a circularity risk. The paper should demonstrate that the same parameter set also reproduces at least one independent observable (e.g., the dust-to-gas ratio versus metallicity or the FIR color distribution) not used in the tuning.
minor comments (2)
- [Abstract / §2] Notation: sM_dust and sSFR are introduced in the abstract but the exact definition of sM_dust (M_dust/M* or M_dust/M_gas) should be restated at first use in the main text for clarity.
- [Abstract] The abstract states that early-type galaxies are “distinct and more dispersed” above log M* = 9.5, but no quantitative measure (e.g., scatter or Kolmogorov–Smirnov test) is provided to support this statement.
Simulated Author's Rebuttal
We thank the referee for their thorough and constructive comments on our manuscript. We address each of the major comments point by point below, indicating the revisions we plan to make.
read point-by-point responses
-
Referee: [§3] §3 (results on the sM_dust–M* plane): The smoothly joined linear fits with a break at log10(M*/M⊙) ≈ 9.5 are presented without a quantitative justification for the break location (e.g., change-point analysis, BIC comparison of single vs. broken power-law, or bootstrap stability). Because the low-mass positive slope is carried almost entirely by LVL Sm/Irr galaxies and the high-mass negative slope by DustPedia spirals, any residual sample-dependent bias in the common SED pipeline would produce exactly this kink.
Authors: We appreciate the referee's concern regarding the justification for the break point and potential sample biases. The break at log10(M*/M⊙) ≈ 9.5 was selected as the point where the dominance shifts from LVL to DustPedia galaxies and where the trend changes from positive to negative based on the data distribution. However, to strengthen this, in the revised manuscript we will include a quantitative change-point detection analysis and BIC model comparison between single and broken power-law fits. We will also verify consistency of sM_dust values in the overlapping mass range of the two samples to rule out pipeline biases. revision: yes
-
Referee: [Methods / §4] Methods section on SED fitting and §4 (model interpretation): No details are given on the specific dust-emission templates, FIR photometry quality cuts, or how uncertainties in sM_dust are propagated when fitting the two slopes. Low-mass LVL galaxies have sparser 70–160 µm coverage and lower surface brightness than DustPedia spirals; without a dedicated test (e.g., mock SEDs or cross-check with independent dust-mass estimators), it remains possible that the observed break is partly an artifact of template assumptions or emissivity choices.
Authors: We will revise the Methods section to include comprehensive details on the dust-emission templates (as used in our SED fitting procedure), the specific FIR photometry quality cuts applied to both samples, and the method for propagating uncertainties in sM_dust into the slope fits. Additionally, we will incorporate a new test using mock SEDs generated with varying FIR coverage to assess the robustness of the non-monotonic trend against potential template or coverage differences between LVL and DustPedia galaxies. revision: yes
-
Referee: [§4] §4 (chemical-evolution models): The models reproduce the low-sM_dust, high-sSFR dwarfs only after increasing the photofragmentation rate and/or decreasing grain-growth efficiency. These parameters are adjusted to the same trends they are meant to explain, creating a circularity risk. The paper should demonstrate that the same parameter set also reproduces at least one independent observable (e.g., the dust-to-gas ratio versus metallicity or the FIR color distribution) not used in the tuning.
Authors: We acknowledge the potential for circularity in the model tuning. To address this, in the revised manuscript we will demonstrate that the adopted model parameters (elevated photofragmentation rates and reduced grain growth efficiencies) also successfully reproduce the dust-to-gas ratio versus metallicity relation for the galaxies in our sample, using independent gas mass measurements. This provides an external validation of the parameter choices. revision: yes
Circularity Check
No circularity in derivation of non-monotonic trend or model interpretation
full rationale
The paper's core claim is an empirical observation: combining DustPedia and LVL data yields a non-monotonic log10(sM_dust)-log10(M*) relation, which is directly fitted with two joined linear segments to the observed points. This fit is not derived from or forced by any model or prior result; it is a post-hoc description of the data. The chemical-evolution models are invoked only afterward for interpretation, with parameters (e.g., photofragmentation rates, initial gas mass) adjusted to reproduce the already-measured trends. No equations, self-citations, or ansatzes in the provided text reduce the claimed trend or its interpretation to a tautology or fitted input renamed as prediction. The chain from multiwavelength SED fitting to trend identification to qualitative model matching is self-contained and externally falsifiable against the raw photometry.
Axiom & Free-Parameter Ledger
free parameters (3)
- mass break point at log10(M*/M⊙) ≈ 9.5
- slopes of the two linear correlations
- photofragmentation rate and grain-growth efficiency in models
axioms (2)
- domain assumption Multiwavelength SED fitting recovers unbiased M*, M_dust, and SFR across morphological types and mass range
- domain assumption Chemical evolution models with standard dust processes plus tunable photofragmentation/grain growth capture dominant dust evolution mechanisms
Lean theorems connected to this paper
-
IndisputableMonolith/Cost/FunctionalEquation.leanwashburn_uniqueness_aczel unclear?
unclearRelation between the paper passage and the cited Recognition theorem.
By using chemical evolution models we find that the observed log10(sM_dust)-log10(M*) and log10(sM_dust)-log10(sSFR) trends can be interpreted mainly by variations in the initial gas mass budget and the galaxy ages, respectively. Low-mass Sm-Irr galaxies ... can only be reproduced by the models by assuming high photofragmentation rate of large grains, and/or low grain-growth in clouds.
-
IndisputableMonolith/Foundation/AlphaCoordinateFixation.leanalpha_pin_under_high_calibration unclear?
unclearRelation between the paper passage and the cited Recognition theorem.
We used the Python UltraNest package ... to fit the datapoints with a function that smoothly joins ... a negative and a positive linear correlation
What do these tags mean?
- matches
- The paper's claim is directly supported by a theorem in the formal canon.
- supports
- The theorem supports part of the paper's argument, but the paper may add assumptions or extra steps.
- extends
- The paper goes beyond the formal theorem; the theorem is a base layer rather than the whole result.
- uses
- The paper appears to rely on the theorem as machinery.
- contradicts
- The paper's claim conflicts with a theorem or certificate in the canon.
- unclear
- Pith found a possible connection, but the passage is too broad, indirect, or ambiguous to say the theorem truly supports the claim.
Reference graph
Works this paper leans on
-
[1]
Interstellar dust production, destruction and effects of dust depletion in galaxies
Asano, R. S., Takeuchi, T. T., Hirashita, H., & Inoue, A. K. 2013, Earth, Planets and Space, 65, 213 Assef, R. J., Stern, D., Noirot, G., et al. 2018, ApJS, 234, 23 Astropy Collaboration (Price-Whelan, A. M., et al.). 2018, AJ, 156, 123 Astropy Collaboration (Price-Whelan, A. M., et al.). 2022, ApJ, 935, 167 Astropy Collaboration (Robitaille, T. P., et al...
work page internal anchor Pith review Pith/arXiv arXiv 2013
-
[2]
and leaving all other parameters unaltered,M ∗ is found to be systematically lower than with the Salpeter (1955) IMF used by Nersesian et al. (2019), by 0.25 dex; and SFR by 0.2 dex (similar values can be found in the literature, see, e.g., Madau & Dickinson 2014; Bernardi et al. 2018). Yet, the different choice of other parame- ters in the two works also...
work page 1955
-
[3]
conjures with the wider range in the metallicity of the stellar populations (in- cluding subsolar values, while Nersesian et al. 2019, use solar metallicity only) in raising the mass-to-light ratio of the model: eventually, the offset due to the IMF is compensated and both the Dale et al. (2023) and our fits produce similarM ∗ and SFR. The derivation of t...
work page 2019
-
[4]
and those of Dale et al. (2023). Stellar mass, dust mass and SFR are shown in the left, middle and right panel, respectively. A black-dashed line indicates the one-to-one relation. In the middle panel, a dark-red dash-dotted line shows the y=x - 0.42 relation; for 50 objects, Dale et al. (2023) only provide upper limits forM dust, which are indicated with...
work page 2023
-
[5]
The best linear fits to each morphological bin is shown with the correspond- ing colour (see the fitting parameters in Tab. B.2). set between their log 10(sM dust)–log10(M∗) relation and that of Casasola et al. (2020) for DustPedia galaxies. Since both works used the same dust model,THEMIS, the offset was attributed to a selection effect, with the dataset...
work page 2020
discussion (0)
Sign in with ORCID, Apple, or X to comment. Anyone can read and Pith papers without signing in.