Recognition: unknown
The Hubble sequence in JWST CEERS from unbiased galaxy morphologies
Pith reviewed 2026-05-10 17:11 UTC · model grok-4.3
The pith
A continuous Hubble-like sequence from late-type to early-type galaxies exists by redshift 4 with no redshift gradient.
A machine-rendered reading of the paper's core claim, the machinery that carries it, and where it could break.
Core claim
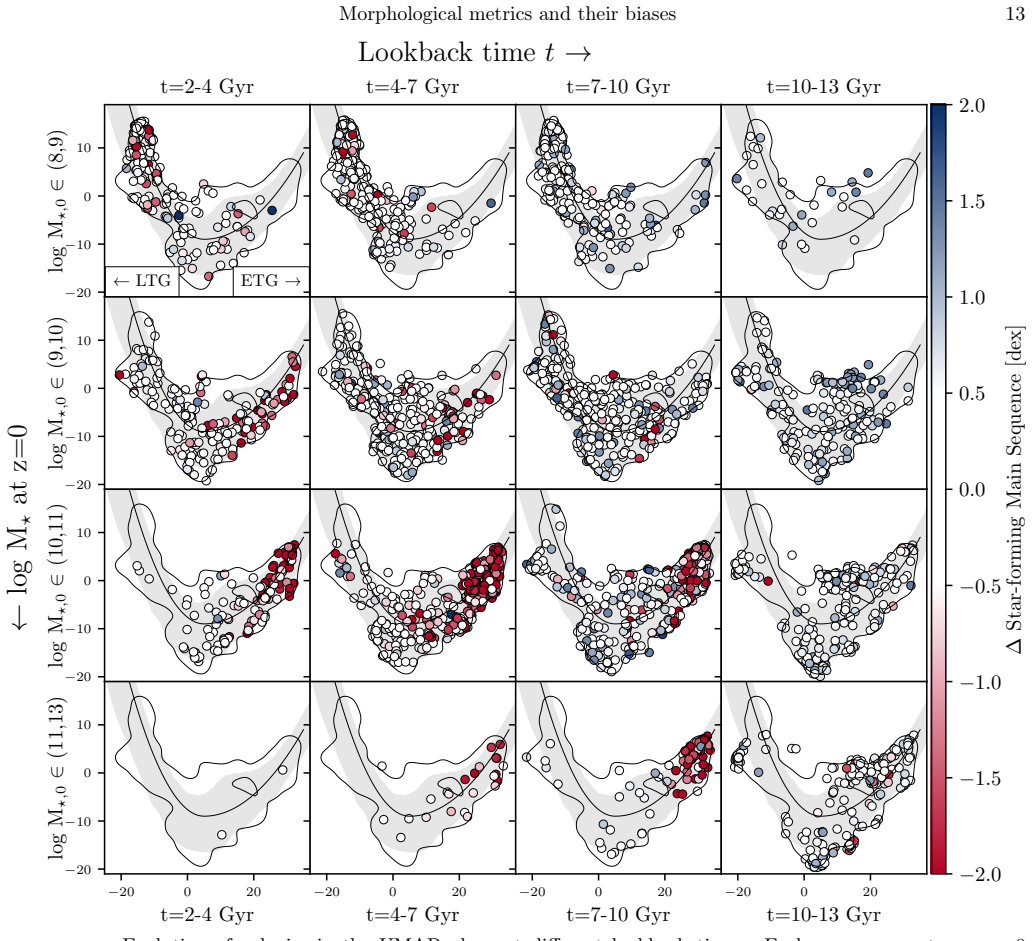
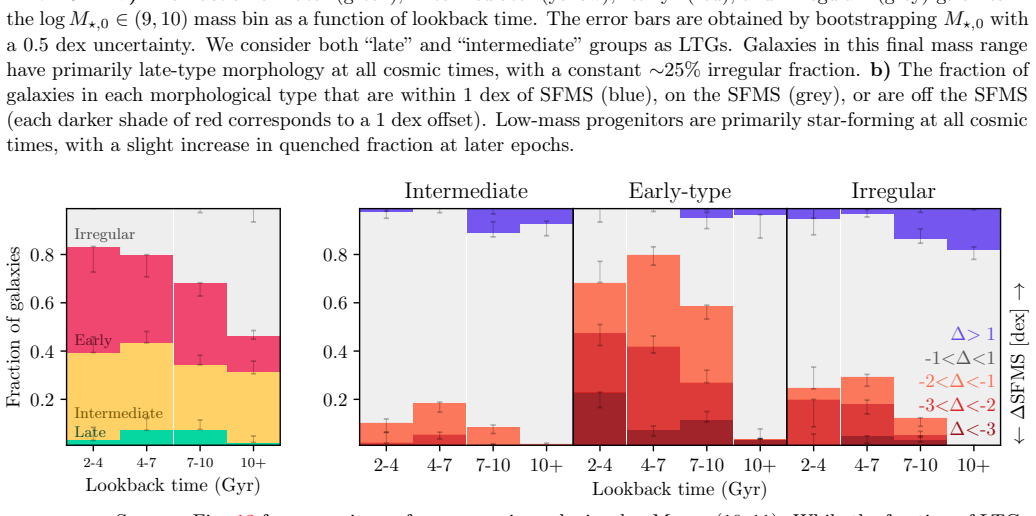
By constructing absolute images that equalize observational biases across redshifts, the structural parameters of galaxies reveal a continuous morphological sequence from late-type to early-type systems with no gradient in redshift up to z ~ 4.5. This indicates that a Hubble-like ordering of galaxy types is already in place early in cosmic time. Progenitors of low-mass galaxies remain predominantly star-forming disks throughout, whereas massive galaxy progenitors split into a stable star-forming disk population and an early-type population that assembles rapidly from irregulars before quenching within a few Gyr, consistent with compaction-driven quenching.
What carries the argument
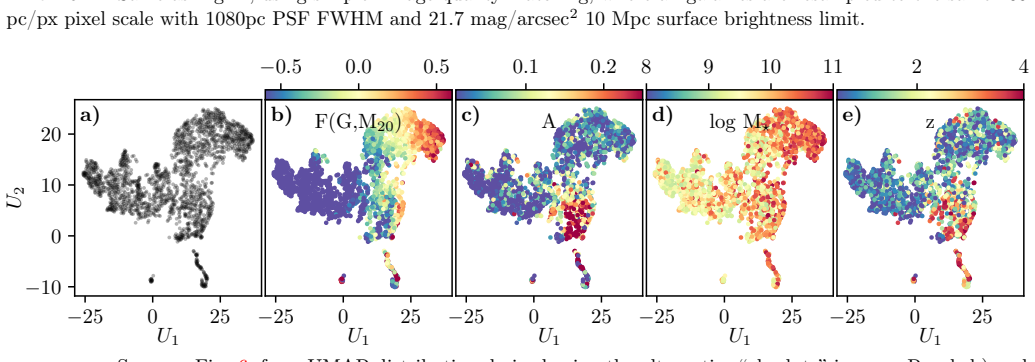
Absolute images that match effective resolution and surface brightness limits while accounting for cosmological dimming plus assumed size and mass-to-light ratio evolution, analyzed via UMAP on measured structural parameters to map the morphological phase space.
If this is right
- Progenitors of low-mass galaxies remain star-forming disks at every epoch examined.
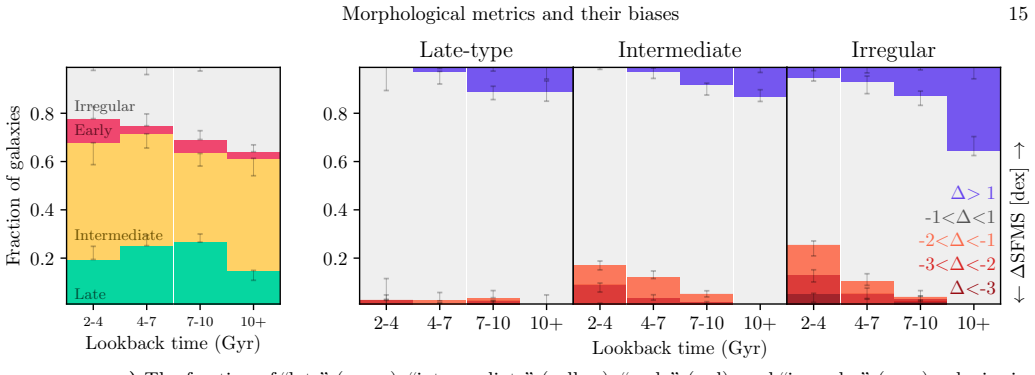
- Massive galaxies follow two distinct progenitor paths: stable star-forming disks with little structural change, or irregular systems that build up rapidly and quench within a few Gyr.
- The absolute-image method recovers a sharper separation between early- and late-type galaxies than visual classifications do.
- The observed rapid assembly and quenching of the early-type population aligns with a compaction-driven quenching scenario.
Where Pith is reading between the lines
- Galaxy formation models must generate morphological diversity by z ~ 4 without relying on later-time transformations to establish the sequence.
- The two-path progenitor behavior for massive galaxies suggests that merger or gas-rich compaction events operate similarly at high and low redshift.
- Extending the same absolute-image technique to z > 4.5 with future deeper surveys could test whether the sequence persists or emerges even earlier.
- Simulations that reproduce the observed lack of redshift gradient in the morphological phase space would need to match both the structural continuity and the distinct assembly histories.
Load-bearing premise
That constructing absolute images by matching resolution, surface brightness limits, and correcting for cosmological dimming along with assumed size and mass-to-light evolution produces unbiased morphological comparisons across redshifts.
What would settle it
Re-measuring the structural parameters on the same galaxies without the absolute-image corrections or with different assumptions for size and mass-to-light evolution and finding a clear redshift gradient in the UMAP distribution would falsify the claim of no redshift dependence.
Figures


read the original abstract
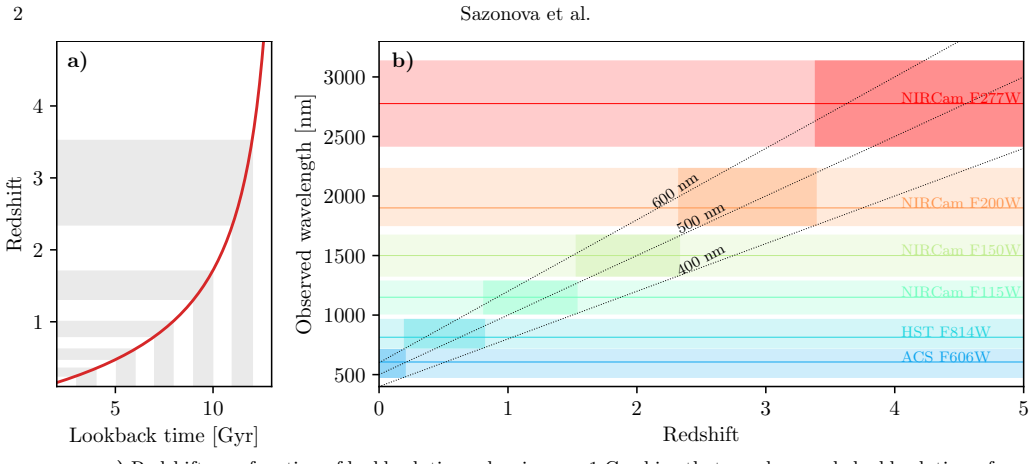
Whether the "Hubble sequence" of galaxy morphologies exists up to z~4 is still disputed, and one of the challenges is characterizing galaxy structure consistently across a wide range of redshifts. To enable a fair comparison across cosmic time, we constructed "absolute" images of galaxies spanning 0.15<z<4.5 and 8<log $M_{\star}$<11 from HST CANDELS and JWST CEERS surveys, by matching the effective resolution and surface brightness limit of galaxies, accounting for cosmological dimming and evolution in size and mass-to-light ratio. We measured the structural parameters of 2825 galaxies and used the UMAP technique to study the evolution of the morphological phase space. We find a continuous sequence spanning late-type to early-type galaxies, with no redshift gradient - indicating that a Hubble-like sequence is established by z~4. We show that our approach recovers a cleaner separation between early- and late-type galaxies than visual classifications. By tracing progenitors using empirical mass assembly histories, we find that progenitors of low-mass galaxies are predominantly star-forming disks at all epochs. Progenitors of massive galaxies follow two distinct paths: a stable star-forming disk population with little structural evolution, and an early-type population that builds up rapidly from irregular progenitors and quenches within a few Gyr, consistent with a compaction-driven quenching scenario.
Editorial analysis
A structured set of objections, weighed in public.
Referee Report
Summary. The manuscript describes the construction of 'absolute' galaxy images from HST CANDELS and JWST CEERS data spanning 0.15 < z < 4.5 by matching resolution, surface brightness limits, and applying corrections for cosmological dimming and evolution in size and mass-to-light ratio. Structural parameters are measured for 2825 galaxies, and UMAP is applied to the morphological phase space. The central result is a continuous sequence from late-type to early-type galaxies with no redshift gradient, implying the Hubble sequence is established by z ~ 4. Progenitor tracing using empirical mass assembly histories reveals distinct paths for low-mass (stable star-forming disks) and high-mass galaxies (stable disks or rapid buildup from irregulars with quenching).
Significance. If the unbiased nature of the morphological comparison holds, this result would be of high significance for galaxy evolution studies, as it provides evidence against strong morphological evolution with redshift and supports early formation of the Hubble sequence. The data-driven UMAP approach offers an improvement over visual classifications in separating galaxy types. The progenitor analysis lends support to compaction-driven quenching scenarios for massive galaxies. The work benefits from a large, multi-wavelength sample combining HST and JWST observations.
major comments (2)
- The corrections for evolution in galaxy size and mass-to-light ratio are applied uniformly based on prior literature. However, as these may be morphology-dependent, they risk introducing or removing redshift gradients in the UMAP embedding by construction. A quantitative test of the sensitivity of the no-gradient result to variations in these assumed evolutionary trends (e.g., different size evolution for disks vs. spheroids) is needed to confirm the claim is not an artifact of the preprocessing.
- The impact of UMAP hyperparameters on the claimed continuous sequence and lack of redshift gradient is not quantified. Since these are free parameters, robustness checks (e.g., varying n_neighbors, min_dist) should be presented to show the result is stable.
minor comments (2)
- The abstract mentions 'cleaner separation' than visual classifications; provide quantitative metrics (e.g., silhouette scores or classification accuracy) in the main text for this comparison.
- Clarify the exact number of galaxies in each redshift bin and mass range to allow reproducibility.
Simulated Author's Rebuttal
We thank the referee for the constructive comments and positive assessment of the significance of our work. We address each major comment in detail below, providing clarifications and committing to revisions where appropriate to strengthen the manuscript.
read point-by-point responses
-
Referee: The corrections for evolution in galaxy size and mass-to-light ratio are applied uniformly based on prior literature. However, as these may be morphology-dependent, they risk introducing or removing redshift gradients in the UMAP embedding by construction. A quantitative test of the sensitivity of the no-gradient result to variations in these assumed evolutionary trends (e.g., different size evolution for disks vs. spheroids) is needed to confirm the claim is not an artifact of the preprocessing.
Authors: We acknowledge that the size and mass-to-light ratio corrections were applied using average evolutionary trends from the literature (e.g., size evolution relations from van der Wel et al. 2014 and typical M/L evolution from multi-wavelength SED studies), as morphology-specific corrections at high redshift are not yet robustly constrained without potential circularity. These averages were chosen to enable a fair, redshift-independent comparison. To directly address the concern, we will add quantitative sensitivity tests in the revised manuscript: we will re-derive the absolute images using alternative size evolution slopes separately for disk-dominated and spheroid-dominated populations (drawing from literature ranges for each), re-measure structural parameters, and re-embed in UMAP. We will demonstrate that the continuous morphological sequence and lack of redshift gradient persist across these variations, with only minor shifts in the embedding that do not alter the main conclusions. This analysis will be included in Section 4 and/or a new appendix. revision: yes
-
Referee: The impact of UMAP hyperparameters on the claimed continuous sequence and lack of redshift gradient is not quantified. Since these are free parameters, robustness checks (e.g., varying n_neighbors, min_dist) should be presented to show the result is stable.
Authors: We agree that explicit quantification of UMAP hyperparameter sensitivity is valuable for demonstrating robustness. Our primary analysis used standard default values (n_neighbors = 15, min_dist = 0.1) appropriate for the sample size and dimensionality. In the revised manuscript, we will add a dedicated subsection (or appendix) with robustness tests, including UMAP embeddings recomputed over a grid of n_neighbors (5–50) and min_dist (0.01–0.5). We will show that the continuous late-to-early type sequence and absence of any redshift gradient remain stable across this range, with only quantitative changes in cluster tightness but no qualitative impact on the key results. A summary figure will illustrate the consistency. revision: yes
Circularity Check
No significant circularity in the morphological sequence derivation
full rationale
The paper constructs 'absolute' images via resolution and surface-brightness matching plus standard cosmological dimming corrections and evolutionary trends in size and mass-to-light ratio (drawn from prior literature). Structural parameters are measured directly on the corrected images, UMAP is applied to the resulting parameter space, and the continuous late-to-early sequence with no redshift gradient is reported as an observed feature of that space. Progenitor tracing uses separate empirical mass-assembly histories. None of these steps reduces by definition or self-citation to the target claim; the derivation remains self-contained against external benchmarks.
Axiom & Free-Parameter Ledger
free parameters (1)
- UMAP hyperparameters
axioms (1)
- domain assumption Models of cosmological surface-brightness dimming and redshift-dependent galaxy size and mass-to-light evolution are accurate enough for unbiased image matching
Reference graph
Works this paper leans on
-
[1]
, " * write output.state after.block = add.period write newline
ENTRY address archivePrefix author booktitle chapter doi edition editor eprint howpublished institution journal key month number organization pages publisher school series title misctitle type volume year version url label extra.label sort.label short.list INTEGERS output.state before.all mid.sentence after.sentence after.block FUNCTION init.state.consts ...
-
[2]
write newline
" write newline "" before.all 'output.state := FUNCTION format.url url empty "" new.block "" url * "" * if FUNCTION format.eprint eprint empty "" archivePrefix empty "" archivePrefix "arXiv" = new.block " " eprint * " " * new.block " " eprint * " " * if if if FUNCTION format.doi doi empty "" " " doi * " " * if FUNCTION format.pid doi empty eprint empty ur...
-
[3]
G., et al., 2003, @doi [ ] 10.1086/373919 , 588, 218
Abraham R. G., et al., 2003, @doi [ ] 10.1086/373919 , 588, 218
-
[4]
Allen N., et al., 2024, @doi [arXiv e-prints] 10.48550/arXiv.2410.16354 , p. arXiv:2410.16354
-
[5]
Almaini O., et al., 2017, @doi [ ] 10.1093/mnras/stx1957 , 472, 1401
-
[6]
Arrabal Haro P., et al., 2023, @doi [ ] 10.1038/s41586-023-06521-7 , 622, 707
-
[7]
Astropy Collaboration et al., 2013, @doi [ ] 10.1051/0004-6361/201322068 , 558, A33
-
[8]
Astropy Collaboration et al., 2018, @doi [ ] 10.3847/1538-3881/aabc4f , 156, 123
-
[9]
Astropy Collaboration et al., 2022, @doi [ ] 10.3847/1538-4357/ac7c74 , 935, 167
work page internal anchor Pith review doi:10.3847/1538-4357/ac7c74 2022
-
[10]
M., et al., 2013, @doi [ ] 10.1088/0004-637X/765/1/28 , 765, 28
Atkinson A. M., et al., 2013, @doi [ ] 10.1088/0004-637X/765/1/28 , 765, 28
-
[11]
Bagley M. B., et al., 2023, @doi [ ] 10.3847/2041-8213/acbb08 , 946, L12
-
[12]
L., et al., 1999, @doi [ ] 10.1086/308056 , 527, 54
Balogh M. L., et al., 1999, @doi [ ] 10.1086/308056 , 527, 54
-
[13]
Barro G., et al., 2013, @doi [ ] 10.1088/0004-637X/765/2/104 , 765, 104
-
[14]
Barro G., et al., 2019, @doi [ ] 10.3847/1538-4365/ab23f2 , 243, 22
-
[15]
Behroozi P., et al., 2019, @doi [ ] 10.1093/mnras/stz1182 , 488, 3143
-
[16]
A., et al., 2000, @doi [ ] 10.1086/301386 , 119, 2645
Bershady M. A., et al., 2000, @doi [ ] 10.1086/301386 , 119, 2645
-
[17]
Bezanson R., et al., 2013, @doi [ ] 10.1088/2041-8205/779/2/L21 , 779, L21
-
[18]
B \' lek M., et al., 2020, @doi [ ] 10.1093/mnras/staa2248 , 498, 2138
-
[19]
Bottrell C., et al., 2019, @doi [ ] 10.1093/mnras/stz2934 , 490, 5390
-
[20]
Bournaud F., et al., 2007, @doi [ ] 10.1051/0004-6361:20078010 , 476, 1179
-
[21]
Bradley L., et al., 2020, astropy/photutils: 1.0.1, @doi 10.5281/zenodo.596036 , https://ui.adsabs.harvard.edu/abs/2020zndo....596036B
-
[22]
Chamberlain K., et al., 2024, @doi [ ] 10.3847/1538-4357/ad19d0 , 962, 162
-
[23]
Chen C.-H., et al., 2025, @doi [ ] 10.3847/2041-8213/adee0a , 989, L12
-
[24]
Cid Fernandes R., et al., 2005, @doi [ ] 10.1111/j.1365-2966.2005.08752.x , 358, 363
-
[25]
Clarke L., et al., 2024, @doi [ ] 10.3847/1538-4357/ad8ba4 , 977, 133
-
[26]
J., 2003, @doi [ ] 10.1086/375001 , 147, 1
Conselice C. J., 2003, @doi [ ] 10.1086/375001 , 147, 1
-
[27]
Conselice C. J., 2006, @doi [ ] 10.1111/j.1365-2966.2006.11114.x , 373, 1389
-
[28]
J., et al., 2000, @doi [ ] 10.1086/308300 , 529, 886
Conselice C. J., et al., 2000, @doi [ ] 10.1086/308300 , 529, 886
-
[29]
J., et al., 2005, @doi [ ] 10.1086/426102 , 620, 564
Conselice C. J., et al., 2005, @doi [ ] 10.1086/426102 , 620, 564
-
[30]
Costantin L., et al., 2025, @doi [ ] 10.1051/0004-6361/202451330 , 699, A360
-
[31]
Cox I. G., et al., 2025, @doi [arXiv e-prints] 10.48550/arXiv.2510.08743 , p. arXiv:2510.08743
-
[32]
Dekel A., Burkert A., 2013, @doi [ ] 10.1093/mnras/stt2331 , 438, 1870
-
[33]
Desmons A., et al., 2024, @doi [ ] 10.1093/mnras/stae1402 , 531, 4070
-
[34]
J., et al., 2025, @doi [ ] 10.3847/1538-4365/ae1137 , 281, 50
Eisenstein D. J., et al., 2025, @doi [ ] 10.3847/1538-4365/ae1137 , 281, 50
-
[35]
Ellison S. L., et al., 2008, @doi [ ] 10.1088/0004-6256/135/5/1877 , 135, 1877
-
[36]
M., et al., 2025, @doi [ ] 10.1051/0004-6361/202554725 , 700, A42
Espejo Salcedo J. M., et al., 2025, @doi [ ] 10.1051/0004-6361/202554725 , 700, A42
-
[37]
Fang G., et al., 2026, @doi [ ] 10.3847/1538-3881/ae2324 , 171, 59
-
[38]
Ferreira L., et al., 2022a, @doi [ ] 10.3847/1538-4357/ac66ea , 931, 34
-
[39]
Ferreira L., et al., 2022b, @doi [ ] 10.3847/2041-8213/ac947c , 938, L2
-
[40]
Ferreira L., et al., 2023, @doi [ ] 10.3847/1538-4357/acec76 , 955, 94
-
[41]
E., et al., 2013, @doi [ ] 10.1093/mnras/stt1016 , 434, 282
Freeman P. E., et al., 2013, @doi [ ] 10.1093/mnras/stt1016 , 434, 282
-
[42]
Ge X., et al., 2024, @doi [Research in Astronomy and Astrophysics] 10.1088/1674-4527/ad1c77 , 24, 035006
-
[43]
Geda R., et al., 2022, @doi [ ] 10.3847/1538-3881/ac5908 , 163, 202
-
[44]
Graham A. W., Driver S. P., 2005, @doi [ ] 10.1071/AS05001 , 22, 118
-
[45]
W., et al., 2001, @doi [ ] 10.1086/323090 , 122, 1707
Graham A. W., et al., 2001, @doi [ ] 10.1086/323090 , 122, 1707
-
[46]
Grogin N. A., et al., 2011, @doi [ ] 10.1088/0067-0049/197/2/35 , 197, 35
-
[47]
Gully H., et al., 2025, @doi [ ] 10.1093/mnras/staf635 , 539, 3058
-
[48]
Haggar R., et al., 2024, @doi [ ] 10.1093/mnras/stae1566 , 532, 1031
-
[49]
Hamilton D., 1985, @doi [ ] 10.1086/163537 , 297, 371
-
[50]
Harris C. R., et al., 2020, @doi [Nature] 10.1038/s41586-020-2649-2 , 585, 357
-
[51]
Hogg D. W., et al., 2002, @doi [arXiv e-prints] 10.48550/arXiv.astro-ph/0210394 , pp astro--ph/0210394
work page internal anchor Pith review doi:10.48550/arxiv.astro-ph/0210394 2002
-
[52]
Holwerda B. W., et al., 2011, @doi [ ] 10.1111/j.1365-2966.2011.18938.x , 416, 2401
-
[53]
Hopkins P. F., et al., 2006, @doi [ ] 10.1086/499298 , 163, 1
-
[54]
Hopkins P. F., et al., 2008, @doi [ ] 10.1086/524362 , 175, 356
work page internal anchor Pith review doi:10.1086/524362 2008
-
[55]
Huertas-Company M., et al., 2018, @doi [ ] 10.3847/1538-4357/aabfed , 858, 114
-
[56]
Huertas-Company M., et al., 2024, @doi [ ] 10.1051/0004-6361/202346800 , 685, A48
-
[57]
Huertas-Company M., et al., 2025, @doi [arXiv e-prints] 10.48550/arXiv.2502.03532 , p. arXiv:2502.03532
-
[58]
Computing in Science & Engineering9(3), 90–95 (2007) https://doi.org/10.1109/MCSE.2007.55
Hunter J. D., 2007, @doi [Computing in Science & Engineering] 10.1109/mcse.2007.55 , 9, 90
-
[59]
S., et al., 2023, @doi [ ] 10.3847/2041-8213/acad01 , 946, L15
Kartaltepe J. S., et al., 2023, @doi [ ] 10.3847/2041-8213/acad01 , 946, L15
-
[60]
M., 1985, @doi [ ] 10.1086/191066 , 59, 115
Kent S. M., 1985, @doi [ ] 10.1086/191066 , 59, 115
-
[61]
Koekemoer A. M., et al., 2011, @doi [ ] 10.1088/0067-0049/197/2/36 , 197, 36
-
[62]
Lapiner S., et al., 2023, @doi [ ] 10.1093/mnras/stad1263 , 522, 4515
-
[63]
C., et al., 2022, @doi [ ] 10.3847/1538-4365/ac1fe5 , 258, 10
Lee J. C., et al., 2022, @doi [ ] 10.3847/1538-4365/ac1fe5 , 258, 10
-
[64]
Lee J. H., et al., 2024, @doi [ ] 10.3847/1538-4357/ad3448 , 966, 113
-
[65]
Lotz J. M., et al., 2004, @doi [ ] 10.1086/421849 , 128, 163
-
[66]
Lyu C., et al., 2023, @doi [ ] 10.3847/1538-4357/ad036b , 959, 5
-
[67]
A., et al., 2018, @doi [ ] 10.3847/1538-4357/aad59e , 864, 123
Mager V. A., et al., 2018, @doi [ ] 10.3847/1538-4357/aad59e , 864, 123
-
[68]
B., et al., 2018, @doi [ ] 10.1093/mnras/stx3260 , 475, 1549
Mantha K. B., et al., 2018, @doi [ ] 10.1093/mnras/stx3260 , 475, 1549
-
[69]
Masters K. L., et al., 2010, @doi [ ] 10.1111/j.1365-2966.2010.16503.x , 405, 783
-
[70]
Matthee J., et al., 2024, @doi [ ] 10.3847/1538-4357/ad2345 , 963, 129
-
[71]
J., et al., 2026, @doi [ ] 10.3847/2041-8213/ae3da2 , 999, L6
McGrath E. J., et al., 2026, @doi [ ] 10.3847/2041-8213/ae3da2 , 999, L6
-
[72]
UMAP: Uniform Manifold Approximation and Projection for Dimension Reduction
McInnes L., et al., 2018, @doi [arXiv e-prints] 10.48550/arXiv.1802.03426 , p. arXiv:1802.03426
work page internal anchor Pith review Pith/arXiv arXiv doi:10.48550/arxiv.1802.03426 2018
-
[73]
Mitsuhashi I., et al., 2026, @doi [arXiv e-prints] 10.48550/arXiv.2601.16284 , p. arXiv:2601.16284
-
[74]
Mortlock A., et al., 2013, @doi [ ] 10.1093/mnras/stt793 , 433, 1185
-
[75]
Monthly Notices of the Royal Astronomical Society , volume =
Moster B. P., et al., 2013, @doi [ ] 10.1093/mnras/sts261 , 428, 3121
-
[76]
Mowla L., et al., 2024, @doi [ ] 10.1038/s41586-024-08293-0 , 636, 332
-
[77]
P., Matthee, J., Katz, H., et al
Naidu R. P., et al., 2025, @doi [arXiv e-prints] 10.48550/arXiv.2503.16596 , p. arXiv:2503.16596
-
[78]
Narayan S., Adhikari S., 2025, @doi [ ] 10.3847/1538-4357/adec93 , 991, 119
-
[79]
Nayyeri H., et al., 2017, @doi [ ] 10.3847/1538-4365/228/1/7 , 228, 7
-
[80]
B., Sandage A., 1968, @doi [ ] 10.1086/149737 , 154, 21
Oke J. B., Sandage A., 1968, @doi [ ] 10.1086/149737 , 154, 21
discussion (0)
Sign in with ORCID, Apple, or X to comment. Anyone can read and Pith papers without signing in.