Recognition: unknown
Reliability-Aware ETF Tail-Risk Monitoring
Pith reviewed 2026-05-10 16:41 UTC · model grok-4.3
The pith
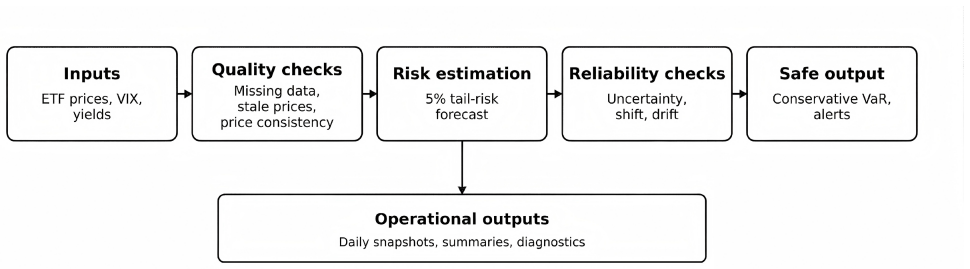
A reliability-aware framework improves ETF tail-risk monitoring by combining quality checks, lower-tail prediction, uncertainty scoring, and risk-aware adjustment.
A machine-rendered reading of the paper's core claim, the machinery that carries it, and where it could break.
Core claim
The paper establishes that the reliability-aware risk monitoring framework, formed by integrating service-time quality checks, lower-tail prediction, uncertainty scoring, and risk-aware adjustment of the tail-risk estimate, delivers improved tail-risk monitoring performance, with the largest gains appearing during stressed market periods, while the estimates remain stable even when input data quality is deliberately degraded in controlled simulations.
What carries the argument
The reliability-aware framework that fuses service-time quality checks, lower-tail prediction, uncertainty scoring, and risk-aware adjustment to produce the final tail-risk estimate.
If this is right
- Tail-risk monitoring accuracy rises most noticeably during stressed market periods.
- Performance holds steady when input data quality is reduced in simulation tests.
- The rolling walk-forward evaluation on ETFs with VIX and yield-curve data supports practical next-day use.
- The adjusted estimates become the basis for more stable daily risk surveillance.
Where Pith is reading between the lines
- Portfolio systems could feed the uncertainty scores directly into position limits or hedging rules for ETFs.
- The same four-component structure might transfer to tail-risk monitoring for individual stocks or options.
- Regulators could require similar reliability layers in daily risk reports from ETF providers.
- Model builders might add automated quality filters as a standard first step before any tail forecast.
Load-bearing premise
Combining service-time quality checks, lower-tail prediction, uncertainty scoring, and risk-aware adjustment will produce more reliable tail-risk estimates under actual market conditions.
What would settle it
A head-to-head test on live ETF data during a real stress episode in which the reliability-aware estimates show no accuracy or stability gain over standard tail-risk methods without the four integrated components.
Figures


read the original abstract
Daily ETF risk monitoring can become unreliable when market data quality degrades, market conditions shift, or predictive performance becomes unstable. This paper develops a reliability-aware risk monitoring service for next-day tail-risk surveillance. The proposed framework combines service-time quality checks, lower-tail prediction, uncertainty scoring, and risk-aware adjustment of the tail-risk estimate. We evaluate the system on a daily panel of multiple ETFs augmented with VIX and yield-curve information under a rolling walk-forward design. Empirically, the framework improves tail-risk monitoring, especially during stressed periods, while remaining reliable under simulated input degradation.
Editorial analysis
A structured set of objections, weighed in public.
Referee Report
Summary. The manuscript develops a reliability-aware framework for next-day tail-risk monitoring of ETFs. It integrates four components—service-time quality checks, lower-tail prediction, uncertainty scoring, and risk-aware adjustment—evaluated on a daily panel of ETFs augmented with VIX and yield-curve data under a rolling walk-forward design. The central claim is that the framework empirically improves tail-risk monitoring (especially in stressed periods) while remaining reliable under simulated input degradation.
Significance. If the empirical results are substantiated with concrete, falsifiable metrics and explicit baselines, the work could provide a practical contribution to real-time risk surveillance by addressing data-quality degradation and model instability in ETF monitoring. The integration of reliability mechanisms into tail-risk estimation addresses a relevant operational gap in financial risk management.
major comments (2)
- [Results] Results section: The abstract asserts empirical improvements in tail-risk monitoring but reports no concrete metrics (e.g., tail-event hit rates, expected-shortfall calibration error, or bias reduction), no explicit baselines (historical quantile, GARCH, or plain quantile regression), and no statistical tests. This leaves the load-bearing claim—that the four-component architecture translates into measurable outperformance—unverified and prevents assessment of effect sizes or robustness.
- [§3] §3 (Framework Description): The risk-aware adjustment step is described at a high level without a precise mathematical formulation or pseudocode showing how uncertainty scores modify the tail-risk estimate. Without this, it is impossible to determine whether the adjustment is parameter-free or introduces new degrees of freedom that could affect the reported reliability under degradation.
minor comments (1)
- [Abstract] The abstract and introduction would benefit from a brief statement of the exact data frequency, number of ETFs, and sample period to allow readers to gauge the scope of the walk-forward evaluation.
Simulated Author's Rebuttal
We thank the referee for the constructive comments, which help clarify the presentation of our empirical results and the framework details. We address each major comment below and will revise the manuscript to incorporate the suggested improvements.
read point-by-point responses
-
Referee: [Results] Results section: The abstract asserts empirical improvements in tail-risk monitoring but reports no concrete metrics (e.g., tail-event hit rates, expected-shortfall calibration error, or bias reduction), no explicit baselines (historical quantile, GARCH, or plain quantile regression), and no statistical tests. This leaves the load-bearing claim—that the four-component architecture translates into measurable outperformance—unverified and prevents assessment of effect sizes or robustness.
Authors: We agree that concrete, falsifiable metrics and explicit baselines are necessary to substantiate the central empirical claim. In the revised manuscript, we will expand the Results section to report specific metrics including tail-event hit rates, expected-shortfall calibration errors, and bias reduction measures. We will also add explicit comparisons against baselines such as historical quantiles, GARCH-based models, and plain quantile regression, along with statistical tests (e.g., Diebold-Mariano tests) to evaluate outperformance, with particular emphasis on stressed periods and robustness under data degradation. revision: yes
-
Referee: [§3] §3 (Framework Description): The risk-aware adjustment step is described at a high level without a precise mathematical formulation or pseudocode showing how uncertainty scores modify the tail-risk estimate. Without this, it is impossible to determine whether the adjustment is parameter-free or introduces new degrees of freedom that could affect the reported reliability under degradation.
Authors: We acknowledge that the risk-aware adjustment in §3 is presented at a high level. In the revision, we will add a precise mathematical formulation showing exactly how the uncertainty scores adjust the tail-risk estimate (e.g., via a weighted or threshold-based modification). We will also include pseudocode for the full adjustment procedure and explicitly discuss the parameter count to confirm it remains parameter-light and does not compromise reliability under simulated degradation. revision: yes
Circularity Check
No circularity: purely empirical framework with no derivations or equations
full rationale
The paper presents an empirical reliability-aware monitoring service that combines quality checks, lower-tail prediction, uncertainty scoring, and risk-aware adjustment, then evaluates it on ETF+VIX+yield data under rolling walk-forward design. No mathematical derivations, equations, fitted parameters renamed as predictions, or first-principles results appear in the text. The central claim of empirical improvement (especially in stress) and reliability under degradation is therefore not reducible to any input by construction, self-citation chain, or ansatz smuggling. This is a standard self-contained empirical study with no load-bearing circular steps.
Axiom & Free-Parameter Ledger
Reference graph
Works this paper leans on
-
[1]
CA ViaR: Conditional autoregressive value at risk by regression quantiles,
R. F. Engle and S. Manganelli, “CA ViaR: Conditional autoregressive value at risk by regression quantiles,”Journal of Business & Economic Statistics, vol. 22, no. 4, pp. 367–381, 2004
2004
-
[2]
DeepVaR: A framework for portfolio risk assessment leveraging probabilistic deep neural networks,
G. Fatouros, G. Makridis, D. Kotios, J. Soldatos, M. Filippakis, and D. Kyriazis, “DeepVaR: A framework for portfolio risk assessment leveraging probabilistic deep neural networks,”Digital Finance, vol. 5, no. 1, pp. 29–56, 2023
2023
-
[3]
Time-series foundation AI model for value-at-risk forecasting,
A. Goel, P. Pasricha, and J. Kanniainen, “Time-series foundation AI model for value-at-risk forecasting,” 2024, revised May 2025
2024
-
[4]
Challenges in deploy- ing machine learning: A survey of case studies,
A. Paleyes, R.-G. Urma, and N. D. Lawrence, “Challenges in deploy- ing machine learning: A survey of case studies,”ACM Computing Surveys, vol. 55, no. 6, pp. 114:1–114:29, 2022
2022
-
[5]
Data validation for machine learning,
N. Polyzotis, M. Zinkevich, S. Roy, E. Breck, and S. Whang, “Data validation for machine learning,”Proceedings of Machine Learning and Systems, vol. 1, pp. 334–347, 2019
2019
-
[6]
Challenges to the monitoring of deployed AI systems,
A. Rao, A. Keller, N. Kalra, R. Steed, K. Kwegyir-Aggrey, K. Kly- man, D. Staheli, and A. Bergman, “Challenges to the monitoring of deployed AI systems,” National Institute of Standards and Technology, Gaithersburg, MD, Tech. Rep. NIST AI 800-4, 2026, nIST Trustwor- thy and Responsible AI
2026
-
[7]
Can you trust your model’s uncertainty? evaluating predictive uncertainty under dataset shift,
Y . Ovadia, E. Fertig, J. Ren, Z. Nado, D. Sculley, S. Nowozin, J. V . Dillon, B. Lakshminarayanan, and J. Snoek, “Can you trust your model’s uncertainty? evaluating predictive uncertainty under dataset shift,” inAdvances in Neural Information Processing Systems 32, 2019, pp. 13 991–14 002
2019
-
[8]
A monitoring frame- work for global financial stability,
T. Adrian, D. He, N. Liang, and F. Natalucci, “A monitoring frame- work for global financial stability,” International Monetary Fund, Staff Discussion Note SDN/19/06, 2019
2019
-
[9]
Regression quantiles,
R. Koenker and J. Bassett, Gilbert, “Regression quantiles,”Economet- rica, vol. 46, no. 1, pp. 33–50, 1978
1978
-
[10]
Evaluating interval forecasts,
P. F. Christoffersen, “Evaluating interval forecasts,”International Economic Review, vol. 39, no. 4, pp. 841–862, 1998
1998
-
[11]
Forecasting var and es by using deep quantile regression, gans-based scenario generation, and heterogeneous market hypothesis,
J. Wang, S. Wang, M. Lv, and H. Jiang, “Forecasting var and es by using deep quantile regression, gans-based scenario generation, and heterogeneous market hypothesis,”Financial Innovation, vol. 10, no. 1, 2024
2024
-
[12]
Forecasting VaR and ES in emerging markets: The role of time-varying higher moments,
T. H. Le, “Forecasting VaR and ES in emerging markets: The role of time-varying higher moments,”Journal of Forecasting, vol. 43, no. 2, pp. 402–414, 2024
2024
-
[13]
Proxy-reliance control in conformal recalibration of one- sided value-at-risk,
T. Zhong, “Proxy-reliance control in conformal recalibration of one- sided value-at-risk,” 2026
2026
-
[14]
Modeling ex post variance jumps: Implications for density and tail risk forecasting,
J. M. Maheu and E. Nikolakopoulos, “Modeling ex post variance jumps: Implications for density and tail risk forecasting,”Quantitative Finance, vol. 26, no. 2, pp. 161–183, 2026
2026
-
[15]
Beyond accuracy: What data qual- ity means to data consumers,
R. Y . Wang and D. M. Strong, “Beyond accuracy: What data qual- ity means to data consumers,”Journal of Management Information Systems, vol. 12, no. 4, pp. 5–33, 1996
1996
-
[16]
Out-of- distribution generalization in time series: A survey,
X. Wu, F. Teng, X. Li, J. Zhang, T. Li, and Q. Duan, “Out-of- distribution generalization in time series: A survey,”Information Fusion, p. 104336, 2026, journal pre-proof; available online 3 April 2026
2026
-
[17]
An early-warning risk signals framework to capture systematic risk in financial markets,
V . Ciciretti, M. Nandy, A. Pallotta, S. Lodh, P. K. Senyo, and J. Kartasova, “An early-warning risk signals framework to capture systematic risk in financial markets,”Quantitative Finance, vol. 25, no. 5, pp. 757–771, 2025
2025
-
[18]
The extreme value method for estimating the variance of the rate of return,
M. Parkinson, “The extreme value method for estimating the variance of the rate of return,”The Journal of Business, vol. 53, no. 1, pp. 61–65, 1980
1980
-
[19]
On the estimation of security price volatility from historical data,
M. B. Garman and M. J. Klass, “On the estimation of security price volatility from historical data,”The Journal of Business, vol. 53, no. 1, pp. 67–78, 1980
1980
-
[20]
Greedy function approximation: A gradient boosting machine,
J. H. Friedman, “Greedy function approximation: A gradient boosting machine,”The Annals of Statistics, vol. 29, no. 5, pp. 1189–1232, 2001
2001
-
[21]
A simple unified framework for detecting out-of-distribution samples and adversarial attacks,
K. Lee, K. Lee, H. Lee, and J. Shin, “A simple unified framework for detecting out-of-distribution samples and adversarial attacks,” in Advances in Neural Information Processing Systems 31, 2018, pp. 7167–7177
2018
-
[22]
Simple and scalable predictive uncertainty estimation using deep ensembles,
B. Lakshminarayanan, A. Pritzel, and C. Blundell, “Simple and scalable predictive uncertainty estimation using deep ensembles,” in Advances in Neural Information Processing Systems 30, 2017, pp. 6402–6413
2017
-
[23]
RiskMetrics—technical document,
J.P. Morgan/Reuters, “RiskMetrics—technical document,” J.P. Mor- gan/Reuters, Tech. Rep., 1996, fourth edition, December 17, 1996
1996
-
[24]
On the relation between the expected value and the volatility of the nominal excess return on stocks,
L. R. Glosten, R. Jagannathan, and D. E. Runkle, “On the relation between the expected value and the volatility of the nominal excess return on stocks,”The Journal of Finance, vol. 48, no. 5, pp. 1779– 1801, 1993
1993
-
[25]
A survey on data quality dimensions and tools for machine learning invited paper,
Y . Zhou, F. Tu, K. Sha, J. Ding, and H. Chen, “A survey on data quality dimensions and tools for machine learning invited paper,” in 2024 IEEE International Conference on Artificial Intelligence Testing (AITest), 2024, pp. 120–131
2024
-
[26]
Techniques for verifying the accuracy of risk measure- ment models,
P. H. Kupiec, “Techniques for verifying the accuracy of risk measure- ment models,”The Journal of Derivatives, vol. 3, no. 2, pp. 73–84, 1995
1995
-
[27]
Higher order elicitability and Osband’s principle,
T. Fissler and J. F. Ziegel, “Higher order elicitability and Osband’s principle,”The Annals of Statistics, vol. 44, no. 4, pp. 1680–1707, 2016
2016
discussion (0)
Sign in with ORCID, Apple, or X to comment. Anyone can read and Pith papers without signing in.