Recognition: no theorem link
A Convolutional Neural Network-Derived Catalog of Solar Flares from Soft X-Ray Observations
Pith reviewed 2026-05-10 18:01 UTC · model grok-4.3
The pith
A convolutional neural network identifies over seven times more solar flare candidates than the standard GOES catalog, extending the power-law distribution of flare peak fluxes to smaller events.
A machine-rendered reading of the paper's core claim, the machinery that carries it, and where it could break.
Core claim
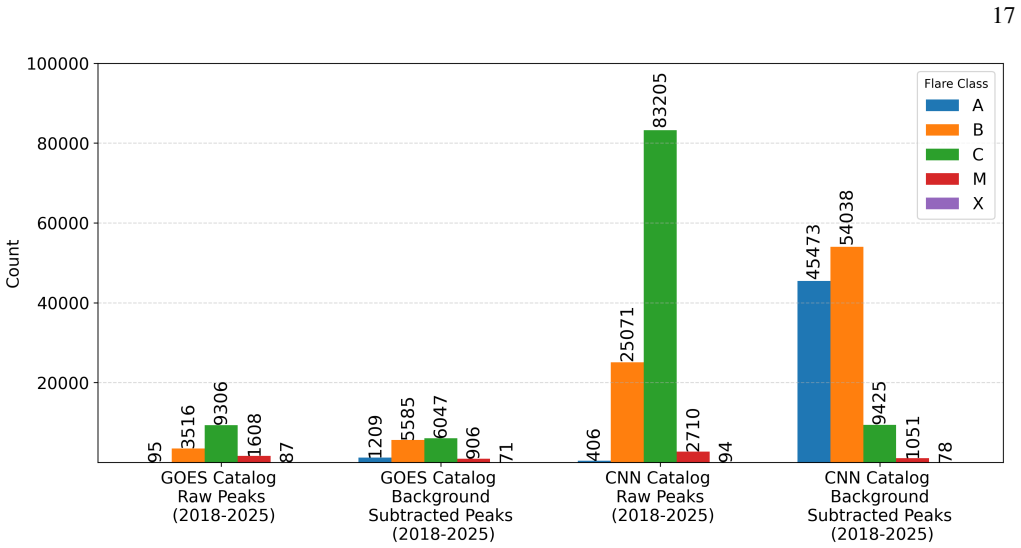
The authors demonstrate that a CNN can be used to construct a new solar flare catalog from 1-second GOES soft X-ray observations by identifying rise episodes, resulting in 111,580 candidates compared to 14,612 in the GOES catalog. After applying Bayesian inference to quantify true positive probabilities, the catalog reveals a power-law distribution of peak fluxes that extends one decade lower in flux than the background-subtracted GOES catalog, with consistent indices after correction. Analysis of waiting times supports a piecewise Poisson process, while highlighting how obscuration biases size-waiting time correlations.
What carries the argument
Convolutional neural network trained to detect flare rise episodes in soft X-ray time series data, followed by Bayesian inference to assign true-positive probabilities based on flux, rise time, and temporal coincidence.
If this is right
- The CNN catalog provides a more complete sample of small solar flares for statistical studies.
- Power-law indices for background-corrected peak fluxes are similar between CNN and GOES catalogs.
- Waiting-time distributions from both catalogs are broadly consistent with a piecewise Poisson process.
- Previously reported correlations between flare sizes and waiting times are significantly influenced by obscuration effects.
- The new catalog serves as a foundation for complete and consistent studies of solar flare statistics.
Where Pith is reading between the lines
- This method could be extended to other time-series datasets from different instruments to create more comprehensive flare catalogs.
- Improved detection of small flares may help quantify their contribution to total solar energy output and coronal heating.
- Accounting for obscuration suggests that flare occurrence rates during active periods are higher than previously measured.
Load-bearing premise
The Bayesian inference accurately quantifies the true positive probability for each candidate based on peak flux, rise time, and temporal coincidence without significant false positives or missed events distorting the distributions.
What would settle it
Independent verification with higher-resolution instruments or multi-wavelength observations showing that a majority of the low-flux CNN candidates are not real flares would falsify the claimed extension of the power-law distribution.
Figures


read the original abstract
A convolutional neural network (CNN) is used to construct a new catalog for solar flares based on high resolution (1-s cadence) Geostationary Operational Environmental Satellites (GOES) soft X-ray data. The CNN is trained to identify flare rise episodes. From 1 January 2018 to 22 August 2025, the algorithm detects 111,580 flare candidates, compared with 14,612 events in the corresponding GOES catalog. For each candidate, the probability of being a true positive is quantified by Bayesian inference based on the peak flux, rise time, and temporal coincidence with cataloged events where available. The flare size and waiting-time distributions are studied and compared with the GOES catalog. The CNN catalog shows a steeper power-law index for raw peak fluxes (-2.59 -\+ 0.02) than GOES (-2.25 -\+ 0.04), indicating the CNN's higher sensitivity to small events. After background correction, the indices are -1.97 -\+ 0.02 (CNN) and -2.05 -\+ 0.04 (GOES). The CNN catalog extends the power-law distribution of flare peak fluxes by one order of magnitude at the small-flux end compared with the GOES background-subtracted catalog. A Bayesian blocks analysis of the waiting-time distributions from the GOES and CNN catalogs indicates broad consistency with a piecewise Poisson process. We find that previously reported correlations between flare sizes and waiting times are significantly influenced by obscuration, that is, under-counting weaker or overlapping flares during periods of elevated flux. The new CNN catalog provides a foundation for complete and consistent studies of solar flare statistics.
Editorial analysis
A structured set of objections, weighed in public.
Referee Report
Summary. The paper trains a convolutional neural network on 1-s cadence GOES soft X-ray data to detect flare rise episodes, producing a catalog of 111,580 candidates from 2018–2025 versus 14,612 events in the official GOES catalog. Bayesian inference assigns true-positive probabilities to each candidate using peak flux, rise time, and temporal coincidence (where available). The authors compare power-law indices of raw and background-corrected peak-flux distributions, finding a steeper index (-2.59 ± 0.02) and one-order-of-magnitude extension at the low-flux end for the CNN catalog relative to GOES (-2.25 ± 0.04 raw; -2.05 ± 0.04 corrected). Waiting-time distributions are analyzed via Bayesian blocks, and previously reported size–waiting-time correlations are attributed to obscuration effects.
Significance. If the CNN detections and Bayesian probabilities are reliable, the work supplies a substantially larger flare catalog that extends statistical studies of flare energetics and occurrence rates to smaller events. The reported difference in power-law indices and the waiting-time analysis could inform flare-triggering models and space-weather statistics. However, the significance is limited by the absence of detailed validation for the CNN and the extrapolation of the Bayesian model below the GOES threshold.
major comments (3)
- [Methods (CNN training)] Methods section (CNN architecture and training): The manuscript provides no description of the CNN architecture, training set composition, loss function, hyperparameters, or quantitative validation metrics (e.g., precision-recall, confusion matrix, or cross-validation scores). These details are required to evaluate whether the network systematically over-detects small, non-GOES-coincident events that drive the steeper power-law index.
- [Bayesian inference] Bayesian inference section: For the 111k candidates lacking temporal coincidence with GOES events, the true-positive probability is computed from peak flux and rise time alone. No calibration or hold-out test is reported that validates the likelihood model or prior at fluxes an order of magnitude below the GOES threshold. This extrapolation is load-bearing for the claimed raw index of -2.59 ± 0.02 and the one-order extension of the background-corrected distribution.
- [Results (power-law analysis)] Results (power-law fits): The steeper CNN index and extended low-flux tail rest on the assumption that the Bayesian posterior correctly classifies the majority of small non-coincident candidates as true flares. Without an independent small-flare reference set or a sensitivity test that varies the Bayesian model, the difference from the GOES index (-2.25 ± 0.04) cannot be unambiguously attributed to higher sensitivity rather than false-positive contamination.
minor comments (2)
- [Abstract] Abstract: the notation “-2.59 -/+ 0.02” should be rendered as ±0.02 for clarity.
- [Results] The manuscript should include a table or figure summarizing CNN performance metrics on a held-out test set and the fraction of candidates accepted at different probability thresholds.
Simulated Author's Rebuttal
We thank the referee for their thorough and constructive review. The comments highlight important areas for clarification and strengthening of the validation. We address each major comment below and will incorporate revisions as noted.
read point-by-point responses
-
Referee: Methods section (CNN architecture and training): The manuscript provides no description of the CNN architecture, training set composition, loss function, hyperparameters, or quantitative validation metrics (e.g., precision-recall, confusion matrix, or cross-validation scores). These details are required to evaluate whether the network systematically over-detects small, non-GOES-coincident events that drive the steeper power-law index.
Authors: We agree that the submitted manuscript omitted these essential details. In the revised version we will add a dedicated subsection describing the CNN architecture (convolutional layers, kernel sizes, pooling, fully connected layers, and dropout), the training set construction (positive examples from GOES-flagged rise episodes and negative examples from quiet periods), the loss function (binary cross-entropy with class weighting), all hyperparameters (learning rate schedule, batch size, number of epochs, early stopping), and quantitative metrics including precision-recall curves, confusion matrices, and 5-fold cross-validation scores on held-out data. These additions will allow direct assessment of detection reliability at low fluxes. revision: yes
-
Referee: Bayesian inference section: For the 111k candidates lacking temporal coincidence with GOES events, the true-positive probability is computed from peak flux and rise time alone. No calibration or hold-out test is reported that validates the likelihood model or prior at fluxes an order of magnitude below the GOES threshold. This extrapolation is load-bearing for the claimed raw index of -2.59 ± 0.02 and the one-order extension of the background-corrected distribution.
Authors: The Bayesian model was constructed by fitting the likelihoods for peak flux and rise time on the subset of candidates that do coincide with GOES events (where ground truth is available) and then applying the same functional forms to non-coincident candidates. While the original submission did not include an explicit hold-out calibration below the GOES threshold, we will add in revision a sensitivity analysis that varies the prior and likelihood parameters over plausible ranges and recomputes the power-law index, demonstrating that the reported value of -2.59 ± 0.02 remains stable. We will also report the fraction of candidates retained at different probability thresholds. revision: partial
-
Referee: Results (power-law fits): The steeper CNN index and extended low-flux tail rest on the assumption that the Bayesian posterior correctly classifies the majority of small non-coincident candidates as true flares. Without an independent small-flare reference set or a sensitivity test that varies the Bayesian model, the difference from the GOES index (-2.25 ± 0.04) cannot be unambiguously attributed to higher sensitivity rather than false-positive contamination.
Authors: We acknowledge that an independent reference catalog of sub-GOES flares does not exist, which limits definitive external validation. However, the steeper index is obtained after applying the same Bayesian procedure to both catalogs and is consistent with the expectation that 1-s cadence data capture rise episodes missed by the standard GOES algorithm. In the revision we will add a sensitivity test that recomputes the power-law index after successively raising the minimum true-positive probability threshold (e.g., >0.5, >0.7, >0.9) and show that the index remains steeper than the GOES value even under conservative cuts. We will also compare the CNN detections against a small manually inspected sample of low-flux events from the same period. revision: partial
Circularity Check
No significant circularity in CNN catalog derivation or statistical claims
full rationale
The paper trains a CNN on GOES soft X-ray time series to detect flare rise episodes, generates 111k candidates, applies Bayesian inference using peak flux, rise time and temporal coincidence to assign true-positive probabilities, then fits power-law indices and waiting-time distributions directly to the resulting catalog and compares them to the independent GOES catalog. No equation or step reduces the reported indices (-2.59, -1.97) or the one-order extension claim to a fitted parameter or self-citation by construction. The analysis remains self-contained against external observational benchmarks with no load-bearing self-citations, ansatzes, or uniqueness theorems invoked.
Axiom & Free-Parameter Ledger
free parameters (2)
- CNN model parameters
- Power-law indices
axioms (2)
- domain assumption Flare rise episodes can be reliably identified from soft X-ray flux time series
- domain assumption Bayesian inference provides accurate probabilities based on the given features
Reference graph
Works this paper leans on
-
[1]
K., Qahwaji, R., & Abed, A
Abed, A. K., Qahwaji, R., & Abed, A. 2021, Advances in Space Research, 67, 2544
2021
-
[2]
2021, Solar Physics, 296, 71
Adithya, H., Kariyappa, R., Shinsuke, I., et al. 2021, Solar Physics, 296, 71
2021
-
[3]
2021, The Astrophysical Journal Supplement Series, 252, 13
Ajello, M., Baldini, L., Bastieri, D., et al. 2021, The Astrophysical Journal Supplement Series, 252, 13
2021
-
[4]
Crosby, N., Dimitropoulou, M., et al
Aschwanden, M., B. Crosby, N., Dimitropoulou, M., et al. 2014, Space Science Reviews, 198
2014
-
[5]
Aschwanden, M. J. 1994, Solar Physics, 152, 53
1994
-
[6]
Aschwanden, M. J. 2015, The Astrophysical Journal, 814, 19
2015
-
[7]
Aschwanden, M. J. 2019, The Astrophysical Journal, 887, 57
2019
-
[8]
J., & Freeland, S
Aschwanden, M. J., & Freeland, S. L. 2012, The Astrophysical Journal, 754, 112
2012
-
[9]
J., Johnson, J
Aschwanden, M. J., Johnson, J. R., & Nurhan, Y. I. 2021, The Astrophysical Journal, 921, 166
2021
-
[10]
J., & McTiernan, J
Aschwanden, M. J., & McTiernan, J. M. 2010, The Astrophysical Journal, 717, 683 40
2010
-
[11]
J., Crosby, N
Aschwanden, M. J., Crosby, N. B., Dimitropoulou, M., et al. 2016, Space Science Reviews, 198, 47
2016
-
[12]
An Empirical Evaluation of Generic Convolutional and Recurrent Networks for Sequence Modeling
Bai, S., Kolter, J. Z., & Koltun, V. 2018, arXiv preprint arXiv:1803.01271 Baiesi,M.,Paczuski,M.,&Stella,A.L.2006,Physical Review Letters, 96, 051103
work page internal anchor Pith review arXiv 2018
-
[13]
R., Clilverd, M
Belcher, S. R., Clilverd, M. A., Rodger, C. J., et al. 2021, Space Weather, 19, e2021SW002820 Benz,A.O.2008,LivingReviewsinSolarPhysics,5,1 Benz,A.O.2017,Livingreviewsinsolarphysics,14,2
2021
-
[14]
Hanasoge, S. M. 2020, The Astrophysical Journal, 898, 98
2020
-
[15]
Biasiotti, L., & Ivanovski, S. L. 2025, Solar Physics, 300, 121
2025
-
[16]
2021, in Joint European Conference on Machine Learning and Knowledge Discovery in Databases, Springer, 559–574
Blanzeisky, W., & Cunningham, P. 2021, in Joint European Conference on Machine Learning and Knowledge Discovery in Databases, Springer, 559–574
2021
-
[17]
1999, Physical review letters, 83, 4662
Vulpiani, A. 1999, Physical review letters, 83, 4662
1999
-
[18]
1990, Astrophysical Journal, Part 1 (ISSN 0004-637X), vol
Bornmann, P. 1990, Astrophysical Journal, Part 1 (ISSN 0004-637X), vol. 356, June 20, 1990, p. 733-742. Research supported by NASA., 356, 733
1990
-
[19]
B., Melatos, A., & Wheatland, M
Carlin, J. B., Melatos, A., & Wheatland, M. S. 2023, The Astrophysical Journal, 948, 76, doi: 10.3847/1538-4357/acc387 Corral, Á. 2004, Physical Review Letters, 92, 108501
-
[20]
S., & Yang, K
Crowley, J., Wheatland, M. S., & Yang, K. 2022, The Astrophysical Journal, 941, 193
2022
-
[21]
S., & Yang, K
Crowley, J., Wheatland, M. S., & Yang, K. 2024, Monthly Notices of the Royal Astronomical Society, 530, 457
2024
-
[22]
2006, Solar Physics, 237, 45 De Prado, M
Cui, Y., Li, R., Zhang, L., He, Y., & Wang, H. 2006, Solar Physics, 237, 45 De Prado, M. L. 2018, Advances in financial machine learning (John Wiley & Sons) der Sande, K. V., Flyer, N., Berger, T. E., & Gagnon, R. 2022, Frontiers in Astronomy and Space Sciences, 9, 1031211
2006
-
[23]
2011, Guide to SDO Data Analysis El Zaar, A., Mansouri, A., Benaya, N., Bakir, T., & El Allati, A
DeRosa, M., & Slater, G. 2011, Guide to SDO Data Analysis El Zaar, A., Mansouri, A., Benaya, N., Bakir, T., & El Allati, A. 2025, Journal of Intelligent Information Systems, 1
2011
-
[24]
2001, Journal of Geophysical Research: Space Physics, 106, 25185
Falconer, D. 2001, Journal of Geophysical Research: Space Physics, 106, 25185
2001
-
[25]
2012, IEEE transactions on pattern analysis and machine intelligence, 35, 1915
Farabet, C., Couprie, C., Najman, L., & LeCun, Y. 2012, IEEE transactions on pattern analysis and machine intelligence, 35, 1915
2012
-
[26]
Farhang, N., Safari, H., & Wheatland, M. S. 2018, The Astrophysical Journal, 859, 41
2018
-
[27]
2022, The Astrophysical Journal, 936, 87, doi: 10.3847/1538-4357/ac85ba
Farhang, N., Shahbazi, F., & Safari, H. 2022, The Astrophysical Journal, 936, 87, doi: 10.3847/1538-4357/ac85ba
-
[28]
S., & Safari, H
Farhang, N., Wheatland, M. S., & Safari, H. 2019, The Astrophysical Journal, 883, L20
2019
-
[29]
D., Montet, B
Feinstein, A. D., Montet, B. T., Ansdell, M., et al. 2020, The Astronomical Journal, 160, 219
2020
-
[30]
2024, Annual Review of Astronomy and Astrophysics, 62, 437 41
Fletcher, L. 2024, Annual Review of Astronomy and Astrophysics, 62, 437 41
2024
-
[31]
R., Hudson, H
Fletcher, L., Dennis, B. R., Hudson, H. S., et al. 2011, Space science reviews, 159, 19
2011
-
[32]
2018, Solar Physics, 293, 28
Florios, K., Kontogiannis, I., Park, S.-H., et al. 2018, Solar Physics, 293, 28
2018
-
[33]
2017, Monthly Notices of the Royal Astronomical Society, 470, 4307
Fulgenzi, W., Melatos, A., & Hughes, B. 2017, Monthly Notices of the Royal Astronomical Society, 470, 4307
2017
-
[34]
E., Rodger, C
George, H. E., Rodger, C. J., Clilverd, M. A., et al. 2019, Space Weather, 17, 1783
2019
-
[35]
2019, arXiv preprint arXiv:1905.12787
Ghojogh, B., & Crowley, M. 2019, arXiv preprint arXiv:1905.12787
-
[36]
Giovanelli, R. G. 1939, Astrophysical Journal, vol. 89, p. 555, 89, 555
1939
-
[37]
2016, Deep learning (MIT press Cambridge)
Goodfellow, I., Bengio, Y., Courville, A., & Bengio, Y. 2016, Deep learning (MIT press Cambridge)
2016
-
[38]
2017, Solar Physics, 292, 77 Günther, M
Gryciuk, M., Siarkowski, M., Sylwester, J., et al. 2017, Solar Physics, 292, 77 Günther, M. N., Zhan, Z., Seager, S., et al. 2020, The Astronomical Journal, 159, 60
2017
-
[39]
2017, in Proceedings of the IEEE conference on computer vision and pattern recognition, 89–98
Haeusser, P., Mordvintsev, A., & Cremers, D. 2017, in Proceedings of the IEEE conference on computer vision and pattern recognition, 89–98
2017
-
[40]
2021, Advances in neural information processing systems, 34, 15908 Hassani,Z.,Mohammadpur,D.,&Safari,H.2025,The Astrophysical Journal Supplement Series, 279, 27
Han, K., Xiao, A., Wu, E., et al. 2021, Advances in neural information processing systems, 34, 15908 Hassani,Z.,Mohammadpur,D.,&Safari,H.2025,The Astrophysical Journal Supplement Series, 279, 27
2021
-
[41]
2018, The Astrophysical Journal, 856, 7
Huang, X., Wang, H., Xu, L., et al. 2018, The Astrophysical Journal, 856, 7
2018
-
[42]
arXiv preprint arXiv:1508.01991 (2015)
Huang, Z., Xu, W., & Yu, K. 2015, arXiv preprint arXiv:1508.01991
-
[43]
2024, Solar Physics, 299, 39
Hudson, H., Cliver, E., White, S., et al. 2024, Solar Physics, 299, 39
2024
-
[44]
Hudson, H. S. 2020a, Monthly Notices of the Royal Astronomical Society, 491, 4435, doi: 10.1093/mnras/stz3121
-
[45]
Hudson, H. S. 2020b, Solar Physics, 295, 132 Ismail Fawaz, H., Forestier, G., Weber, J., Idoumghar, L., & Muller, P.-A. 2019, Data mining and knowledge discovery, 33, 917
2019
-
[46]
Andries, Jesse. 2025, J. Space Weather Space Clim., 15, 14, doi: 10.1051/swsc/2025007
-
[47]
M., & Khoshgoftaar, T
Johnson, J. M., & Khoshgoftaar, T. M. 2019, Journal of big data, 6, 1
2019
-
[48]
2022, Scientific Reports, 12, 16835
Kaki, B., Farhang, N., & Safari, H. 2022, Scientific Reports, 12, 16835
2022
-
[49]
2010, Solar Physics, 266, 301
Kanazir, M., & Wheatland, M. 2010, Solar Physics, 266, 301
2010
-
[50]
Khan, A. A. A., Ullah, M. H., Tabassum, R., & Kabir, M. F. 2024, in 2024 IEEE Kansas Power and Energy Conference (KPEC), IEEE, 1–6
2024
-
[51]
2025, Living Reviews in Solar Physics, 22, 1
Kopp, G. 2025, Living Reviews in Solar Physics, 22, 1
2025
-
[52]
2007, Solar Physics, 243, 3
Kosugi, T., Matsuzaki, K., Sakao, T., et al. 2007, Solar Physics, 243, 3
2007
-
[53]
Kotov, Y. D. 2011, Solar System Research, 45, 93 Krista,L.D.2024,TheAstrophysicalJournal,978,121
2011
-
[54]
D., & Chih, M
Krista, L. D., & Chih, M. 2021, The Astrophysical Journal, 922, 218
2021
-
[55]
J., Grimm, O., et al
Krucker, S., Hurford, G. J., Grimm, O., et al. 2020, Astronomy & Astrophysics, 642, A15
2020
-
[56]
2022, The Astrophysical Journal Supplement Series, 258, 12 42
Landa, V., & Reuveni, Y. 2022, The Astrophysical Journal Supplement Series, 258, 12 42
2022
-
[57]
Laurson, L., Illa, X., & Alava, M. J. 2009, Journal of Statistical Mechanics: Theory and Experiment, 2009, P01019
2009
-
[58]
2020, Monthly Notices of the Royal Astronomical Society, 494, 975
Lei, W., Li, C., Chen, F., et al. 2020, Monthly Notices of the Royal Astronomical Society, 494, 975
2020
-
[59]
2001, The Astrophysical Journal, 555, L133
Lepreti, F., Carbone, V., & Veltri, P. 2001, The Astrophysical Journal, 555, L133
2001
-
[60]
2018, Monthly Notices of the Royal Astronomical Society: Letters, 479, L139
Li, C., Zhong, S., Xu, Z., et al. 2018, Monthly Notices of the Royal Astronomical Society: Letters, 479, L139
2018
-
[61]
2023, Frontiers in Astronomy and Space Sciences, 10, 1177550
Li, M., Cui, Y., Luo, B., Wang, J., & Wang, X. 2023, Frontiers in Astronomy and Space Sciences, 10, 1177550
2023
-
[62]
2022, Space weather, 20, e2021SW002985
Li, M., Cui, Y., Luo, B., et al. 2022, Space weather, 20, e2021SW002985
2022
-
[63]
2020, The Astrophysical Journal, 891, 10
Li, X., Zheng, Y., Wang, X., & Wang, L. 2020, The Astrophysical Journal, 891, 10
2020
-
[64]
P., Dennis, B
Lin, R. P., Dennis, B. R., Hurford, G. J., et al. 2003, The Reuven Ramaty High-Energy Solar Spectroscopic Imager (RHESSI) Mission Description and Early Results, 3
2003
-
[65]
2010, Astronomy & Astrophysics, 511, L2, doi: 10.1051/0004-6361/200913456
Lippiello, E., de Arcangelis, L., & Godano, C. 2010, Astronomy & Astrophysics, 511, L2, doi: 10.1051/0004-6361/200913456
-
[66]
T., & Hamilton, R
Lu, E. T., & Hamilton, R. J. 1991, Astrophysical
1991
-
[67]
380, Oct
Journal, Part 2-Letters (ISSN 0004-637X), vol. 380, Oct. 20, 1991, p. L89-L92., 380, L89
1991
-
[68]
2024, Solar Physics, 299, 72
Lu, L., Tian, Z., Feng, L., et al. 2024, Solar Physics, 299, 72
2024
-
[69]
2017, arXiv preprint arXiv:1712.01252
Ma, W., & Lu, J. 2017, arXiv preprint arXiv:1712.01252
-
[70]
2023, User’s Guide for GOES-R XRS L2 Products
Machol, J., Codrescu, S., & Peck, C. 2023, User’s Guide for GOES-R XRS L2 Products
2023
-
[71]
Martens, P. C. H., Attrill, G. D. R., Davey, A. R., et al. 2012, Solar Physics, 275, 79
2012
-
[72]
Woods, T. N. 2019, The Astrophysical Journal Supplement Series, 244, 13
2019
-
[73]
P., Werth, A., West, C
Mason, J. P., Werth, A., West, C. G., et al. 2023, The Astrophysical Journal, 948, 71
2023
-
[74]
R., Bertsch, D., Chiang, J., et al
Mattox, J. R., Bertsch, D., Chiang, J., et al. 1996, Astrophysical Journal v. 461, p. 396, 461, 396
1996
-
[75]
Moon, Y.-J., Choe, G. S., Yun, H. S., & Park, Y. D. 2001, Journal of Geophysical Research: Space Physics, 106, 29951, doi: 10.1029/2000JA000224
-
[76]
2023, README for Science-Quality GOES 8–15 XRS Data Müller, D., Cyr, O
Mothersbaugh, J., Machol, J., & Zetterlund, E. 2023, README for Science-Quality GOES 8–15 XRS Data Müller, D., Cyr, O. S., Zouganelis, I., et al. 2020, Astronomy & Astrophysics, 642, A1 NASA Goddard Space Flight Center. 2025, RHESSI-3 Flare List„ https://hesperia.gsfc.nasa.gov/rhessi3/ docs/qlook/hsi_flare_list.html
2023
-
[77]
2017, The Astrophysical Journal, 835, 156
Nishizuka, N., Sugiura, K., Kubo, Y., et al. 2017, The Astrophysical Journal, 835, 156
2017
-
[78]
P., Charbonneau, P., McIntosh, S
Norman, J. P., Charbonneau, P., McIntosh, S. W., & Liu,H.-L.2001,TheAstrophysicalJournal,557,891
2001
-
[79]
2018, The Astrophysical Journal, 869, 91
Park, E., Moon, Y.-J., Shin, S., et al. 2018, The Astrophysical Journal, 869, 91
2018
-
[80]
Phan, T. H., & Yamamoto, K. 2020, arXiv preprint arXiv:2006.01413
discussion (0)
Sign in with ORCID, Apple, or X to comment. Anyone can read and Pith papers without signing in.