Recognition: 2 theorem links
· Lean TheoremLandSAR: Visceralizing Landslide Data for Enhanced Situational Awareness in Immersive Analytics
Pith reviewed 2026-05-10 17:43 UTC · model grok-4.3
The pith
LandSAR links landslide simulations to 3D-printed terrain models and gestures to raise situational awareness.
A machine-rendered reading of the paper's core claim, the machinery that carries it, and where it could break.
Core claim
LandSAR visceralizes landslide data by integrating real-time simulations of dynamics, prevention strategies, and climate impacts with 3D-printed tangible terrain models that provide haptic feedback and support gesture-based multi-perspective what-if exploration, which expert evaluations show improves situational awareness and engagement.
What carries the argument
The integration of real-time simulations with 3D-printed terrain models as tangible interfaces for haptic feedback and gesture interaction.
If this is right
- Analysts can explore prevention strategies and climate impacts through intuitive physical interaction.
- Multi-perspective what-if analyses become more accessible for understanding dynamic landslide processes.
- Tangible interfaces improve geographical perception and reduce the cognitive gap with real terrain.
- Expert sessions show higher engagement levels during data analysis sessions.
Where Pith is reading between the lines
- The same tangible-simulation pattern could extend to flood or earthquake modeling where spatial intuition matters.
- Adding quantitative performance measures would give stronger evidence than expert opinion alone.
- Producing accurate 3D prints for many different sites may limit practical scaling.
Load-bearing premise
Qualitative feedback from expert interviews and workshops is enough to establish that adding 3D-printed models and gestures produces measurable gains in situational awareness.
What would settle it
A controlled user study comparing LandSAR against standard screen-based visualizations on standardized situational awareness metrics or task accuracy in predicting landslide outcomes.
Figures


read the original abstract
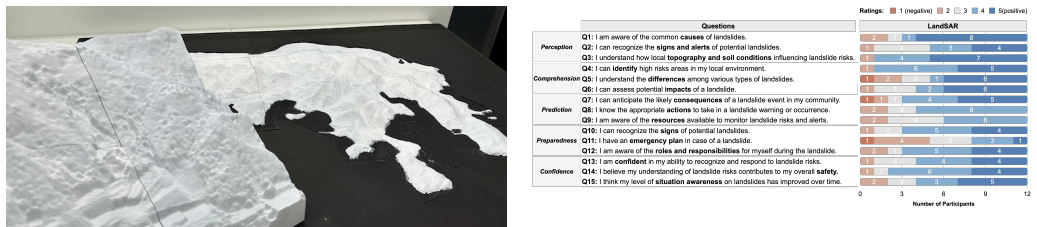
Landslides pose a significant threat to public safety, but their dynamic processes are difficult to analyze from post-event observation alone. Computational simulation is therefore essential, but it generates vast, abstract datasets that create a cognitive gap between the analyst and the real-world, physical terrain. While Immersive Analytics (IA) begins to bridge this gap by visualizing data in 3D, we explore how these systems evolve beyond abstract data and integrate data visceralization to enhance Situational Awareness (SA). We present LandSAR, an immersive analytics system that enhances SA for landslide analysis by visceralizing landslide data through integrated simulations and visualizations. LandSAR supports real-time simulations of landslide dynamics, prevention strategies, and climate impacts, enabling multi-perspective what-if analyses. The system uses 3D-printed terrain models as tangible interfaces to facilitate haptic feedback and enable gesture-based exploration, allowing for intuitive geographical perception. Expert interviews and workshops demonstrate that LandSAR effectively improves SA and engagement.
Editorial analysis
A structured set of objections, weighed in public.
Referee Report
Summary. The paper presents LandSAR, an immersive analytics system for landslide data analysis that integrates real-time simulations of dynamics, prevention strategies, and climate impacts with 3D-printed terrain models serving as tangible interfaces and gesture-based interaction. The central claim is that this visceralization approach enhances situational awareness (SA) and engagement, as demonstrated through expert interviews and workshops.
Significance. If the evaluation evidence holds, the work contributes to immersive analytics and human-computer interaction by providing a concrete implementation of data visceralization that combines computational simulations with physical tangibles for geospatial disaster analysis. This could inform designs for other environmental monitoring applications where bridging abstract data and physical terrain perception is critical. The support for multi-perspective what-if analyses adds practical relevance for risk assessment.
major comments (2)
- [Evaluation section] Evaluation section: The claim that 'expert interviews and workshops demonstrate that LandSAR effectively improves SA and engagement' is load-bearing for the paper's contribution, yet the manuscript provides no details on study design, including number of participants, their selection/expertise criteria, interview protocol, use of any standardized SA instruments (e.g., SAGAT or SART), control conditions, pre/post measures, or qualitative coding method. This prevents verification that reported gains are attributable to the specific integration of simulations, 3D-printed models, and gestures rather than novelty effects.
- [System description] System description (likely §3 or §4): While the integration of real-time simulations with tangible 3D-printed interfaces is described, there is no ablation or comparative analysis showing that the visceralization components produce SA gains beyond standard 3D visualizations or non-tangible immersive setups, leaving the mechanism's unique contribution unisolated.
minor comments (2)
- [Abstract] Abstract and introduction: The term 'visceralizing' is used without a precise definition or reference to prior literature on visceralization in IA, which could improve clarity for readers unfamiliar with the concept.
- [Figures] Figures: Captions for system overview figures could explicitly label the gesture interaction zones and simulation output overlays to aid reproducibility of the described interface.
Simulated Author's Rebuttal
We thank the referee for the detailed and constructive feedback on our manuscript. Below, we provide point-by-point responses to the major comments and indicate the revisions we will make.
read point-by-point responses
-
Referee: [Evaluation section] Evaluation section: The claim that 'expert interviews and workshops demonstrate that LandSAR effectively improves SA and engagement' is load-bearing for the paper's contribution, yet the manuscript provides no details on study design, including number of participants, their selection/expertise criteria, interview protocol, use of any standardized SA instruments (e.g., SAGAT or SART), control conditions, pre/post measures, or qualitative coding method. This prevents verification that reported gains are attributable to the specific integration of simulations, 3D-printed models, and gestures rather than novelty effects.
Authors: We agree that the evaluation section requires more detailed reporting to allow readers to assess the validity of our claims. In the revised manuscript, we will expand this section to describe the study design, including the number and expertise of participants, the interview and workshop protocols, the qualitative coding methods employed, and any measures taken. We will also explicitly address the absence of standardized instruments such as SAGAT or SART, control conditions, and pre/post measures, noting that the evaluation was exploratory and qualitative in nature. Additionally, we will discuss the potential influence of novelty effects as a limitation. This will help clarify that the reported improvements in SA and engagement are based on expert feedback but may benefit from more rigorous future validation. revision: yes
-
Referee: [System description] System description (likely §3 or §4): While the integration of real-time simulations with tangible 3D-printed interfaces is described, there is no ablation or comparative analysis showing that the visceralization components produce SA gains beyond standard 3D visualizations or non-tangible immersive setups, leaving the mechanism's unique contribution unisolated.
Authors: We acknowledge that the paper would be strengthened by an ablation study or comparative analysis to isolate the effects of the visceralization components. However, as this work presents an integrated prototype system, we did not conduct such comparative evaluations in the current study. In the revised manuscript, we will add a discussion on the design rationale for combining simulations, visualizations, and tangible interfaces, drawing on the expert feedback to highlight perceived benefits. We will also include the lack of ablation analysis as a limitation and propose it as an avenue for future work. We believe the contribution lies in the holistic system for landslide analysis, but agree that isolating components would provide additional insight. revision: partial
Circularity Check
No circularity: descriptive system presentation with qualitative evaluation only
full rationale
The paper describes the design and implementation of LandSAR (real-time simulations, 3D-printed terrain, gesture interaction) and reports that expert interviews and workshops demonstrate improved SA and engagement. No equations, derivations, fitted parameters, predictions, or uniqueness theorems appear. The central claim is supported by qualitative feedback rather than any reduction to self-defined inputs or self-citations. This matches the default non-circular case for a systems paper without mathematical claims.
Axiom & Free-Parameter Ledger
Lean theorems connected to this paper
-
IndisputableMonolith/Foundation/RealityFromDistinction.leanreality_from_one_distinction unclear?
unclearRelation between the paper passage and the cited Recognition theorem.
LandSAR supports real-time simulations of landslide dynamics... uses 3D-printed terrain models as tangible interfaces... Expert interviews and workshops demonstrate that LandSAR effectively improves SA and engagement.
-
IndisputableMonolith/Cost/FunctionalEquation.leanJ_uniquely_calibrated_via_higher_derivative unclear?
unclearRelation between the paper passage and the cited Recognition theorem.
simulation-based visceralization... data physicalization... synthesis of analytical and intuitive modes
What do these tags mean?
- matches
- The paper's claim is directly supported by a theorem in the formal canon.
- supports
- The theorem supports part of the paper's argument, but the paper may add assumptions or extra steps.
- extends
- The paper goes beyond the formal theorem; the theorem is a base layer rather than the whole result.
- uses
- The paper appears to rely on the theorem as machinery.
- contradicts
- The paper's claim conflicts with a theorem or certificate in the canon.
- unclear
- Pith found a possible connection, but the passage is too broad, indirect, or ambiguous to say the theorem truly supports the claim.
Reference graph
Works this paper leans on
-
[2]
Alonso et al
L. Alonso et al. CityScope: A Data-Driven Interactive Simulation Tool for Urban Design. Use Case V olpe. InUnifying Themes in Complex Systems IX, pp. 253–261. Springer, Cham, Switzerland, 2018. doi: 10. 1007/978-3-319-96661-8_272, 3
2018
-
[3]
L. W. Barsalou. Grounded Cognition.Annual Review of Psychology, 59(V olume 59, 2008):617–645, 2008. doi:10.1146/annurev.psych.59.103006 .0936392
-
[4]
B. Bell, T. Höllerer, and S. Feiner. An Annotated Situation-Awareness Aid for Augmented Reality. InProc. UIST, p. 213–216. ACM, NY , 2002. doi:10.1145/571985.5720172
-
[5]
K. Bladin et al. Globe Browsing: Contextualized Spatio-Temporal Plane- tary Surface Visualization.IEEE Transactions on Visualization and Com- puter Graphics, 24(1):802–811, 2018. doi:10.1109/TVCG.2017.27439583
-
[6]
H. Bosch et al. ScatterBlogs2: Real-Time Monitoring of Microblog Mes- sages through User-Guided Filtering.IEEE Transactions on Visualization and Computer Graphics, 19(12):2022–2031, 2013. doi: 10.1109/TVCG.2013 .1862
-
[7]
N. Bressa, H. Korsgaard, A. Tabard, S. Houben, and J. Vermeulen. What’s the Situation with Situated Visualization? A Survey and Perspectives on Situatedness.IEEE Transactions on Visualization and Computer Graphics, 28(1):107–117, 2022. doi:10.1109/TVCG.2021.31148353
-
[8]
In: Proceed- ings of the 2021 CHI Conference on Human Factors in Computing Systems
W. Büschel, A. Lehmann, and R. Dachselt. MIRIA: A Mixed Reality Toolkit for the In-Situ Visualization and Analysis of Spatio-Temporal Interaction Data. InProc. CHI. ACM, NY , 2021. doi: 10.1145/3411764. 34456511, 2
-
[9]
T. Chandler et al. Immersive Analytics. In2015 Big Data Visual Analytics (BDVA), pp. 1–8, 2015. doi:10.1109/BDVA.2015.73142961
-
[10]
X. Chu et al. TIVEE: Visual Exploration and Explanation of Badminton Tactics in Immersive Visualizations.IEEE Transactions on Visualization and Computer Graphics, 28(1):118–128, 2022. doi: 10.1109/TVCG.2021. 31148613
-
[11]
A. Clarinval, A. Simonofski, B. Vanderose, and B. Dumas. Public Displays and Citizen Participation: a Systematic Literature Review and Research Agenda.Transforming Government: People, Process and Policy, 15(1):1– 35, Jan 2021. doi:10.1108/TG-12-2019-01272
-
[12]
Coffey, N
D. Coffey, N. Malbraaten, T. B. Le, I. Borazjani, F. Sotiropoulos, A. G. Erd- man, and D. F. Keefe. Interactive Slice WIM: Navigating and Interrogating V olume Data Sets Using a Multisurface, Multitouch VR Interface.IEEE Transactions on Visualization and Computer Graphics, 18(10):1614–1626,
-
[13]
doi:10.1109/TVCG.2011.2833
-
[14]
Cordeil, B
M. Cordeil, B. Bach, A. Cunningham, B. Montoya, R. T. Smith, B. H. Thomas, and T. Dwyer. Embodied Axes: Tangible, Actuated Interaction for 3D Augmented Reality Data Spaces. InProc. CHI, p. 1–12. ACM, NY ,
-
[15]
doi:10.1145/3313831.33766133
-
[16]
M. Cordeil, B. Bach, Y . Li, E. Wilson, and T. Dwyer. Design space for spatio-data coordination: Tangible interaction devices for immersive information visualisation. InProc. PacificVis, pp. 46–50. IEEE, Los Alamitos, 2017. doi:10.1109/PACIFICVIS.2017.80315783
-
[17]
F. Dai, C. Lee, and Y . Ngai. Landslide Risk Assessment and Management: an Overview.Engineering Geology, 64(1):65–87, 2002. doi: 10.1016/ S0013-7952(01)00093-X1
2002
-
[18]
K. Danyluk, B. Ens, B. Jenny, and W. Willett. A Design Space Exploration of Worlds in Miniature. InProc. CHI. ACM, NY , 2021. doi: 10.1145/ 3411764.34450983, 6
-
[19]
M. R. Endsley. Toward a Theory of Situation Awareness in Dy- namic Systems.Human Factors, 37(1):32–64, 1995. doi: 10.1518/ 0018720957790495431, 2
1995
-
[20]
B. Ens et al. Grand Challenges in Immersive Analytics. InProc. CHI. ACM, NY , 2021. doi:10.1145/3411764.34468662
-
[22]
B. Ens et al. Immersive Analytics 2.0: Spatial and Embodied Sensemaking. InProc. CHI EA. ACM, NY , 2022. doi:10.1145/3491101.35037262, 3
-
[23]
A. Everitt and J. Alexander. PolySurface: A Design Approach for Rapid Prototyping of Shape-Changing Displays Using Semi-Solid Surfaces. In Proc. DIS, p. 1283–1294. ACM, NY , 2017. doi:10.1145/3064663.3064677 9
-
[24]
A. R. Fender and C. Holz. Causality-Preserving Asynchronous Reality. InProc. CHI. ACM, NY , 2022. doi:10.1145/3491102.35018362
-
[25]
T. Feng, J. Yang, M.-C. Eppes, Z. Yang, and F. Moser. EVis: Visually Analyzing Environmentally Driven Events.IEEE Transactions on Visual- ization and Computer Graphics, 28(1):912–921, 2022. doi: 10.1109/TVCG. 2021.31148673
-
[26]
J. A. W. Filho, W. Stuerzlinger, and L. Nedel. Evaluating an Immersive Space-Time Cube Geovisualization for Intuitive Trajectory Data Explo- ration.IEEE Transactions on Visualization and Computer Graphics, 26(1):514–524, 2020. doi:10.1109/TVCG.2019.29344151, 2
- [27]
-
[28]
A. Fonnet and Y . Prié. Survey of Immersive Analytics.IEEE Transactions on Visualization and Computer Graphics, 27(3):2101–2122, 2021. doi: 10. 1109/TVCG.2019.29290332
-
[29]
B. Fröhler et al. A Survey on Cross-Virtuality Analytics.Computer Graphics Forum, 41(1):465–494, 2022. doi:10.1111/cgf.144472
-
[30]
A. Genay, M. J. Neylan, W. Laird, T. Romanis, K. Szetey, A. E. Richards, B. Jenny, and T. Chandler. From Diagrams to Experience: Data Visceral- isation of Ecosystem State-and-Transition Models in Virtual Reality. In Proc. DIS, p. 2034–2046. ACM, NY , 2025. doi:10.1145/3715336.3735774 2
-
[31]
Z. Ghaemi, U. Engelke, B. Ens, and B. Jenny. Proxemic maps for im- mersive visualization.Cartography and Geographic Information Science, 49(3):205–219, 2022. doi:10.1080/15230406.2021.20139462
-
[32]
B. Herman, C. D. Jackson, and D. F. Keefe. Touching the Ground: Evalu- ating the Effectiveness of Data Physicalizations for Spatial Data Analy- sis Tasks.IEEE Transactions on Visualization and Computer Graphics, 31(1):875–885, 2025. doi:10.1109/TVCG.2024.34563773, 7
-
[33]
B. Herman, M. Omdal, S. Zeller, C. A. Richter, F. Samsel, G. Abram, and D. F. Keefe. Multi-Touch Querying on Data Physicalizations in Immersive AR.Proc. HCI, 5(ISS), nov 2021. doi:10.1145/34885422, 3
-
[34]
C. Hull and W. Willett. Building with Data: Architectural Models as Inspiration for Data Physicalization. InProc. CHI, p. 1217–1264. ACM, NY , 2017. doi:10.1145/3025453.30258503
-
[35]
Hungr, S
O. Hungr, S. Leroueil, and L. Picarelli. The Varnes classification of landslide types, an update.Landslides, 11(2):167–194, Apr 2014. doi: 10. 1007/s10346-013-0436-y3
2014
-
[36]
H. Hutchinson et al. Technology probes: inspiring design for and with families. InProc. CHI, p. 17–24. ACM, NY , 2003. doi: 10.1145/642611. 6426164
- [37]
-
[38]
M. Kraus et al. Immersive Analytics with Abstract 3D Visualizations: A Survey.Computer Graphics Forum, 41(1):201–229, 2022. doi: 10.1111/cgf .144302
work page doi:10.1111/cgf 2022
-
[39]
J. S. H. Kwan. Supplementary technical guidance on design of rigid debris- resisting barriers. Technical Note TN 2/2012, Geotechnical Engineering Office, Civil Engineering and Development Department, HKSAR, 2012. 6
2012
-
[40]
B. Lee, D. Brown, B. Lee, C. Hurter, S. Drucker, and T. Dwyer. Data Visceralization: Enabling Deeper Understanding of Data Using Virtual Reality.IEEE Transactions on Visualization and Computer Graphics, 27(2):1095–1105, 2021. doi:10.1109/TVCG.2020.30304352, 4
- [41]
-
[42]
H. Li, W. Kam-Kwai, Y . Luo, J. Chen, C. Liu, Y . Zhang, A. K. H. Lau, H. Qu, and D. Liu. Save It for the “Hot” Day: An LLM-Empowered Visual Analytics System for Heat Risk Management.IEEE Transactions on Visualization and Computer Graphics, 31(10):8928–8943, 2025. doi: 10.1109/TVCG.2025.35866892
-
[43]
T. Lu, Q. Zhu, T. Ma, W. Kam-Kwai, A. Xie, A. Endert, and Y . Yang. Ego vs. Exo and Active vs. Passive: Investigating the Individual and Combined Effects of Viewpoint and Navigation on Spatial Immersion and Understanding in Immersive Storytelling. InProc. CHI. ACM, NY , 2025. doi:10.1145/3706598.37138492
-
[44]
G. C. Millar, P. Tabrizian, A. Petrasova, V . Petras, B. Harmon, H. Mitasova, and R. K. Meentemeyer. Tangible Landscape: A Hands-on Method for Teaching Terrain Analysis. InProc. CHI, p. 1–12. ACM, NY , 2018. doi: 10.1145/3173574.31739543
-
[45]
A. V . Moere and D. Hill. Designing for the Situated and Public Visualiza- tion of Urban Data.Journal of Urban Technology, 19(2):25–46, 2012. doi: 10.1080/10630732.2012.6980652
- [46]
-
[47]
G. Myhre et al. Frequency of Extreme Precipitation Increases Exten- sively with Event Rareness under Global Warming.Scientific Reports, 9(1):16063, Nov 2019. doi:10.1038/s41598-019-52277-41
-
[48]
R. Newbury, K. A. Satriadi, J. Bolton, J. Liu, M. Cordeil, A. Prouzeau, and B. Jenny. Embodied Gesture Interaction for Immersive Maps.Cartography and Geographic Information Science, 48(5):417–431, 2021. doi: 10.1080/ 15230406.2021.19294922
-
[49]
C. W. W. Ng, C. E. Choi, H. Liu, S. Poudyal, and J. S. H. Kwan.Design Recommendations for Single and Dual Debris Flow Barriers with and Without Basal Clearance, pp. 33–53. Springer International Publishing, Cham, 2021. doi:10.1007/978-3-030-60196-6_23, 6
-
[50]
C. W. W. Ng, B. Yang, Z. Liu, J. Kwan, and L. Chen. Spatiotemporal Mod- elling of Rainfall-induced Landslides using Machine Learning.Landslides, 18:2499–2514, 2021. doi:10.1007/s10346-021-01662-03, 5
-
[51]
P. Postert, A. E. M. Wolf, and J. Schiewe. Integrating Visualization and Interaction Tools for Enhancing Collaboration in Different Public Participation Settings.ISPRS International Journal of Geo-Information, 11(3):156, 2022. doi:10.3390/ijgi110301562
-
[52]
S. Quinto Lima, G. Buraglia, W. Kam-Kwai, and J. Roberts. Data Bias Recognition in Museum Settings: Framework Development and Contribut- ing Factors. InProc. CHI. ACM, NY , 2025. doi: 10.1145/3706598.3714092 2
-
[53]
P. Reipschläger and R. Dachselt. DesignAR: Immersive 3D-Modeling Combining Augmented Reality with Interactive Displays. InProc. ISS, p. 29–41. ACM, NY , 2019. doi:10.1145/3343055.33597182
-
[54]
J. S. Roo and M. Hachet. One Reality: Augmenting How the Physical World is Experienced by Combining Multiple Mixed Reality Modalities. InProc. UIST, p. 787–795. ACM, NY , 2017. doi:10.1145/3126594.3126638 3
-
[55]
E. B.-N. Sanders and P. J. Stappers. Probes, Toolkits and Prototypes: Three Approaches to Making in Codesigning.CoDesign, 10(1):5–14,
-
[56]
doi:10.1080/15710882.2014.8881833
-
[57]
K. A. Satriadi, A. Cunningham, R. T. Smith, T. Dwyer, A. Drogemuller, and B. H. Thomas. ProxSituated Visualization: An Extended Model of Situated Visualization using Proxies for Physical Referents. InProc. CHI. ACM, NY , USA, 2023. doi:10.1145/3544548.35809522, 3
-
[58]
K. A. Satriadi, B. Ens, M. Cordeil, B. Jenny, T. Czauderna, and W. Willett. Augmented Reality Map Navigation with Freehand Gestures. InProc. VR, pp. 593–603. IEEE, Los Alamitos, 2019. doi:10.1109/VR.2019.87983404
-
[59]
K. A. Satriadi et al. Augmented Scale Models: Presenting Multivariate Data Around Physical Scale Models in Augmented Reality. InProc. ISMAR, pp. 54–63. IEEE, Los Alamitos, 2022. doi: 10.1109/ISMAR55827. 2022.000193
-
[60]
K. A. Satriadi et al. Tangible Globes for Data Visualisation in Augmented Reality. InProc. CHI. ACM, NY , 2022. doi:10.1145/3491102.35177153
-
[61]
L. S. Snyder, Y .-S. Lin, M. Karimzadeh, D. Goldwasser, and D. S. Ebert. Interactive Learning for Identifying Relevant Tweets to Support Real-time Situational Awareness.IEEE Transactions on Visualization and Computer Graphics, 26(1):558–568, 2020. doi:10.1109/TVCG.2019.29346142
-
[62]
Stokes et al
A. Stokes et al. Ecological Mitigation of Hillslope Instability: Ten Key Issues Facing Researchers and Practitioners.Plant and Soil, 377:1–23,
-
[63]
doi:10.1007/s11104-014-2044-61, 3
-
[64]
K. Takahira, W. Kam-Kwai, L. Yang, X. Xu, T. Fujiwara, and H. Qu. TangibleNet: Synchronous Network Data Storytelling through Tangible Interactions in Augmented Reality. InProc. CHI. ACM, NY , 2025. doi: 10.1145/3706598.37142653
-
[65]
R. Taylor. Situational Awareness Rating Technique (Sart): The Develop- ment of a Tool for Aircrew Systems Design. InSituational Awareness, pp. 111–128. Routledge, London, Jul 2017. doi: 10.4324/9781315087924-8 7, 8
- [66]
-
[67]
W. Tong, Z. Chen, M. Xia, L. Y .-H. Lo, L. Yuan, B. Bach, and H. Qu. Exploring Interactions with Printed Data Visualizations in Augmented Reality.IEEE Transactions on Visualization and Computer Graphics, 29(1):418–428, 2023. doi:10.1109/TVCG.2022.32093863
-
[68]
W. Tong, H. Li, M. Xia, W. Kam-Kwai, T.-C. Pong, H. Qu, and Y . Yang. Exploring Spatial Hybrid User Interface for Visual Sensemaking.IEEE Transactions on Visualization and Computer Graphics, 31(10):7062–7077,
-
[69]
doi:10.1109/TVCG.2025.35387713
-
[70]
W. Tong, M. Xia, W. Kam-Kwai, D. A. Bowman, T.-C. Pong, H. Qu, and Y . Yang. Towards an Understanding of Distributed Asymmetric Collaborative Visualization on Problem-solving. In2023 IEEE Conference Virtual Reality and 3D User Interfaces (VR), pp. 387–397, 2023. doi: 10. 1109/VR55154.2023.000543
-
[71]
M. Tory, A. Kirkpatrick, M. Atkins, and T. Moller. Visualization Task Performance with 2D, 3D, and Combination Displays.IEEE Transactions on Visualization and Computer Graphics, 12(1):2–13, 2006. doi: 10.1109/ TVCG.2006.172
2006
-
[72]
V olkwein
A. V olkwein. Flexible Debris Flow Barriers: Design and Application. WSL Berichte 18, Swiss Federal Institute for Forest, Snow and Landscape Research WSL, Birmensdorf, Switzerland, 2014. 6
2014
-
[73]
In: IEEE Conference on Virtual Reality and 3D User Interfaces (VR)
M. Whitlock, S. Smart, and D. A. Szafir. Graphical Perception for Immer- sive Analytics. InProc. VR, pp. 616–625. IEEE, Los Alamitos, 2020. doi: 10.1109/VR46266.2020.000847
-
[74]
M. Whitlock, K. Wu, and D. A. Szafir. Designing for Mobile and Immer- sive Visual Analytics in the Field.IEEE Transactions on Visualization and Computer Graphics, 26(1):503–513, 2020. doi: 10.1109/TVCG.2019. 29342822, 4, 6
-
[75]
W. Willett et al. Perception! Immersion! Empowerment! Superpowers as Inspiration for Visualization.IEEE Transactions on Visualization and Computer Graphics, 28(1):22–32, 2022. doi: 10.1109/TVCG.2021.3114844 2
-
[76]
W. Willett, Y . Jansen, and P. Dragicevic. Embedded Data Representations. IEEE Transactions on Visualization and Computer Graphics, 23(1):461– 470, 2017. doi:10.1109/TVCG.2016.25986083
-
[77]
J. Woodward and J. Ruiz. Analytic Review of Using Augmented Reality for Situational Awareness.IEEE Transactions on Visualization and Com- puter Graphics, 29(4):2166–2183, 2023. doi: 10.1109/TVCG.2022.3141585 2
-
[78]
Yang and L
L. Yang and L. Giovannangeli. Augmented Reality-based Data Storytelling for Citizen Participation in Urban Planning. InIEEE Visualization and Visual Analytics (Poster), 2025. 2
2025
-
[79]
Y . Yang, M. Cordeil, J. Beyer, T. Dwyer, K. Marriott, and H. Pfis- ter. Embodied Navigation in Immersive Abstract Data Visualization: Is Overview+Detail or Zooming Better for 3D Scatterplots?IEEE Trans- actions on Visualization and Computer Graphics, 27(2):1214–1224, 2021. doi:10.1109/TVCG.2020.30304276
-
[80]
Y . Yang, T. Dwyer, K. Marriott, B. Jenny, and S. Goodwin. Tilt Map: Interactive Transitions Between Choropleth Map, Prism Map and Bar Chart in Immersive Environments.IEEE Transactions on Visualization and Computer Graphics, 27(12):4507–4519, 2021. doi: 10.1109/TVCG.2020 .30041372
-
[81]
S. Ye, Z. Chen, X. Chu, Y . Wang, S. Fu, L. Shen, K. Zhou, and Y . Wu. ShuttleSpace: Exploring and Analyzing Movement Trajectory in Immer- sive Visualization.IEEE Transactions on Visualization and Computer Graphics, 27(2):860–869, 2021. doi:10.1109/TVCG.2020.30303923
-
[82]
Y . Zhang, B. Ens, K. A. Satriadi, A. Prouzeau, and S. Goodwin. TimeTa- bles: Embodied Exploration of Immersive Spatio-Temporal Data. InProc. VR, pp. 599–605. IEEE, Los Alamitos, 2022. doi: 10.1109/VR51125.2022. 000802
discussion (0)
Sign in with ORCID, Apple, or X to comment. Anyone can read and Pith papers without signing in.