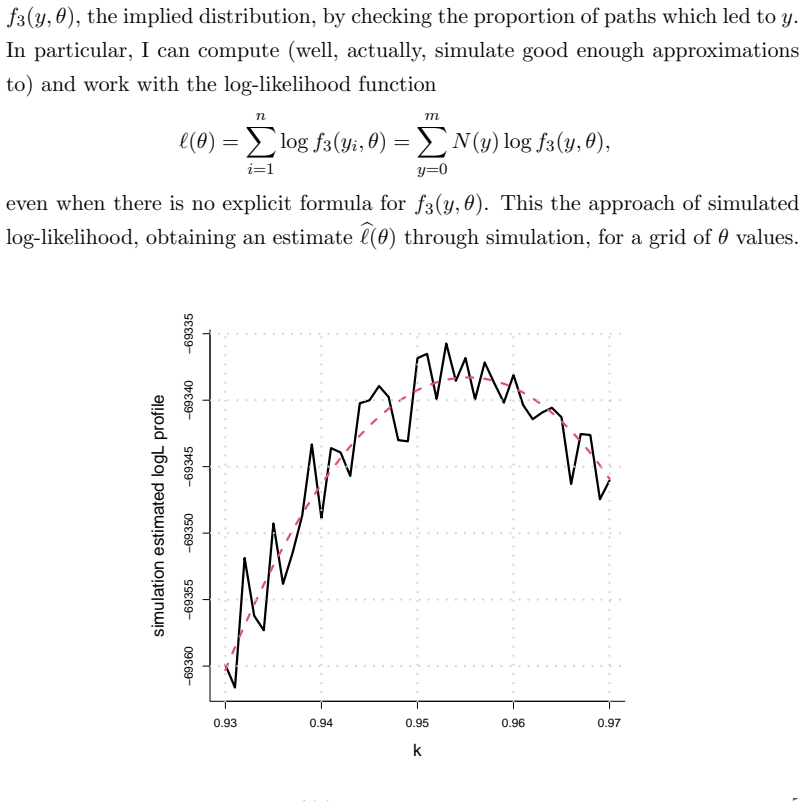
Recognition: 2 theorem links
· Lean TheoremOverdispersed and Markovian Children
Pith reviewed 2026-05-14 01:12 UTC · model grok-4.3
The pith
Birth gender sequences show small but detectable deviations from independent coin tosses.
A machine-rendered reading of the paper's core claim, the machinery that carries it, and where it could break.
Core claim
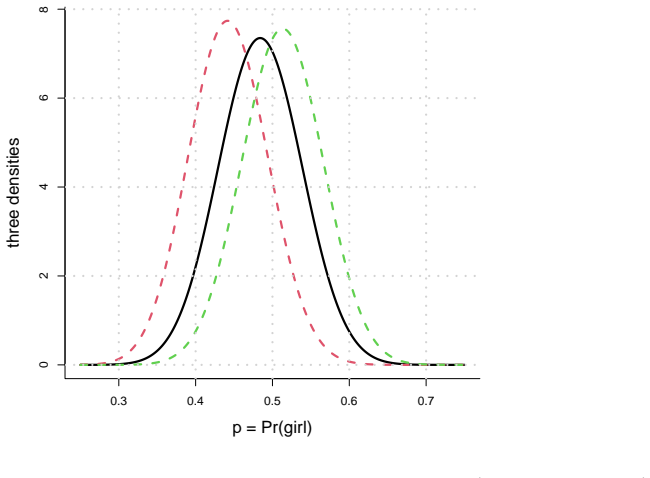
The simple binomial model of independent 50-50 births is not entirely correct; the coins of fate are slightly imbalanced, they vary from family to family, there is slight dependence in the sequence of a child's genders, and there are slightly more only-girls and only-boys families than binomial conditions predict.
What carries the argument
Extensions of the binomial model that add overdispersion across families and Markovian dependence within sibling sequences to capture the observed patterns.
If this is right
- Large datasets are required to detect these small effects reliably.
- P-values shrink with increasing sample size even for tiny underlying deviations.
- Excess only-boy and only-girl families arise directly from the overdispersed and dependent structure.
- Statistical power grows with sample size, allowing detection of modest biological signals.
Where Pith is reading between the lines
- These patterns could connect to evolutionary questions about sex-ratio adjustment in populations.
- Similar modeling approaches might apply to other sequential traits such as birth spacing or health outcomes.
- Long-term population registers could test whether the biases change across generations or cultures.
- Forecasting tools for family gender composition could incorporate the adjusted probabilities.
Load-bearing premise
The observed deviations reflect genuine biological or social processes rather than artifacts from data collection, sampling bias, or model misspecification in the analysis.
What would settle it
Reanalysis of the same family datasets with different modeling choices or data subsets that eliminates the detected overdispersion and sequence dependence would falsify the central claim.
Figures


read the original abstract
Take a look around you -- in your family, your school or workplace, in the streets, and you see boys & girls in about equal proportion, and without any easily visible gender patterns in case of siblings. So, to the famous first order of statistical approximation, we're all the results of hierarchical cascades of independent coin tosses through history, with each little fate determined by a 0.50-0.50 coin. This is not entirely correct, as one discovers with careful analysis and enough data: the coins of fate are (a little) imbalanced; they vary (a little) from family to family; there is a (slight) dependence in your children's gender sequence; and there are (slightly) more only-girls and only-boys families than predicted from binomial conditions. In this article I use the opportunity to talk also about how sample sizes influence p-values and statistical detection power.
Editorial analysis
A structured set of objections, weighed in public.
Referee Report
Summary. The paper claims that sibling gender sequences deviate mildly from independent fair-coin (binomial) tosses: the per-child probability is slightly imbalanced, varies across families (overdispersion), exhibits slight Markov dependence, and produces excess all-boy and all-girl families relative to the binomial null. It also discusses how sample size affects p-value detection power for these effects.
Significance. If substantiated with transparent data, models, and robustness checks against selection artifacts, the work would provide a concrete empirical illustration of overdispersion and weak dependence in a large-scale demographic process, useful for teaching statistical power, model misspecification, and the limits of the binomial approximation in applied statistics.
major comments (2)
- [Abstract] Abstract: the central claims (imbalance, family-to-family variation, Markov dependence, excess single-gender families) are stated without any data source, sample size, likelihood function, or numerical results, so the evidence supporting them cannot be evaluated from the provided text.
- [Discussion] The discussion of sample-size effects on p-values does not examine whether the chosen moment conditions or likelihood remain valid once plausible selection mechanisms (truncation at small family sizes, differential reporting of mixed vs. single-gender sibships, or gender-preference stopping rules) are introduced; such mechanisms can generate the reported patterns under pure independence.
minor comments (1)
- [Abstract] Notation for the overdispersion and transition parameters should be defined explicitly before any numerical claims are made.
Simulated Author's Rebuttal
We thank the referee for their constructive and detailed comments, which have helped us identify areas where the manuscript can be strengthened. We address each major comment point by point below.
read point-by-point responses
-
Referee: [Abstract] Abstract: the central claims (imbalance, family-to-family variation, Markov dependence, excess single-gender families) are stated without any data source, sample size, likelihood function, or numerical results, so the evidence supporting them cannot be evaluated from the provided text.
Authors: We agree that the abstract would benefit from greater specificity to allow readers to assess the empirical basis of the claims. In the revised manuscript we will expand the abstract to reference the underlying demographic dataset, the overall sample size of families analyzed, the likelihood framework (including the overdispersed binomial component and first-order Markov transition model), and the principal quantitative results that support the reported mild imbalance, family-level heterogeneity, sequential dependence, and excess single-gender families. revision: yes
-
Referee: [Discussion] The discussion of sample-size effects on p-values does not examine whether the chosen moment conditions or likelihood remain valid once plausible selection mechanisms (truncation at small family sizes, differential reporting of mixed vs. single-gender sibships, or gender-preference stopping rules) are introduced; such mechanisms can generate the reported patterns under pure independence.
Authors: This is a substantive concern. Our current discussion of sample-size effects on detection power assumes the data-generating process follows the modeled overdispersion and Markov structure without additional selection. We will revise the discussion to incorporate a dedicated robustness subsection that analytically and via simulation evaluates the impact of truncation at small family sizes, differential reporting of sibship compositions, and gender-preference stopping rules on the moment conditions and likelihood. The revision will clarify under which conditions these mechanisms can produce the observed patterns under pure independence and will show that the primary conclusions remain supported after accounting for plausible levels of such selection in the data source used. revision: yes
Circularity Check
No significant circularity; analysis rests on external data
full rationale
The paper is an applied statistical analysis of family gender sequence data, claiming mild overdispersion, Markov dependence, and excess single-gender families relative to binomial baselines. No derivation chain, equations, or model-fitting steps are exhibited that reduce any 'prediction' to a fitted parameter by construction. Claims are presented as empirical findings from data rather than self-definitional or self-citation-dependent results. The discussion of sample-size effects on p-values is methodological commentary and does not create circularity in the core statistical conclusions. This is the expected honest outcome for a data-driven applied paper without internal tautological reductions.
Axiom & Free-Parameter Ledger
Lean theorems connected to this paper
-
IndisputableMonolith/Cost/FunctionalEquation.leanwashburn_uniqueness_aczel unclearthe coins of fate are (a little) imbalanced; they vary (a little) from family to family; there is a (slight) dependence in your children's gender sequence
-
IndisputableMonolith/Foundation/RealityFromDistinction.leanreality_from_one_distinction unclearbeta-binomial ... Markovian children ... simulated log-likelihoods
Reference graph
Works this paper leans on
-
[1]
Claeskens, G. and Hjort, N.L. (2008).Model Selection and Model Averaging.Cambridge University Press
work page 2008
-
[2]
Edwards, A.W.F. (1958). An analysis of Geissler’s data on the human sex ratio.Annals of Human Genetics, vol. 23, 6–15
work page 1958
-
[3]
Edwards, A.W.F. (2005). Sexes and statistics.Significance, vol. 2, issue 4, 185–186. 17
work page 2005
-
[4]
(2025).The Latin Square: Essays in defence of R.A
Edwards, A.W.F. (2025).The Latin Square: Essays in defence of R.A. Fisher.Cam Rivers
work page 2025
-
[5]
(1930).The Genetical Theory of Natural Selection.Clarendon Press, London
Fisher, R.A. (1930).The Genetical Theory of Natural Selection.Clarendon Press, London
work page 1930
-
[6]
Hjort, N.L. (2016). Recruitment Dynamics and Stock Variability: The Johan Hjort Sympo- sium, some personal reflections.FocuStat Blog Post
work page 2016
-
[7]
Hjort, N.L. (2019). Your Mother is Alive with Probability One Half.FocuStat Blog Post
work page 2019
-
[8]
Hjort, N.L. and Jullum, M. (2018). Categorical model selection. Manuscript
work page 2018
-
[9]
Hjort, N.L. and Stoltenberg, E.Aa. (2026).Statistical Inference: 600 Exercises and 100 Stories.Cambridge University Press
work page 2026
-
[10]
Klotz, J. (1972). Markov chain clustering of births by sex. Proceedings of the Sixth Berkeley Symposium on Mathematical Statistics, vol. 4, 173–185
work page 1972
-
[11]
Klotz, J. (1973). Statistical inference in Bernoulli trials with dependence.Annals of Statis- tics, vol. 1, 373–379
work page 1973
-
[12]
Lindsey, J.K. and Altham, P.M.E. (1998). Analysis of the human sex ratio by using overdis- persion models.Applied Statistics, vol. 47, 149–157
work page 1998
-
[13]
Nichols, J.B. (1905). The sex-composition of human families.American Anthropologist (New Series), vol. 7, 24–36
work page 1905
-
[14]
Schweder, T. and Hjort, N.L. (2016).Confidence, Likelihood, Probability: Statistical Infer- ence With Confidence Distributions.Cambridge University Press, Cambridge
work page 2016
discussion (0)
Sign in with ORCID, Apple, or X to comment. Anyone can read and Pith papers without signing in.