Recognition: unknown
A first empirical derivation of the average dust attenuation law at 2<z<7
Pith reviewed 2026-05-10 16:33 UTC · model grok-4.3
The pith
The average dust attenuation law for star-forming galaxies at 2<z<7 follows the same slope and normalization as the local starburst relation.
A machine-rendered reading of the paper's core claim, the machinery that carries it, and where it could break.
Core claim
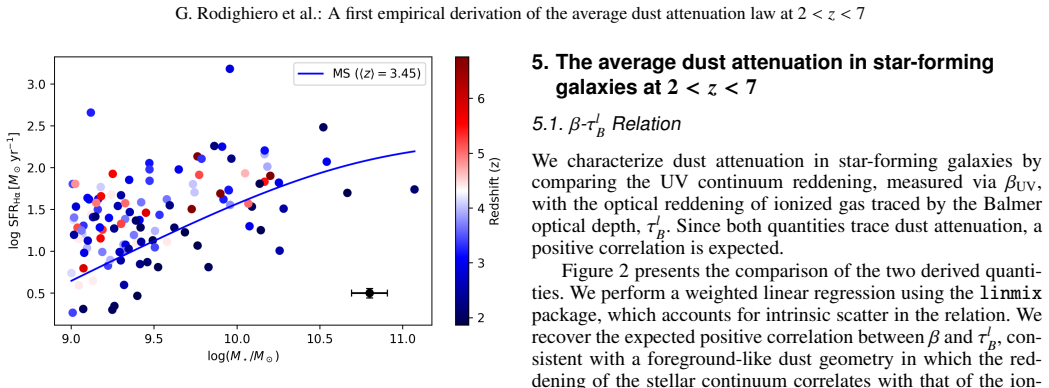
Using NIRSpec spectroscopy and multi-wavelength photometry for a mass-selected sample of 120 galaxies at 2<z<7, the authors stack spectral energy distributions in bins of Balmer optical depth and recover a selective attenuation curve that spans rest-frame 0.16-1.14 microns, is described by a smooth function with normalization R_V=3.98, and is consistent in both slope and normalization with the local starburst attenuation law.
What carries the argument
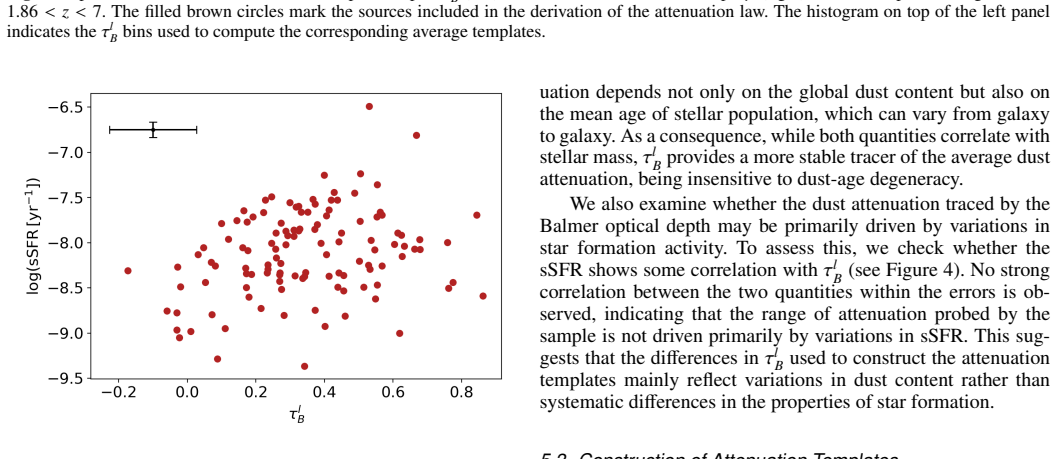
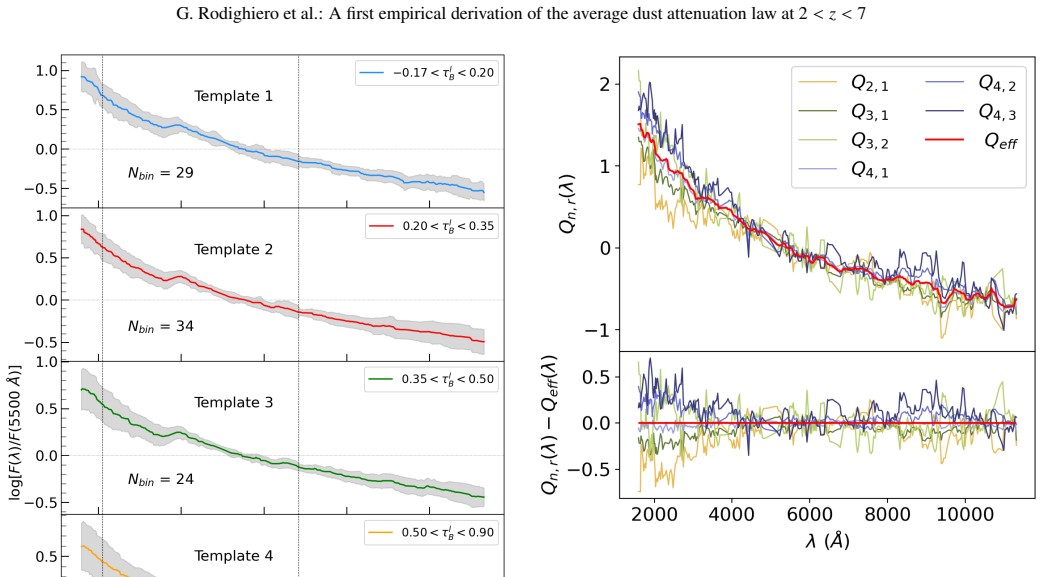
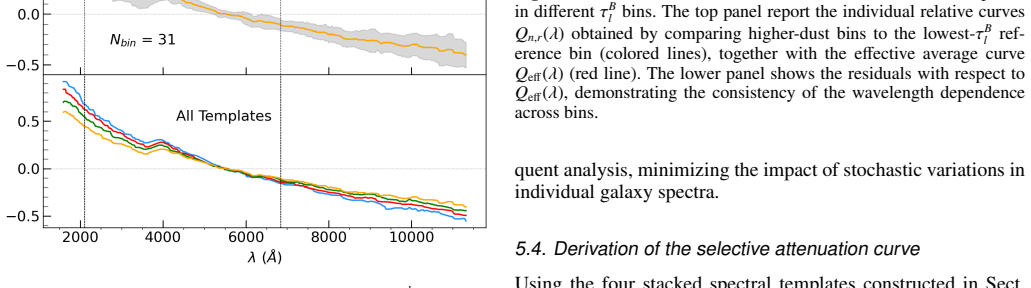
Binning galaxies by measured Balmer decrement (H-alpha/H-beta) and stacking their spectral energy distributions to empirically derive the wavelength-dependent selective attenuation curve.
Where Pith is reading between the lines
- Galaxy evolution models could adopt the local starburst curve as a default dust template out to z=7 without large systematic error in average star-formation-rate estimates.
- The absence of a strong UV bump suggests that dust grain properties in these high-redshift systems are on average similar to those in local starbursts.
- Future surveys could test whether the same average law holds for lower-mass galaxies or for galaxies selected by different criteria such as Lyman-alpha emission.
Load-bearing premise
That the Balmer decrement measured in integrated spectra represents the average dust attenuation experienced by the stellar continuum light across the entire galaxy without major geometric or selection biases.
What would settle it
Finding that attenuation curves recovered from individual galaxy spectra or from different stacking methods differ substantially in slope or normalization from the stacked Balmer-decrement result.
Figures


read the original abstract
Dust attenuation strongly affects the observed spectral energy distributions of galaxies, introducing significant uncertainties in the derivation of key physical properties such as star formation rates, stellar masses, and metallicities. While attenuation curves have been extensively studied in the local Universe and at intermediate redshift, direct spectroscopic constraints at earlier cosmic epochs have remained limited prior to JWST. We aim to derive the average dust attenuation law of star-forming galaxies over the redshift range 2<z<7. We combine NIRSpec spectroscopy from the JADES survey with deep multi-wavelength photometry from the ASTRODEEP catalogs. Using a mass-selected sample (log(M_\star/M_\odot) > 9) of 120 galaxies with reliable Balmer decrement (Ha/Hb), we construct stacked spectral energy distributions in bins of Balmer optical depth and derive the selective attenuation curve following the empirical methodology introduced by Calzetti et al. (2000). The wavelength coverage is further extended toward the near-infrared using MIRI photometry. The resulting attenuation curve spans the rest-frame range 0.16-1.14mu and is well described by a smooth function. We derive a normalization factor R_V=3.98, finding that the average attenuation law is consistent with the local starburst relation in both slope and normalization. Compared to several determinations at intermediate redshift, however, our curve appears systematically flatter in the ultraviolet. We find no significant evidence for a 2175A UV bump in the average attenuation curve. Our results provide the first empirical determination of the average dust attenuation law for star-forming galaxies at 2<z<7 based on JWST spectroscopy. Despite the diversity of attenuation properties observed in individual systems, the ensemble-average behavior remains consistent with the local starburst relation.
Editorial analysis
A structured set of objections, weighed in public.
Referee Report
Summary. The paper claims to provide the first empirical derivation of the average dust attenuation law for star-forming galaxies at 2<z<7. Using NIRSpec spectroscopy from the JADES survey combined with ASTRODEEP multi-wavelength photometry, the authors select a mass-limited sample of 120 galaxies (log M_*/M_⊙ > 9) with reliable Balmer decrements, bin them by Balmer optical depth, construct stacked SEDs (extended to MIRI), and derive the selective attenuation curve following the empirical Calzetti et al. (2000) stacking methodology. They report a normalization R_V=3.98, find the curve consistent with the local starburst law in slope and normalization, note a flatter UV slope than at intermediate redshifts, and report no significant 2175 Å bump.
Significance. If the central result holds, the work is significant because it supplies the first spectroscopy-driven empirical constraint on the ensemble-average dust attenuation law at these redshifts, directly addressing uncertainties in high-z SFR, stellar-mass, and metallicity estimates. The data-driven approach, use of JWST line ratios for binning, and extension to near-IR wavelengths via MIRI are clear strengths that build on an established local methodology while providing a falsifiable, observationally anchored curve.
major comments (2)
- [§2] §2 (sample selection and binning): The exact boundaries of the Balmer optical depth bins and the full error-propagation procedure through the stacking and selective-attenuation calculation are not specified. These details are load-bearing for reproducing the reported R_V=3.98 and for assessing whether the derived curve shape is statistically robust.
- [§4–5] §4–5 (results and discussion): The manuscript does not quantitatively address whether the assumption that the integrated Balmer decrement traces the average stellar-continuum attenuation remains valid at 2<z<7 given possible differences in dust geometry (clumpy distributions, differential attenuation between H II regions and older stars). This assumption is central to interpreting the recovered curve as an unbiased ensemble average and to the claim of consistency with the local starburst law.
minor comments (1)
- [Abstract] Abstract: The S/N or quality threshold used to define 'reliable' Balmer decrements for the 120-galaxy sample is not stated; adding this would improve reproducibility.
Simulated Author's Rebuttal
We thank the referee for their constructive review and recommendation for minor revision. The comments highlight important points for reproducibility and interpretation, and we address each below.
read point-by-point responses
-
Referee: [§2] §2 (sample selection and binning): The exact boundaries of the Balmer optical depth bins and the full error-propagation procedure through the stacking and selective-attenuation calculation are not specified. These details are load-bearing for reproducing the reported R_V=3.98 and for assessing whether the derived curve shape is statistically robust.
Authors: We agree that these details are necessary for full reproducibility. In the revised manuscript we will explicitly list the Balmer optical depth bin boundaries in Section 2 and provide a complete description of the error propagation, including how measurement uncertainties on individual Balmer decrements and photometry are incorporated into the stacked SEDs and the final selective attenuation curve. revision: yes
-
Referee: [§4–5] §4–5 (results and discussion): The manuscript does not quantitatively address whether the assumption that the integrated Balmer decrement traces the average stellar-continuum attenuation remains valid at 2<z<7 given possible differences in dust geometry (clumpy distributions, differential attenuation between H II regions and older stars). This assumption is central to interpreting the recovered curve as an unbiased ensemble average and to the claim of consistency with the local starburst law.
Authors: We acknowledge that the validity of this assumption at high redshift is not quantitatively tested in the current version. A fully quantitative assessment would require detailed radiative-transfer simulations beyond the scope of this empirical study. In the revised manuscript we will add a dedicated paragraph in Section 5 that discusses the potential impact of clumpy dust geometries and differential attenuation between nebular and stellar light, cites relevant literature on high-z dust distributions, and clarifies the limitations while noting that the observed consistency with the local starburst curve provides empirical support for the ensemble-average result. revision: partial
Circularity Check
No significant circularity; derivation is data-driven from new observations
full rationale
The paper bins a new mass-selected sample of 120 galaxies (log M*>9) at 2<z<7 by observed Balmer optical depth from NIRSpec Ha/Hb, constructs stacked multi-band SEDs (including MIRI), and computes the selective attenuation curve directly from the differential extinction between bins using the standard empirical procedure of Calzetti et al. (2000). The output R_V=3.98 and the full 0.16-1.14 micron curve shape are therefore measured quantities, not parameters that were fitted to define the result or imported via self-citation. The subsequent comparison to the local starburst law is a post-hoc consistency check and does not enter the measurement chain. No step reduces by construction to its own inputs, and the central empirical claim rests on independent JWST spectroscopy and photometry rather than on any prior result by the same authors.
Axiom & Free-Parameter Ledger
free parameters (2)
- R_V normalization factor =
3.98
- Balmer optical depth bin boundaries
axioms (2)
- domain assumption The empirical methodology of Calzetti et al. (2000) for deriving selective attenuation from Balmer-binned stacks applies without modification at 2<z<7.
- domain assumption The integrated Balmer decrement traces the average dust attenuation experienced by the stellar continuum light.
Reference graph
Works this paper leans on
-
[1]
J., Bagley, M
Battisti, A. J., Bagley, M. B., Baronchelli, I., et al. 2022, Monthly Notices of the Royal Astronomical Society, 513, 4431–4450
2022
-
[2]
J., Calzetti, D., & Chary, R.-R
Battisti, A. J., Calzetti, D., & Chary, R.-R. 2016, The Astrophysical Journal, 818, 13
2016
-
[3]
J., Calzetti, D., & Chary, R.-R
Battisti, A. J., Calzetti, D., & Chary, R.-R. 2017, The Astrophysical Journal, 851, 90
2017
- [4]
-
[5]
& Charlot, S
Bruzual, G. & Charlot, S. 2003, Monthly Notices of the Royal Astronomical Society, 344, 1000
2003
-
[6]
2001, Publications of the Astronomical Society of the Pacific, 113, 1449
Calzetti, D. 2001, Publications of the Astronomical Society of the Pacific, 113, 1449
2001
-
[7]
C., et al
Calzetti, D., Armus, L., Bohlin, R. C., et al. 2000, ApJ, 533, 682
2000
-
[8]
L., & Storchi-Bergmann, T
Calzetti, D., Kinney, A. L., & Storchi-Bergmann, T. 1994, ApJ, 429, 582
1994
-
[9]
A., Clayton, G
Cardelli, J. A., Clayton, G. C., & Mathis, J. S. 1989, ApJ, 345, 245
1989
-
[10]
C., McLure, R
Carnall, A. C., McLure, R. J., Dunlop, J. S., & Davé, R. 2018, Monthly Notices of the Royal Astronomical Society, 480, 4379–4401
2018
-
[11]
J., McLure, R
Cullen, F., McLeod, D. J., McLure, R. J., et al. 2024, MNRAS, 531, 997
2024
-
[12]
J., McLeod, D
Cullen, F., McLure, R. J., McLeod, D. J., et al. 2023, MNRAS, 520, 14
2023
-
[13]
Curtis-Lake, E., Cameron, A. J., Bunker, A. J., et al. 2025, arXiv e-prints, arXiv:2510.01033 D’Eugenio, F., Cameron, A. J., Scholtz, J., et al. 2025, ApJS, 277, 4
work page internal anchor Pith review Pith/arXiv arXiv 2025
-
[14]
2025, A&A, 698, A234
Dottorini, D., Calabrò, A., Pentericci, L., et al. 2025, A&A, 698, A234
2025
-
[15]
J., Chatzikos, M., Guzmán, F., et al
Ferland, G. J., Chatzikos, M., Guzmán, F., et al. 2023, The 2017 Release of Cloudy
2023
-
[16]
& Hobson, M
Feroz, F. & Hobson, M. P. 2008, MNRAS, 384, 449
2008
-
[17]
P., & Bridges, M
Feroz, F., Hobson, M. P., & Bridges, M. 2009, MNRAS, 398, 1601
2009
-
[18]
Fisher, R., Bowler, R. A. A., Stefanon, M., et al. 2025, MNRAS, 539, 109
2025
-
[19]
2025, in American Astronomical Society Meeting Abstracts, V ol
Glenn, J. 2025, in American Astronomical Society Meeting Abstracts, V ol. 245, American Astronomical Society Meeting Abstracts #245, 216.01
2025
-
[20]
D., Clayton, G
Gordon, K. D., Clayton, G. C., Misselt, K. A., Landolt, A. U., & Wolff, M. J. 2003, ApJ, 594, 279
2003
- [21]
-
[22]
J., Renzini, A., et al
Kashino, D., Lilly, S. J., Renzini, A., et al. 2022, The Astrophysical Journal, 926, 134
2022
-
[23]
Kennicutt, Jr., R. C. 1998, ARA&A, 36, 189
1998
-
[24]
2001, MNRAS, 322, 231
Kroupa, P. 2001, MNRAS, 322, 231
2001
-
[25]
2024, AA, 691, A145
Maiolino, Scholtz, Jan, Curtis-Lake, Emma, et al. 2024, AA, 691, A145
2024
-
[26]
2024, Nature Astronomy, 9, 458–468
Markov, V ., Gallerani, S., Ferrara, A., et al. 2024, Nature Astronomy, 9, 458–468
2024
-
[27]
2025, Nature Astronomy, 9, 458
Markov, V ., Gallerani, S., Ferrara, A., et al. 2025, Nature Astronomy, 9, 458
2025
-
[28]
J., Dunlop, J
McLure, R. J., Dunlop, J. S., Cullen, F., et al. 2018, MNRAS, 476, 3991
2018
-
[29]
2024, Astronomy amp; Astrophysics, 691, A240
Merlin, E., Santini, P., Paris, D., et al. 2024, Astronomy amp; Astrophysics, 691, A240
2024
-
[30]
Mitsuhashi, I., Suess, K. A., Leja, J., et al. 2025, arXiv e-prints, arXiv:2510.13240
-
[31]
2009, Astronomy & Astrophysics, 507, 1793
Noll, S., Burgarella, D., Giovannoli, E., et al. 2009, Astronomy & Astrophysics, 507, 1793
2009
-
[32]
D., Sivaramakrishnan, A., Lajoie, C.-P., et al
Perrin, M. D., Sivaramakrishnan, A., Lajoie, C.-P., et al. 2014, in Society of Photo-Optical Instrumentation Engineers (SPIE) Conference Series, V ol. 9143, Space Telescopes and Instrumentation 2014: Optical, Infrared, and Mil- limeter Wave, ed. J. M. Oschmann, Jr., M. Clampin, G. G. Fazio, & H. A. MacEwen, 91433X
2014
-
[33]
2022, Monthly Notices of the Royal Astronomical Society, 519, 1526 Article number, page 13 of 16 A&A proofs:manuscript no
Popesso, P., Concas, A., Cresci, G., et al. 2022, Monthly Notices of the Royal Astronomical Society, 519, 1526 Article number, page 13 of 16 A&A proofs:manuscript no. aa
2022
-
[34]
A., Kriek, M., Shapley, A
Reddy, N. A., Kriek, M., Shapley, A. E., et al. 2015, The Astrophysical Journal, 806, 259
2015
-
[35]
J., Robertson, B., Tacchella, S., et al
Rieke, M. J., Robertson, B., Tacchella, S., et al. 2023, ApJS, 269, 16
2023
-
[36]
2026, arXiv e-prints, arXiv:2603.15841
Rodighiero, G., Ferrara, A., Catone, M., et al. 2026, arXiv e-prints, arXiv:2603.15841
-
[37]
Salim, S., Boquien, M., & Lee, J. C. 2018, The Astrophysical Journal, 859, 11
2018
-
[38]
& Narayanan, D
Salim, S. & Narayanan, D. 2020, Annual Review of Astronomy and Astro- physics, 58, 529–575
2020
-
[39]
& Narayanan, D
Salim, S. & Narayanan, D. 2020, ARA&A, 58, 529
2020
-
[40]
2016, ApJ, 827, 20
Salmon, B., Papovich, C., Long, J., et al. 2016, ApJ, 827, 20
2016
-
[41]
2024, JADES: A large population of obscured, narrow line AGN at high redshift
Scholtz, J., Maiolino, R., D’Eugenio, F., et al. 2024, JADES: A large population of obscured, narrow line AGN at high redshift
2024
-
[42]
Shivaei, I., Naidu, R. P., Rodriguez Montero, F., et al. 2025, arXiv e-prints, arXiv:2509.01795
-
[43]
2020, ApJ, 899, 117
Shivaei, I., Reddy, N., Rieke, G., et al. 2020, ApJ, 899, 117
2020
-
[44]
A., Steidel, C
Shivaei, I., Reddy, N. A., Steidel, C. C., & Shapley, A. E. 2015, The Astrophys- ical Journal, 804, 149
2015
-
[45]
2024, MNRAS, 535, 2998
Simmonds, C., Tacchella, S., Hainline, K., et al. 2024, MNRAS, 535, 2998
2024
-
[46]
Weingartner, J. C. & Draine, B. T. 2001, ApJ, 548, 296
2001
-
[47]
2023, Nature
Witstok, J., Shivaei, I., Smit, R., Maiolino, R., et al. 2023, Nature
2023
-
[48]
Witt, A. N. & Gordon, K. D. 2000, ApJ, 528, 799
2000
-
[49]
Woodrum, C. et al. 2025, arXiv e-prints [2510.00235] Article number, page 14 of 16 G. Rodighiero et al.: A first empirical derivation of the average dust attenuation law at 2<z<7 Appendix A: NIRSpec artifacts Fig. A.1.Example of a shutter bump feature in the rest-frame spectrum of an object. Sources with a similar unphysical box like structure around the ...
discussion (0)
Sign in with ORCID, Apple, or X to comment. Anyone can read and Pith papers without signing in.