Recognition: unknown
CableTract: A Co-Designed Cable-Driven Field Robot for Low-Compaction, Off-Grid Capable Agriculture
Pith reviewed 2026-05-10 16:30 UTC · model grok-4.3
The pith
A cable-driven robot keeps its heavy power unit on the headland and rolls only a light carriage across the field, reducing compaction and energy use while supporting off-grid operation.
A machine-rendered reading of the paper's core claim, the machinery that carries it, and where it could break.
Core claim
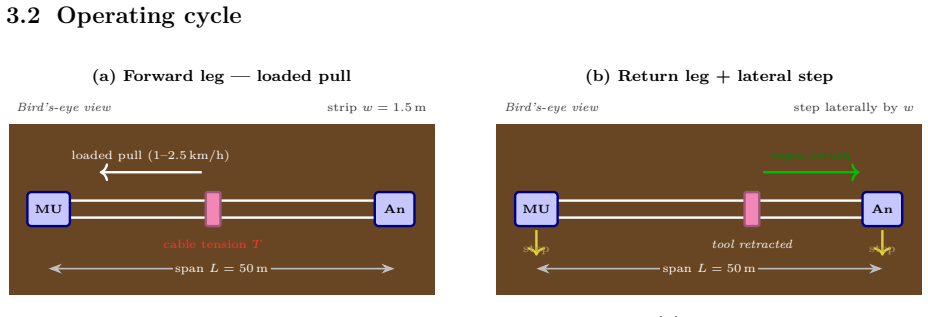
CableTract places the heavy winch, motor, battery, and harvester in a stationary Main Unit on the headland, fixes an Anchor module with helical screw piles, and tensions a cable across the strip so that only a lightweight carriage carrying one of ten co-designed implements travels through the field. The chained models predict lower energy consumption, reduced compaction, and feasible off-grid operation when the system is compared against conventional tractor-implement pairs.
What carries the argument
The co-design of the ten-implement library with the cable architecture, which supplies the data for the stochastic draft model that drives the rest of the simulation chain.
If this is right
- Only the light carriage enters the field, so contact pressure and resulting soil compaction drop below tractor-wheel levels.
- Energy use falls because the heavy Main Unit never traverses the cropped area.
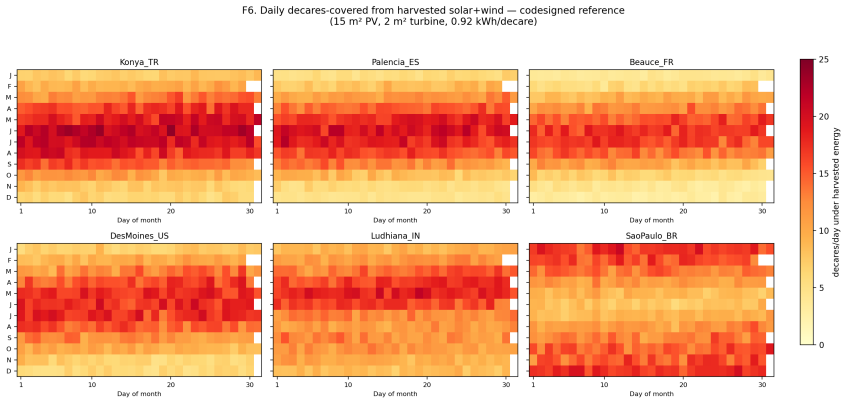
- Hourly solar-wind-battery simulation on six sites shows periods of net-positive renewable generation that can support continuous operation without grid power.
- The polygon coverage planner on the fifty-field corpus defines operating envelopes for cable length, implement speed, and turn time.
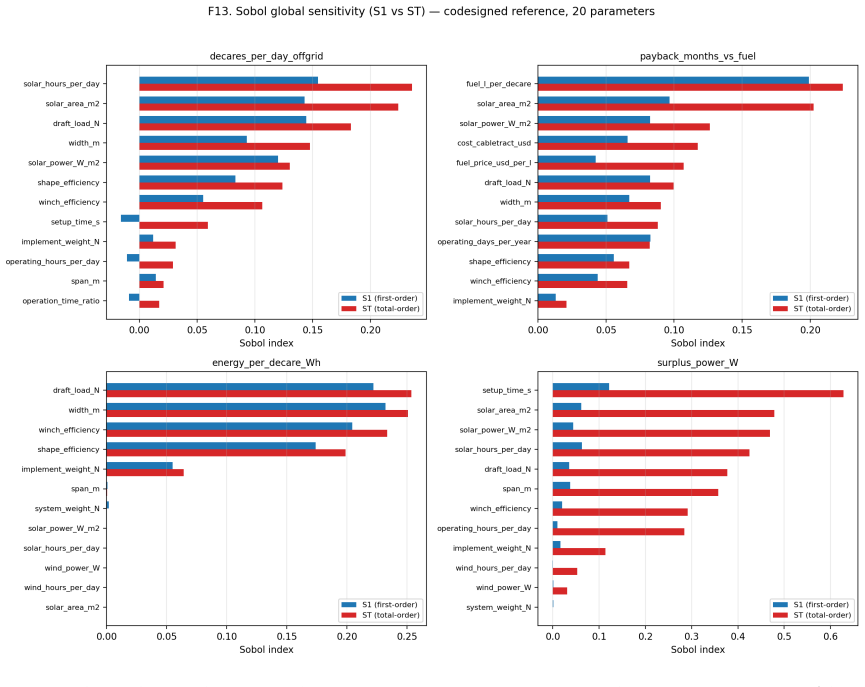
- Global sensitivity analysis on twenty inputs ranks which parameters most affect energy, compaction, and cost outcomes.
Where Pith is reading between the lines
- The same modeling chain could be reused to compare cable robots against other low-compaction concepts such as wide-track or aerial systems without building hardware first.
- If the economics engine shows positive returns, the architecture might suit high-value or fragile soils where conventional traffic is restricted.
- Extending the cable to longer strips or adding multiple anchors would require re-running the coverage planner and sensitivity analysis to check whether the energy and compaction gains persist.
- Farmers could test the open-source code on their own field polygons to estimate site-specific performance before any investment.
Load-bearing premise
The stochastic draft model and the linked sub-models for cable shape, efficiency, solar-wind harvest, compaction, and economics accurately predict real-world performance even though no physical prototype was ever built or tested.
What would settle it
Measure actual soil compaction depth, energy draw per hectare, and battery state-of-charge over a full growing season on a physical CableTract prototype and compare the values directly to the simulation outputs.
Figures


read the original abstract
Conventional field operations spend most of their energy moving the tractor body, not the implement. Yet feasibility studies for novel agricultural vehicles rarely tie mechanics, energy harvest, draft, field geometry, economics, life-cycle CO2, and uncertainty quantification together on a single reproducible code path. This paper builds such a framework and applies it to CableTract, a two-module cable-driven field robot. A stationary Main Unit (winch + motor + battery + harvester module) (MU) and a lighter Anchor module (held by helical screw piles) tension a cable across a strip while a lightweight implement carriage rolls along it. The heavy bodies stay on the headland; only the carriage enters the field. The carriage runs a 10-implement library co-designed for the cable architecture. This co-design is the paper's central analytical lever. The framework is prototype-free. It chains a catenary cable model, a drivetrain efficiency chain, a stochastic draft model fitted to the co-designed library, an hourly solar + wind + battery simulator on six sites, a polygon coverage planner on a 50-field corpus, a contact-pressure compaction model, a discounted cash-flow economics engine with battery replacement and life-cycle CO2, and a global sensitivity analysis on 20 inputs. An operating-envelope sweep and an architectural-variant comparison close the loop. The full implementation is open source. Applied to the codesigned reference, the framework yields energy, compaction advantages and potential off-grid operation.
Editorial analysis
A structured set of objections, weighed in public.
Referee Report
Summary. The manuscript introduces CableTract, a two-module cable-driven field robot (stationary Main Unit with winch/motor/battery/harvester and lighter Anchor module) that tensions a cable across field strips for a lightweight implement carriage. It presents a prototype-free, open-source simulation framework chaining a catenary cable model, drivetrain efficiency chain, stochastic draft model fitted to a co-designed 10-implement library, hourly solar-wind-battery simulator across six sites, polygon coverage planner on a 50-field corpus, contact-pressure compaction model, discounted cash-flow economics with battery replacement and life-cycle CO2, plus global sensitivity analysis on 20 inputs and architectural comparisons. Applied to the co-designed reference, the framework is claimed to demonstrate energy and compaction advantages with potential off-grid operation.
Significance. If the sub-models prove accurate, the work offers a reproducible, integrated modeling pipeline for early-stage co-design and evaluation of novel low-compaction agricultural vehicles, incorporating uncertainty quantification and multi-site energy dynamics. The open-source code release is a clear strength that supports scrutiny and extension.
major comments (2)
- [Abstract] Abstract: The quantitative claims of energy, compaction advantages, and off-grid feasibility are presented as outcomes of the chained simulation framework, yet the manuscript supplies no physical prototype data, experimental measurements, calibration, baseline comparisons, or error bars for draft forces, cable tension, soil compaction, or energy harvest. This leaves the reported advantages dependent on unvalidated model assumptions.
- [Framework description (stochastic draft model)] The stochastic draft model is fitted directly to the same 10-implement co-designed library used for performance predictions in the framework; this introduces circularity that could inflate the apparent advantages of the co-design choices being evaluated.
minor comments (2)
- The abstract references a '50-field corpus' and 'six sites' without detailing selection criteria or providing summary statistics; adding a table of site characteristics and field geometries would improve reproducibility.
- Notation for the efficiency chain and battery replacement schedule could be clarified with an explicit equation or diagram showing how free parameters (e.g., discount rate) propagate into the discounted cash-flow results.
Simulated Author's Rebuttal
We thank the referee for the constructive feedback and for recognizing the potential value of the integrated modeling pipeline and open-source release. We respond point-by-point to the major comments below, acknowledging the simulation-only nature of the work and proposing targeted clarifications.
read point-by-point responses
-
Referee: [Abstract] Abstract: The quantitative claims of energy, compaction advantages, and off-grid feasibility are presented as outcomes of the chained simulation framework, yet the manuscript supplies no physical prototype data, experimental measurements, calibration, baseline comparisons, or error bars for draft forces, cable tension, soil compaction, or energy harvest. This leaves the reported advantages dependent on unvalidated model assumptions.
Authors: We agree that the manuscript is prototype-free and presents no experimental data, as explicitly noted in the abstract and introduction. The work is framed as an early-stage co-design framework that chains established physical models (catenary cable, contact-pressure compaction) with fitted components for novel elements, enabling reproducible evaluation of energy, compaction, and economics across sites and fields before hardware exists. We will revise the abstract, add an explicit limitations subsection, and expand the discussion to state model assumptions, the absence of calibration data, and the framework's intended role in guiding subsequent prototyping and validation. The open-source code is provided precisely to support such extensions by others. revision: partial
-
Referee: [Framework description (stochastic draft model)] The stochastic draft model is fitted directly to the same 10-implement co-designed library used for performance predictions in the framework; this introduces circularity that could inflate the apparent advantages of the co-design choices being evaluated.
Authors: The stochastic draft model is fitted to the 10-implement library because these implements are novel and co-designed specifically for the cable architecture, with no independent empirical datasets available. The fitting derives draft-force distributions from the co-design parameters (geometry, mass, operating envelope) to enable system-level predictions of cable tension, energy use, and compaction. While this approach ties the model to the evaluated designs, the framework predictions concern the integrated robot (winch dynamics, coverage planner, battery model, economics) rather than isolated draft re-testing. We acknowledge the risk of optimistic bias and will revise the methods to detail the fitting procedure, add a dedicated paragraph on this limitation, and highlight how the 20-input global sensitivity analysis and architectural-variant comparisons serve as robustness checks. revision: partial
Circularity Check
Stochastic draft model fitted to co-designed implement library makes performance predictions partly self-referential
specific steps
-
fitted input called prediction
[Abstract]
"This co-design is the paper's central analytical lever. ... It chains a catenary cable model, a drivetrain efficiency chain, a stochastic draft model fitted to the co-designed library, an hourly solar + wind + battery simulator on six sites, a polygon coverage planner on a 50-field corpus, a contact-pressure compaction model..."
The stochastic draft model is fitted directly to the 10-implement library that was co-designed for the cable architecture. The framework then applies this fitted model to predict the energy, compaction, and off-grid advantages of the identical architecture, so the claimed benefits incorporate the design choices embedded in the fit rather than arising from independent validation data.
full rationale
The paper's central quantitative claims rest on a chained simulation framework whose load-bearing draft sub-model is explicitly fitted to the same 10-implement library that was co-designed for the CableTract architecture. This creates a fitted-input-called-prediction pattern: the model parameters encode the design choices being evaluated, so reported energy, compaction, and off-grid advantages are partly defined by construction rather than by independent data. Other sub-models (catenary, solar-wind-battery, coverage planner) are drawn from external standards and do not exhibit the same reduction. No self-citation chains, uniqueness theorems, or ansatzes are load-bearing. The overall circularity is therefore partial (score 5) rather than total.
Axiom & Free-Parameter Ledger
free parameters (2)
- stochastic draft model parameters
- battery replacement schedule and discount rate
axioms (2)
- standard math Catenary equation governs cable shape and tension under self-weight and carriage load
- domain assumption Hourly solar and wind resource data from six sites are representative of operating conditions
invented entities (1)
-
CableTract two-module cable-driven architecture with 10-implement co-designed library
no independent evidence
Reference graph
Works this paper leans on
-
[1]
Orlando and A
R. Orlando and A. Zoffoli,Agricultural traction system with cable and hoists, U.S. Patent 8763714 B2, July 2014
2014
-
[2]
Joseph, MI, March 2011 (R2015)
American Society of Agricultural and Biological Engineers,ASABE Standard D497.7: Agri- cultural Machinery Management Data, ASABE, St. Joseph, MI, March 2011 (R2015). 49
2011
-
[3]
Joseph, MI, 2006 (R2020)
American Society of Agricultural and Biological Engineers,ASABE Engineering Practice EP496.3: Agricultural Machinery Management, ASABE, St. Joseph, MI, 2006 (R2020)
2006
-
[4]
M.M.H. Khand, “Lateral capacity of group helical piles in sand: an experimental and numer- ical study for sustainable infrastructures,”International Journal of Geotechnical Engineering, vol. 18, nos. 7–10, pp. 728–742, 2024. doi:10.1080/19386362.2024.2406372
-
[5]
magnumpiering.com
Magnum Piering, Inc.,Magnum Helical Pile Allowable Lateral Shaft Capacity (lbs) — Fixed- Head Condition, product datasheet, October 2024 revision. magnumpiering.com
2024
-
[6]
Hubbell Power Systems / CHANCE Foundation Solutions,CHANCE Technical Design Manual, 5th ed., Hubbell Power Systems, Centralia, MO, 2024, 337pp
2024
-
[7]
Irvine,Cable Structures, MIT Press, Cambridge, MA, 1981
H.M. Irvine,Cable Structures, MIT Press, Cambridge, MA, 1981
1981
-
[8]
Feyrer,Wire Ropes: Tension, Endurance, Reliability, 2nd ed., Springer, Berlin Heidelberg,
K. Feyrer,Wire Ropes: Tension, Endurance, Reliability, 2nd ed., Springer, Berlin Heidelberg,
-
[9]
doi:10.1007/978-3-642-54996-0
-
[10]
Modelling of power and energy requirements for tillage implements operating in Serdang sandy clay loam, Malaysia,
A.F. Kheiralla, A. Yahya, M. Zohadie, and W. Ishak, “Modelling of power and energy requirements for tillage implements operating in Serdang sandy clay loam, Malaysia,”Soil and Tillage Research, vol. 78, no. 1, pp. 21–34, 2004
2004
-
[11]
Siemens and W
J.C. Siemens and W. Bowers,Machinery Management: How to Select Machinery to Fit the Real Needs of Farm Managers, Farm Business Management series, Deere & Company, Moline, IL, 1999
1999
-
[12]
The absorption of radiation in solar stills,
P.I. Cooper, “The absorption of radiation in solar stills,”Solar Energy, vol. 12, no. 3, pp. 333–346, 1969
1969
-
[13]
Insolation in relation to cloudiness and cloud density,
B. Haurwitz, “Insolation in relation to cloudiness and cloud density,”Journal of Meteorology, vol. 2, no. 3, pp. 154–166, 1945
1945
-
[14]
Justus,Winds and Wind System Performance, Franklin Institute Press, Philadelphia, PA, 1978
C.G. Justus,Winds and Wind System Performance, Franklin Institute Press, Philadelphia, PA, 1978
1978
-
[15]
Druckverteilung im Boden und Bodenverformung unter Schlepperreifen,
W. Söhne, “Druckverteilung im Boden und Bodenverformung unter Schlepperreifen,”Grund- lagen der Landtechnik, no. 5, pp. 49–63, 1953
1953
-
[16]
Challenges in the development of analytical soil compaction models,
T. Keller and M. Lamandé, “Challenges in the development of analytical soil compaction models,”Soil and Tillage Research, vol. 111, no. 1, pp. 54–64, 2010
2010
-
[17]
Hammond and C.I
G.P. Hammond and C.I. Jones,Inventory of Carbon and Energy (ICE), version 3.0, University of Bath / Circular Ecology, Bath, UK, 2019
2019
-
[18]
Emilsson and L
E. Emilsson and L. Dahllöf,Lithium-Ion Vehicle Battery Production: Status 2019 on Energy Use, CO2 Emissions, Use of Metals, Products’ Environmental Footprint, and Recycling, IVL Swedish Environmental Research Institute, Report C444, Stockholm, 2019
2019
-
[19]
Fraunhofer Institute for Solar Energy Systems ISE,Photovoltaics Report, Freiburg, Germany, updated February 2022
2022
-
[20]
Comparative environmen- tal life cycle assessment of conventional and electric vehicles,
T.R. Hawkins, B. Singh, G. Majeau-Bettez, and A.H. Strømman, “Comparative environmen- tal life cycle assessment of conventional and electric vehicles,”Journal of Industrial Ecology, vol. 17, no. 1, pp. 53–64, 2013
2013
-
[21]
UK Department for Environment, Food & Rural Affairs,UK Government GHG Conversion Factors for Company Reporting — 2023, DEFRA, London, 2023
2023
-
[22]
European Environment Agency,Greenhouse Gas Emission Intensity of Electricity Generation in Europe, EEA, Copenhagen, 2023
2023
-
[23]
BloombergNEF,Lithium-ion Battery Price Survey 2024, Bloomberg New Energy Finance, December 2024. 50
2024
-
[24]
Global sensitivity indices for nonlinear mathematical models and their Monte Carlo estimates,
I.M. Sobol’, “Global sensitivity indices for nonlinear mathematical models and their Monte Carlo estimates,”Mathematics and Computers in Simulation, vol. 55, nos. 1–3, pp. 271–280,
-
[25]
doi:10.1016/S0378-4754(00)00270-6
-
[26]
Saltelli, M
A. Saltelli, M. Ratto, T. Andres, F. Campolongo, J. Cariboni, D. Gatelli, M. Saisana, and S. Tarantola,Global Sensitivity Analysis: The Primer, John Wiley & Sons, Chichester, UK, 2008
2008
-
[27]
SALib: an open-source Python library for sensitivity analysis,
J. Herman and W. Usher, “SALib: an open-source Python library for sensitivity analysis,” Journal of Open Source Software, vol. 2, no. 9, p. 97, 2017. doi:10.21105/joss.00097
-
[28]
T. Iwanaga, W. Usher, and J. Herman, “Toward SALib 2.0: advancing the accessibility and interpretability of global sensitivity analyses,”Socio-Environmental Systems Modelling, vol. 4, p. 18155, 2022. doi:10.18174/sesmo.18155. 51
discussion (0)
Sign in with ORCID, Apple, or X to comment. Anyone can read and Pith papers without signing in.