Recognition: unknown
Raiven: LLM-Based Visualization Authoring via Domain-Specific Language Mediation
Pith reviewed 2026-05-10 16:44 UTC · model grok-4.3
The pith
Raiven uses a domain-specific language to let LLMs create correct and verifiable visualizations for scientific and information data.
A machine-rendered reading of the paper's core claim, the machinery that carries it, and where it could break.
Core claim
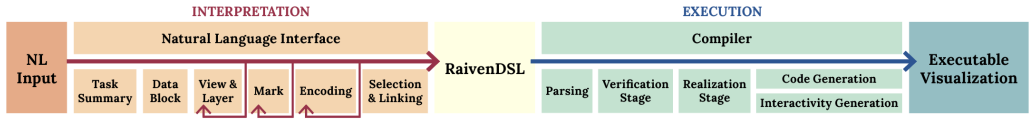
Raiven mediates visualization authoring through RaivenDSL, a formally defined domain-specific language. The LLM produces compact specifications under schema-guided constraints, and a deterministic compiler translates them to D3 or VTK.js code. Because the LLM operates only on metadata, specifications are verifiable before execution and data fabrication is impossible by construction. In a 100-task benchmark Raiven achieves 100% compilation success, runs up to six times faster and cheaper than state-of-the-art LLMs, and improves interaction quality, correctness, and data faithfulness; an expert user study confirms reduced debugging effort.
What carries the argument
RaivenDSL, the domain-specific language that unifies scientific and information visualization and serves as the constrained interface between the LLM and the deterministic compiler.
If this is right
- The same authoring interface works for both scientific and information visualization tasks.
- All generated visualizations can be inspected and verified before any code executes.
- Data fabrication is prevented by design because the LLM never sees or generates raw data values.
- Expert users spend significantly less time debugging than with direct LLM code generation.
- The approach delivers up to sixfold gains in speed and cost while maintaining or improving output quality.
Where Pith is reading between the lines
- The same mediation pattern could be applied to other LLM-driven tasks that currently suffer from non-deterministic or unverifiable outputs.
- Limiting models to metadata-only interaction may become a practical safeguard for any visualization or analysis system where data integrity matters.
- Extending the DSL to additional visualization types or backends would test how far the unification claim generalizes.
Load-bearing premise
Schema-guided constraints are sufficient for the LLM to reliably produce correct, complete RaivenDSL specifications that fully cover the requirements of both scientific and information visualizations without needing manual correction.
What would settle it
A benchmark task where the generated RaivenDSL specification compiles and runs but produces a visualization that misrepresents the underlying data or fails to satisfy the original natural-language request.
Figures


read the original abstract
Visualization is central to scientific discovery, yet authoring tools remain split between information and scientific visualization, and expertise in one rarely transfers to the other. Large Language Model (LLM) based systems promise to bridge this gap through natural language, but current approaches generate code non-deterministically, with no guarantee of correctness and no protection against silent data fabrication. We present Raiven, a conversational system that mediates visualization authoring through a formally defined domain-specific language. RaivenDSL unifies scientific and information visualization in a single representation spanning 2D, 3D, and tabular data. The LLM produces a compact RaivenDSL specification under schema-guided constraints, and a deterministic compiler translates it to executable D3 or VTK.js code. Because the LLM operates only on dataset metadata, outputs are deterministic, specifications are verifiable before execution, and data fabrication is impossible by construction. In a 100-task benchmark, Raiven achieves 100% compilation, is up to six times faster and six times cheaper than state-of-the-art LLMs, while improving interaction quality, correctness, and data faithfulness. An expert user study shows that Raiven significantly reduces debugging effort and makes it easier to produce correct visualizations.
Editorial analysis
A structured set of objections, weighed in public.
Referee Report
Summary. The paper presents Raiven, a conversational visualization authoring system that mediates LLM generation through a formally defined domain-specific language (RaivenDSL). RaivenDSL unifies scientific and information visualization across 2D, 3D, and tabular data. The LLM produces compact, schema-constrained RaivenDSL specifications from natural language; a deterministic compiler then translates them to executable D3 or VTK.js code. This design ensures outputs are deterministic, verifiable before execution, and free of data fabrication by construction. The authors report 100% compilation success on a 100-task benchmark, up to 6x improvements in speed and cost over state-of-the-art LLMs, plus gains in interaction quality, correctness, and data faithfulness; an expert user study indicates reduced debugging effort and easier production of correct visualizations.
Significance. If the quantitative and user-study results hold under transparent evaluation, the work offers a principled way to make LLM-based visualization authoring reliable and cross-domain. The DSL mediation plus deterministic compilation directly addresses non-determinism and silent errors that plague direct code generation. The formal unification of sci/info viz primitives and the emphasis on pre-execution verifiability are genuine strengths that could influence future hybrid LLM+DSL systems.
major comments (2)
- [Abstract / Evaluation] The 100-task benchmark (Abstract) reports 100% compilation success and claims of improved correctness and data faithfulness, yet provides no breakdown of semantic error rates, task coverage for complex 3D interactions or custom data transformations, or how 'correctness' was scored beyond syntactic compilation. Compilation verifies only syntactic/type validity via the deterministic compiler; without semantic analysis or coverage metrics against real visualization requirements, the claim that schema constraints suffice for complete, correct specifications remains unsubstantiated.
- [System Description / Evaluation] The central assumption that schema-guided constraints enable the LLM to produce RaivenDSL specifications that fully cover user intent for both scientific and information visualizations (including edge cases) is load-bearing for the reliability claims. The manuscript should include an explicit analysis of DSL primitive coverage, omission rates, or cases requiring manual correction; the current evidence rests on aggregate benchmark numbers without these diagnostics.
minor comments (2)
- [Abstract] The abstract states 'up to six times faster and six times cheaper' without naming the exact baseline LLMs, prompt conditions, or hardware setup used for the comparison.
- [User Study] The expert user study is summarized only at a high level; details on participant background, specific tasks, quantitative measures of debugging effort, and statistical tests would strengthen the presentation.
Simulated Author's Rebuttal
We thank the referee for their constructive and detailed feedback. We address the two major comments point by point below, acknowledging the need for greater transparency in our evaluation and outlining specific revisions to the manuscript.
read point-by-point responses
-
Referee: [Abstract / Evaluation] The 100-task benchmark (Abstract) reports 100% compilation success and claims of improved correctness and data faithfulness, yet provides no breakdown of semantic error rates, task coverage for complex 3D interactions or custom data transformations, or how 'correctness' was scored beyond syntactic compilation. Compilation verifies only syntactic/type validity via the deterministic compiler; without semantic analysis or coverage metrics against real visualization requirements, the claim that schema constraints suffice for complete, correct specifications remains unsubstantiated.
Authors: We agree that the current presentation of the benchmark results would benefit from additional granularity. The 100% compilation rate specifically validates the effectiveness of schema-guided constraints in producing syntactically and type-valid RaivenDSL specifications, which by design eliminates data fabrication and enables pre-execution verification. Claims regarding improved correctness, interaction quality, and data faithfulness are supported by the expert user study, in which participants directly compared outputs on semantic fidelity to user intent and input data. To strengthen the evidence, we will revise the evaluation section to include: (i) a categorized breakdown of the 100 tasks (e.g., by 2D/3D, scientific vs. information viz, and presence of custom transformations), (ii) semantic error rates derived from expert review of generated visualizations, and (iii) explicit criteria used to score correctness in the user study. These additions will better substantiate coverage of user intent. revision: yes
-
Referee: [System Description / Evaluation] The central assumption that schema-guided constraints enable the LLM to produce RaivenDSL specifications that fully cover user intent for both scientific and information visualizations (including edge cases) is load-bearing for the reliability claims. The manuscript should include an explicit analysis of DSL primitive coverage, omission rates, or cases requiring manual correction; the current evidence rests on aggregate benchmark numbers without these diagnostics.
Authors: We concur that an explicit diagnostic analysis of DSL coverage would make the reliability claims more robust. RaivenDSL was designed as a unifying formal representation, and the benchmark tasks were selected to span common and complex cases across domains. In the revised manuscript, we will add a dedicated subsection that reports: primitive coverage statistics across the 100 tasks, any observed omission rates for edge cases, and details on conversational interactions where the LLM produced incomplete specifications requiring clarification or correction. This will provide the requested per-diagnostic evidence rather than relying solely on aggregate metrics. revision: yes
Circularity Check
No significant circularity; empirical claims rest on external benchmarks and user study
full rationale
The paper's core claims—100% compilation success, speed/cost improvements, and reduced debugging effort—are supported by a 100-task benchmark and expert user study rather than any self-referential definitions or fitted parameters. The RaivenDSL schema and deterministic compiler are architectural choices that enable verifiability by design, but the correctness and completeness assertions are tested externally against real tasks and not derived tautologically from the inputs. No load-bearing steps reduce to self-citation chains, ansatzes smuggled via prior work, or renaming of known results. The derivation chain is self-contained against the reported external evaluations.
Axiom & Free-Parameter Ledger
axioms (1)
- domain assumption RaivenDSL is a formally defined domain-specific language capable of representing visualizations across 2D, 3D, and tabular data in a unified way.
invented entities (2)
-
RaivenDSL
no independent evidence
-
Raiven system
no independent evidence
Reference graph
Works this paper leans on
-
[1]
K. Ai, K. Tang, and C. Wang. Nli4volvis: Natural language interaction for volume visualization via llm multi-agents and editable 3d gaussian splatting.IEEE Transactions on Visualization and Computer Graphics, 32(1):46–56, 2026. doi: 10.1109/TVCG.2025.3633888 2, 3
-
[2]
hiPSC single-cell image dataset [AICS- 10_8], 2018
Allen Institute for Cell Science. hiPSC single-cell image dataset [AICS- 10_8], 2018. 5
2018
-
[3]
J. Beyer, J. Troidl, S. Boorboor, M. Hadwiger, A. Kaufman, and H. Pfister. A survey of visualization and analysis in high-resolution connectomics. Computer Graphics Forum, 41(3):573–607, 2022. doi: 10.1111/cgf.14574 5
-
[4]
Bostock, V
M. Bostock, V . Ogievetsky, and J. Heer. D3 data-driven documents.IEEE Transactions on Visualization and Computer Graphics, 17(12):2301–2309,
-
[5]
doi: 10.1109/TVCG.2011.185 2
- [6]
-
[7]
C. Chiw, G. Kindlmann, J. Reppy, L. Samuels, and N. Seltzer. Diderot: a parallel dsl for image analysis and visualization. InProceedings of the 33rd ACM SIGPLAN Conference on Programming Language Design and Implementation, PLDI ’12, 10 pages, p. 111–120. Association for Computing Machinery, New York, NY , USA, 2012. doi: 10.1145/2254064 .2254079 2
-
[8]
H. Choi, W. Choi, T. M. Quan, D. G. C. Hildebrand, H. Pfister, and W.-K. Jeong. Vivaldi: A domain-specific language for volume processing and visualization on distributed heterogeneous systems.IEEE Transactions on Visualization and Computer Graphics, 20(12):2407–2416, 2014. doi: 10. 1109/TVCG.2014.2346322 2
-
[9]
V . Dibia. LIDA: A tool for automatic generation of grammar-agnostic visu- alizations and infographics using large language models. In D. Bollegala, R. Huang, and A. Ritter, eds.,Proceedings of the 61st Annual Meet- ing of the Association for Computational Linguistics (Volume 3: System Demonstrations), pp. 113–126. Association for Computational Linguistic...
-
[10]
O. Elek, J. N. Burchett, J. X. Prochaska, and A. G. Forbes. Polyphorm: Structural analysis of cosmological datasets via interactive physarum polycephalum visualization.IEEE Transactions on Visualization and Computer Graphics, 27(2):806–816, 2021. doi: 10.1109/TVCG.2020. 3030407 5
-
[11]
P. Harth, A. Bast, J. Troidl, B. Meulemeester, H. Pfister, J. Beyer, M. Ober- laender, H.-C. Hege, and D. Baum. Rapid Prototyping for Coordinated Views of Multi-scale Spatial and Abstract Data: A Grammar-based Approach. In C. Hansen, J. Procter, R. G. Raidou, D. Jönsson, and T. Höllt, eds.,Eurographics Workshop on Visual Computing for Biology and Medicine...
-
[12]
J. Heer and D. Moritz. Mosaic: An architecture for scalable & interop- erable data views.IEEE Transactions on Visualization and Computer Graphics, 30(1):436–446, 2024. doi: 10.1109/TVCG.2023.3327189 5
-
[13]
M. Hostnik, R. Kurbanov, Y . Sokolov, and A. Trofimov. Vegachat: A robust framework for llm-based chart generation and assessment. 2026. doi: 10.48550/arXiv.2601.15385 2, 7
-
[14]
J. Huang, Y . Xi, J. Hu, and J. Tao. Flownl: Asking the flow data in natural languages.IEEE Transactions on Visualization and Computer Graphics, 29(1):1200–1210, 2023. doi: 10.1109/TVCG.2022.3209453 2, 3
-
[15]
J. D. Hunter. Matplotlib: A 2d graphics environment.Computing in Science & Engineering, 9(3):90–95, 2007. doi: 10.1109/MCSE.2007.55 2
-
[16]
D. Jia, Y . Wang, and I. Viola. Chat modeling: Natural language-based procedural modeling of biological structures without training. 2024. doi: 10.48550/arXiv.2404.01063 2, 3
-
[17]
S. A. Joseph, S. M. Husain, S. S. R. Offner, S. Juneau, P. Torrey, A. S. Bolton, J. P. Farias, N. Gaffney, G. Durrett, and J. J. Li. Astrovisbench: A code benchmark for scientific computing and visualization in astronomy
-
[18]
doi: 10.48550/arXiv.2505.20538 1, 7
- [19]
-
[20]
F. Lan, M. Young, L. Anderson, A. Ynnerman, A. Bock, M. A. Borkin, A. G. Forbes, J. A. Kollmeier, and B. Wang. Visualization in astrophysics: Developing new methods, discovering our universe, and educating the earth.Computer Graphics Forum, 40(3):635–663, 2021. doi: 10.1111/cgf. 14332 5
work page doi:10.1111/cgf 2021
- [21]
-
[22]
H. Lin, D. Moritz, and J. Heer. Dziban: Balancing agency & automation in visualization design via anchored recommendations. InProceedings of the 2020 CHI conference on human factors in computing systems, pp. 1–12, 2020. 2
2020
-
[23]
S. Liu, H. Miao, and P.-T. Bremer. Paraview-mcp: An autonomous visualization agent with direct tool use. In2025 IEEE Visualization and Visual Analytics (VIS), pp. 61–65, 2025. doi: 10.1109/VIS60296.2025. 00018 2
- [24]
-
[25]
P. Maddigan and T. Susnjak. Chat2vis: Generating data visualizations via natural language using chatgpt, codex and gpt-3 large language mod- els.IEEE Access, 11:45181–45193, 2023. doi: 10.1109/ACCESS.2023. 3274199 2
-
[26]
J. Maitin-Shepard, A. Baden, W. Silversmith, E. Perlman, F. Collman, T. Blakely, J. Funke, C. Jordan, B. Falk, N. Kemnitz, tingzhao, C. Roat, M. Castro, S. Jagannathan, moenigin, J. Clements, A. Hoag, B. Katz, D. Parsons, J. Wu, L. Kamentsky, P. Chervakov, P. Hubbard, S. Berg, J. Hoffer, A. Halageri, C. Machacek, K. Mader, L. Roeder, and P. H. Li. google/...
-
[27]
T. Mallick, O. Yildiz, D. Lenz, and T. Peterka. Chatvis: Automating scien- tific visualization with a large language model. InSC24-W: Workshops of the International Conference for High Performance Computing, Net- working, Storage and Analysis, pp. 49–55, 2024. doi: 10.1109/SCW63240 .2024.00014 2
-
[28]
A. M. McNutt. No grammar to rule them all: A survey of json-style dsls for visualization.IEEE Transactions on Visualization and Computer Graphics, 29(1):160–170, 2023. doi: 10.1109/TVCG.2022.3209460 4
-
[29]
D. Moritz, C. Wang, G. L. Nelson, H. Lin, A. M. Smith, B. Howe, and J. Heer. Formalizing visualization design knowledge as constraints: Ac- tionable and extensible models in draco.IEEE Transactions on Visualiza- tion and Computer Graphics, 25(1):438–448, 2019. doi: 10.1109/TVCG. 2018.2865240 2
-
[30]
A. Narechania, A. Srinivasan, and J. Stasko. Nl4dv: A toolkit for gener- ating analytic specifications for data visualization from natural language queries.IEEE Transactions on Visualization and Computer Graphics, 27(2):369–379, 2021. doi: 10.1109/TVCG.2020.3030378 2
-
[31]
J. Pollock and A. Satyanarayan. Gofish: A grammar of more graphics! IEEE Transactions on Visualization and Computer Graphics, 32(1):549– 559, 2026. doi: 10.1109/TVCG.2025.3634250 2
-
[32]
Rautek, S
P. Rautek, S. Bruckner, M. E. Gröller, and M. Hadwiger. Vislang: A system for interpreted domain-specific languages for scientific visualization.IEEE Transactions on Visualization and Computer Graphics, 20(12):2388–2396,
-
[33]
doi: 10.1109/TVCG.2014.2346318 1, 2
-
[34]
M. Ribalta-Albado and P.-P. Vázquez. Evaluating llms’ abilities to create charts, a systematic approach.Computers & Graphics, 135:104544, 2026. doi: 10.1016/j.cag.2026.104544 1
-
[35]
L. A. Royer. Omega—harnessing the power of large language models for bioimage analysis.nature methods, 21(8):1371–1373, 2024. doi: 10. 1038/s41592-024-02310-w 2
2024
-
[36]
A. Satyanarayan, D. Moritz, K. Wongsuphasawat, and J. Heer. Vega-lite: A grammar of interactive graphics.IEEE Transactions on Visualization and Computer Graphics, 23(1):341–350, 2017. doi: 10.1109/TVCG.2016. 2599030 2
- [37]
-
[38]
Schroeder, K
W. Schroeder, K. Martin, and B. Lorensen.The Visualization Toolkit (4th ed.). Kitware, 2006. 2
2006
-
[39]
M. Shih, C. Rozhon, and K.-L. Ma. A declarative grammar of flexible volume visualization pipelines.IEEE Transactions on Visualization and Computer Graphics, 25(1):1050–1059, 2019. doi: 10.1109/TVCG.2018. 2864841 2
-
[40]
R. Sicat, J. Li, J. Choi, M. Cordeil, W.-K. Jeong, B. Bach, and H. Pfister. Dxr: A toolkit for building immersive data visualizations.IEEE Transac- tions on Visualization and Computer Graphics, 25(1):715–725, 2019. doi: 10.1109/TVCG.2018.2865152 2
-
[41]
Y . Tian, W. Cui, D. Deng, X. Yi, Y . Yang, H. Zhang, and Y . Wu. Chartgpt: Leveraging llms to generate charts from abstract natural language.IEEE Transactions on Visualization and Computer Graphics, 31(3):1731–1745,
-
[42]
doi: 10.1109/TVCG.2024.3368621 2
-
[43]
M. Tory and T. Moller. Rethinking visualization: A high-level taxonomy. InIEEE Symposium on Information Visualization, pp. 151–158, 2004. doi: 10.1109/INFVIS.2004.59 4
-
[44]
Summary of the content and survey properties
A. Vallenari, A. G. Brown, T. Prusti, J. H. De Bruijne, F. Arenou, C. Babu- siaux, M. Biermann, O. L. Creevey, C. Ducourant, D. W. Evans, et al. Gaia data release 3-summary of the content and survey properties.Astronomy & Astrophysics, 674:A1, 2023. doi: 10.1051/0004-6361/202243940 5
-
[45]
Wilkinson.The grammar of graphics
L. Wilkinson.The grammar of graphics. Statistics and computing. Springer, New York, 1999. 2
1999
-
[46]
Y . Wu, Y . Wan, H. Zhang, Y . Sui, W. Wei, W. Zhao, G. Xu, and H. Jin. Automated data visualization from natural language via large language models: An exploratory study.Proc. ACM Manag. Data, 2(3), article no. 115, 28 pages, May 2024. doi: 10.1145/3654992 1
-
[47]
Z. Wu, V . Le, A. Tiwari, S. Gulwani, A. Radhakrishna, I. Radi ˇcek, G. Soares, X. Wang, Z. Li, and T. Xie. Nl2viz: natural language to visualization via constrained syntax-guided synthesis. InProceedings of the 30th ACM Joint European Software Engineering Conference and Symposium on the Foundations of Software Engineering, ESEC/FSE 2022, 12 pages, p. 972...
-
[48]
B. Yu and C. T. Silva. Flowsense: A natural language interface for visual data exploration within a dataflow system.IEEE Transactions on Visualization and Computer Graphics, 26(1):1–11, 2020. doi: 10.1109/ TVCG.2019.2934668 2 A RAIVENDSL This section provides the complete RaivenDSL language reference: the formal grammar (Section A.1), the language structu...
-
[50]
Fill the schema: •source_name: short identifier •type: one of tbl, img, net, geo, func •path: exact file path or URL •args: optional arguments (used for func)
-
[51]
Insert any provided file path or URL into path, then decide Enough vs Not Enough
-
[52]
view_name
Provide two outputs: • Schema output (JSON) • Feedback (Markdown) –If complete: first lineEnough – If incomplete: first line Not Enough , followed by a specific request Ensure both outputs are always produced. B.2.3 View & Layer Node Prompt {user}, {data_ref}, and {data_ref_with_types} denote runtime-injected values from the current schema and user input....
-
[53]
If it saysinteractive scatterplotor interactive chart, treat that as a brushable scatterplot: one view only, no second view
Read the user’s description: user. If it saysinteractive scatterplotor interactive chart, treat that as a brushable scatterplot: one view only, no second view
-
[54]
If the user asked for one chart, fill view_name, layer_from, andgeo
If the user asked for multiple views/charts, fill views with one object per view. If the user asked for one chart, fill view_name, layer_from, andgeo
-
[55]
When there are multiple data sources: • if there is one img and one tbl and the user asked for both volume/slice and a chart type, infer layer_from and return Enough • only when there is real ambiguity (e.g., two tbl or two img sources) output Not Enough and ask which dataset each view/layer uses
-
[56]
choropleth
Provide two outputs: • Schema output(inside json ... ): set layer_from only when (a) there is one data source, or (b) the user explicitly said which dataset a view uses. If there are two or more sources of the same type and the user specified only one dataset, leave the others empty. • Feedback(inside markdown ... ): use exact dataset names (e.g., data_re...
-
[57]
Read the user’s description: {user}
-
[58]
volume",
Only if the user clearly specified a chart/visualization type (e.g. his- togram, scatter, heatmap, bar, line, pie, volume, slice), choose the matching mark type(s) from the list above. • Layered (one view, multiple layers):When the schema has one view with multiple layers fromlayered(e.g. two vol- ume layers + one streamline layer), return one mark per la...
-
[59]
encode":
Providetwo outputs: •Schema output(insidejson ...) •Feedback(insidemarkdown ...) –First lineEnoughwhen valid marks are provided – Otherwise Not Enough with a request to specify the visualization type Make sure to always output both parts. B.2.5 Encode Node Prompt {user_intent_block}, {data_info}, and {refinement_context_block} denote runtime-injected valu...
-
[60]
If single view and mark type is one of no_encode_marks, output empty encode and first lineEnough
-
[61]
Only request or fill encode for views that need variable mapping (points, bar, line, etc.)
If multiple views: for each view with mark in no_encode_marks, use for that view’s encode. Only request or fill encode for views that need variable mapping (points, bar, line, etc.)
-
[62]
If allowed variable names is empty and at least one view needs encode, output empty encodes for those views and first line Not Enough; ask the user to specify which columns/variables to use (only for the view(s) that need encode, not for volume/slice/isosurface views)
-
[63]
If the user did not specify which variable goes on which channel for a view that needs encode, do not guess and do not pick from the allowed list — output empty encode for that view and say Not Enough, asking the user to choose which variables to use (only for that view)
-
[64]
Underspecification:If a view needs multiple variables (e.g. scatter- plot/points needs x and y) but the user only specified one variable for that view, output empty encode for that view and sayNot Enough , naming which view is underspecified, what is required (e.g. x, y), and what is optional for this mark if any (e.g. color). Example:Scat- terplot view: ...
-
[65]
Include optional channels (e.g
Use only the required and optional channels listed in Context for this mark. Include optional channels (e.g. color, size, opacity for scatterplot) only if the user explicitly assigned them
-
[66]
, ".join(view_ids) or
Providetwo outputs: Schema (inside json ... ) and Feedback (inside markdown ... ). First line of feedback: Enough when every view that needs encode has all required channels filled with names from the allowed list (and volume/slice/isosurface views have empty encode); otherwiseNot Enough. Make sure to always output both parts. B.2.6 Selections & Linking N...
-
[67]
Read the user’s description: user
-
[68]
interval
If they want linked views with brush/selection: fill selections (name, type "interval", bind_view, bind_channels for that view only) and linking (shared_data_source, linked_view_ids, selection_name). Linked views may use different encode channels (e.g. scatter a vs b and scatter c vs d from the same table) — same data source is sufficient. Use exact view_...
-
[69]
selections
If they did not ask for linking: return { "selections": [], "linking": {} }and first lineEnough
-
[70]
I want a histogram of b
Providetwo outputs: •Schema output(insidejson ...) • Feedback(inside markdown ... ). First line Enough in both cases. Make sure to always output both parts. B.3 Agent Clarification Messages When Raiven cannot proceed with a workflow step due to missing or ambiguous information, it pauses and returns a clarification message to the user rather than making a...
1960
-
[71]
Apromptthat was given to an LLM-based visualization system
-
[72]
TheHTML source codeof the output that system produced
-
[73]
bar chart
Arendered viewof that HTML, which you can interact with (click, hover, brush, select). 4.N, the number of views the prompt requested. Your job is to evaluate the output by scoring each component de- scribed below. Core Principles • Everything is grounded in the prompt.Score based on what the prompt asked for, not what you think a good visual- ization shou...
2023
discussion (0)
Sign in with ORCID, Apple, or X to comment. Anyone can read and Pith papers without signing in.