Recognition: unknown
Vertical Structure of Local Disk Galaxies revealed by DESI Imaging Data
Pith reviewed 2026-05-10 16:13 UTC · model grok-4.3
The pith
Local disk galaxies are thin with negligible flaring and match the Milky Way thin disk.
A machine-rendered reading of the paper's core claim, the machinery that carries it, and where it could break.
Core claim
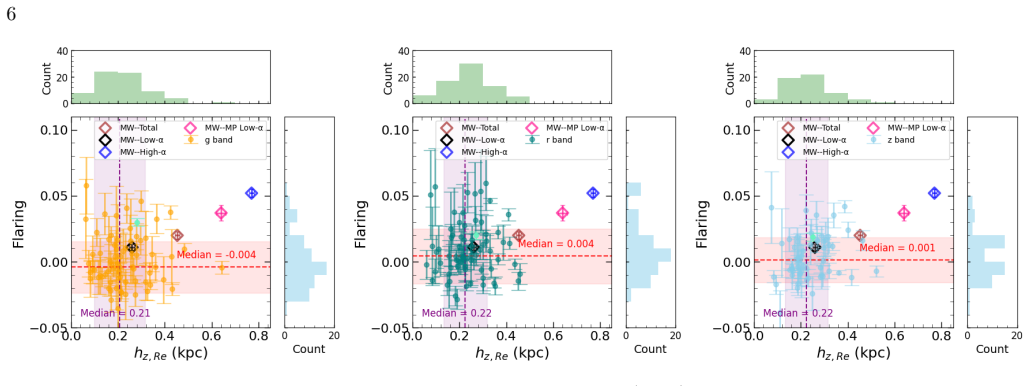
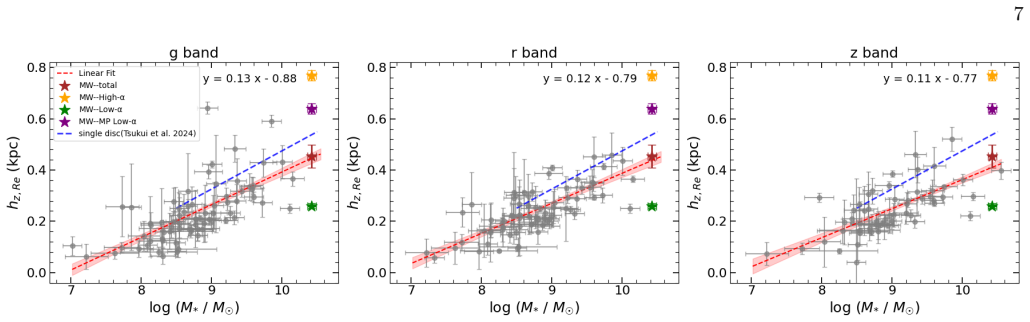
Local galactic disks are generally thin with negligible flaring. The median scale heights at one effective radius are 0.21, 0.22, and 0.22 kpc in the g, r, and z bands, respectively, while the corresponding median radial gradients are -0.006, 0.003, and 0.001. These values are consistent with those of the geometric thin disk of the Milky Way, represented by metal-rich, low-[alpha/Fe] populations, supporting the conclusion of weak flaring. We also find a clear positive correlation between scale height and stellar mass, extending down to 10^7 solar masses.
What carries the argument
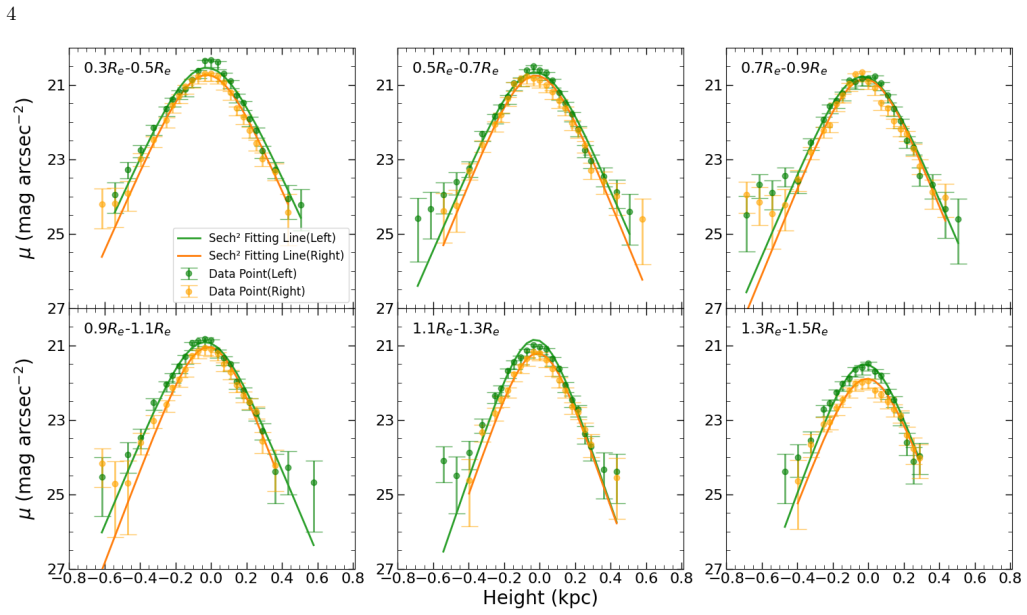
Single-component sech^2 model fits applied to radius-dependent vertical luminosity profiles to measure scale height and its radial gradient.
If this is right
- The Milky Way thin disk is representative of typical local disk galaxies in vertical structure.
- Scale height at one effective radius increases with stellar mass across the range from 10^7 solar masses upward.
- Nearby disks exhibit little to no flaring, with median radial gradients consistent with zero in optical and near-infrared bands.
- The measured median scale heights near 0.22 kpc provide a homogeneous benchmark for comparing disk galaxies at low redshift.
Where Pith is reading between the lines
- Models of disk assembly that avoid strong heating from mergers or satellites would be favored if the lack of flaring holds in larger samples.
- Deeper multi-band imaging could test whether a faint thick-disk component exists but remains undetected in the single sech^2 fits used here.
- The mass-scale height correlation may link to the depth of the galactic potential well, offering a testable prediction for simulations of low-mass disks.
Load-bearing premise
The single-component sech^2 model sufficiently describes the vertical luminosity profiles without significant contributions from thick disk components or other structures that would require multi-component fits.
What would settle it
A large sample of local disk galaxies observed independently and showing either clear multi-component vertical profiles or strongly positive radial gradients in scale height would contradict the central claim.
Figures


read the original abstract
The vertical structure of galactic disks is an important probe of disk assembly history. We investigate a sample of 79 local disk galaxies within 50 Mpc using data from the DESI Legacy Imaging Surveys. Vertical luminosity profiles as a function of radius in the g, r, and z bands are extracted and fitted with a single-component sech^2 model to determine the scale height and its radial variation (flaring). Our results show that local galactic disks are generally thin with negligible flaring. The median scale heights at one effective radius are 0.21, 0.22, and 0.22 kpc in the g, r, and z bands, respectively, while the corresponding median radial gradients are -0.006, 0.003, and 0.001. These values are consistent with those of the geometric thin disk of the Milky Way, represented by metal-rich, low-[alpha/Fe] populations, supporting the conclusion of weak flaring. We also find a clear positive correlation between scale height and stellar mass, extending down to 10^7 solar masses. These results provide a homogeneous benchmark for the vertical structure of nearby disk galaxies and support the cosmological representativeness of the Milky Way thin disk.
Editorial analysis
A structured set of objections, weighed in public.
Referee Report
Summary. The paper analyzes vertical luminosity profiles of 79 local disk galaxies within 50 Mpc from DESI Legacy Imaging Surveys data. Profiles in g, r, and z bands are extracted as a function of radius and fitted with a single-component sech² model to measure vertical scale heights h_z(R) and radial flaring gradients. The authors report that local disks are generally thin with negligible flaring (median h_z ≈ 0.21–0.22 kpc at 1 R_e and median gradients near zero), consistent with the Milky Way geometric thin disk, and find a positive correlation between scale height and stellar mass extending to 10^7 M_⊙.
Significance. If the single-component fits prove robust, the work supplies a homogeneous observational benchmark for the vertical structure of nearby disk galaxies, extending mass coverage to low-mass systems and reinforcing the cosmological representativeness of the Milky Way thin disk. Such a sample is useful for calibrating simulations of disk assembly and for testing predictions of flaring and thickness trends.
major comments (3)
- [Abstract and §3 (Methods/Analysis)] The central claims of thin disks and negligible flaring rest on the single sech² model returning unbiased h_z(R). The manuscript provides no quantitative fit diagnostics (reduced-χ² distributions, residual maps, or explicit two-component model comparisons) to demonstrate that thick-disk contributions are negligible across the sample. This assumption is load-bearing for the reported medians and gradients.
- [Abstract and §4 (Results)] Median scale heights and radial gradients are stated without uncertainties, sample-variance estimates, or systematic-error budgets. The abstract quotes precise values (0.21, 0.22, 0.22 kpc and gradients -0.006, 0.003, 0.001) but the absence of these statistics prevents assessment of whether the data robustly support the “negligible flaring” and mass-correlation conclusions.
- [§4 (Results) and §5 (Discussion)] The claimed positive scale-height–stellar-mass correlation down to 10^7 M_⊙ requires explicit statistical support (e.g., Spearman rank coefficient, scatter, and checks for selection biases or Malmquist effects in the 79-galaxy sample). Without these, the extension to low masses remains unquantified.
minor comments (2)
- [Figures 3–6] Figures showing individual profiles or stacked residuals should include uncertainty bands and clearly label the radial range used for the gradient fits.
- [§2 (Data and Sample)] Add a short table summarizing the sample selection criteria, redshift range, and morphological cuts to allow reproducibility.
Simulated Author's Rebuttal
We thank the referee for the detailed and constructive comments. We address each major point below and will revise the manuscript to incorporate the suggested improvements, strengthening the statistical rigor and transparency of our analysis.
read point-by-point responses
-
Referee: [Abstract and §3 (Methods/Analysis)] The central claims of thin disks and negligible flaring rest on the single sech² model returning unbiased h_z(R). The manuscript provides no quantitative fit diagnostics (reduced-χ² distributions, residual maps, or explicit two-component model comparisons) to demonstrate that thick-disk contributions are negligible across the sample. This assumption is load-bearing for the reported medians and gradients.
Authors: We agree that explicit fit diagnostics are needed to support the single sech² model. In the revised manuscript we will add the distribution of reduced-χ² values for all fits, representative residual maps, and direct single- versus two-component model comparisons for a representative subsample. These additions will quantify the adequacy of the single-component description and confirm that thick-disk contributions remain negligible in the luminosity profiles used to derive h_z(R). revision: yes
-
Referee: [Abstract and §4 (Results)] Median scale heights and radial gradients are stated without uncertainties, sample-variance estimates, or systematic-error budgets. The abstract quotes precise values (0.21, 0.22, 0.22 kpc and gradients -0.006, 0.003, 0.001) but the absence of these statistics prevents assessment of whether the data robustly support the “negligible flaring” and mass-correlation conclusions.
Authors: We acknowledge that the reported medians lack associated uncertainties. We will revise §4 to include bootstrap-derived uncertainties on the median scale heights and gradients, an estimate of sample variance from the 79-galaxy sample, and a discussion of systematic uncertainties arising from the fitting procedure, photometric calibration, and distance errors. This error budget will allow a quantitative assessment of the negligible-flaring result. revision: yes
-
Referee: [§4 (Results) and §5 (Discussion)] The claimed positive scale-height–stellar-mass correlation down to 10^7 M_⊙ requires explicit statistical support (e.g., Spearman rank coefficient, scatter, and checks for selection biases or Malmquist effects in the 79-galaxy sample). Without these, the extension to low masses remains unquantified.
Authors: We will add the requested statistical measures in the revised §4 and §5. Specifically, we will report the Spearman rank correlation coefficient and its significance, the rms scatter around the relation, and explicit checks for selection biases and Malmquist effects at the low-mass end. These quantifications will place the claimed positive correlation on a firmer statistical footing. revision: yes
Circularity Check
No circularity: direct empirical fits to imaging data yield scale heights without self-referential reductions
full rationale
The paper extracts vertical luminosity profiles from DESI Legacy Imaging Surveys data for 79 galaxies and fits them to a standard single-component sech^2 model to obtain scale heights h_z(R) and radial gradients. These quantities are computed directly from the observed profiles via standard least-squares fitting; no step renames a fitted parameter as a prediction, defines one quantity in terms of another by construction, or relies on load-bearing self-citations whose validity reduces to the present work. The reported medians, MW consistency, and mass correlation are straightforward summaries of the fit results. The choice of a single sech^2 functional form is an explicit modeling assumption whose adequacy can be tested against the data or external benchmarks and does not create a circular derivation chain.
Axiom & Free-Parameter Ledger
free parameters (2)
- vertical scale height =
median 0.22 kpc
- radial flaring gradient =
median near zero
axioms (2)
- domain assumption A single sech^2 function adequately represents the vertical luminosity distribution in disk galaxies
- standard math Distances to galaxies within 50 Mpc are known with sufficient accuracy to convert observed angular sizes to physical scale heights in kpc
Reference graph
Works this paper leans on
-
[1]
Adibekyan, V. Z., Santos, N. C., Sousa, S. G., & Israelian, G. 2011, A&A, 535, L11, doi: 10.1051/0004-6361/201118240
-
[2]
Bournaud, F., Elmegreen, B. G., & Martig, M. 2009, The Astrophysical Journal, 707, L1, doi: 10.1088/0004-637X/707/1/L1
-
[3]
Finkbeiner, D. P. 2016, The Astrophysical Journal, 818, 130, doi: 10.3847/0004-637X/818/2/130
-
[4]
2012, ApJ, 753, 148, doi: 10.1088/0004-637X/753/2/148
Bovy, J., Rix, H.-W., Liu, C., et al. 2012, The Astrophysical Journal, 753, 148, doi: 10.1088/0004-637X/753/2/148
-
[5]
Brook, C. B., Kawata, D., Gibson, B. K., & Freeman, K. C. 2004, The Astrophysical Journal, 612, 894, doi: 10.1086/422709 Comerón, S., Salo, H., & Knapen, J. H. 2018, A&A, 610, A5, doi: 10.1051/0004-6361/201731415
-
[6]
Dey, A., Schlegel, D. J., Lang, D., et al. 2019, AJ, 157, 168, doi: 10.3847/1538-3881/ab089d
-
[7]
Elmegreen, B. G., & Elmegreen, D. M. 2006, ApJ, 650, 644, doi: 10.1086/507578
-
[8]
Erwin, P. 2015, The Astrophysical Journal, 799, 226, doi: 10.1088/0004-637X/799/2/226
-
[9]
1998, A&A, 338, 161
Fuhrmann, K. 1998, A&A, 338, 161
1998
-
[10]
Galactic structure towards the South Pole and the Galactic thick disc
Gilmore, G., & Reid, N. 1983, MNRAS, 202, 1025, doi: 10.1093/mnras/202.4.1025
-
[11]
Snyder, G. F., & Heckman, T. M. 2023, The Physical Thickness of Stellar Disks to z 2, https://arxiv.org/abs/2303.04171 9
-
[12]
Clues of a two-phase formation history of the Milky Way disk
Haywood, M., Di Matteo, P., Lehnert, M. D., Katz, D., & Gómez, A. 2013, A&A, 560, A109, doi: 10.1051/0004-6361/201321397
-
[13]
Imig, J., Price, C., Holtzman, J. A., et al. 2023, The Astrophysical Journal, 954, 124, doi: 10.3847/1538-4357/ace9b8
-
[14]
2025a, ApJL, 984, L48, doi: 10.3847/2041-8213/adccb7
Lian, J., Du, M., Lu, S., et al. 2025a, ApJL, 984, L48, doi: 10.3847/2041-8213/adccb7
-
[15]
2025, ApJ, 990, L37, doi:10.3847/2041-8213/adfc73
Lian, J., Wang, T., Feng, Q., Huang, Y., & Guo, H. 2025b, ApJL, 990, L37, doi: 10.3847/2041-8213/adfc73
-
[16]
2024, Nature Astronomy, 8, 1302, doi: 10.1038/s41550-024-02315-7
Lian, J., Zasowski, G., Chen, B., et al. 2024, Nature Astronomy, 8, 1302, doi: 10.1038/s41550-024-02315-7
-
[17]
Lian, J., Zasowski, G., Mackereth, T., et al. 2022, Monthly Notices of the Royal Astronomical Society, 513, 4130, doi: 10.1093/mnras/stac1151 López-Corredoira, M., Cabrera-Lavers, A., Garzón, F., &
-
[18]
Hammersley, P. L. 2002, A&A, 394, 883, doi: 10.1051/0004-6361:20021175
-
[19]
2015, ApJL, 804, L9, doi: 10.1088/2041-8205/804/1/L9
Minchev, I., Martig, M., Streich, D., et al. 2015, The Astrophysical Journal Letters, 804, L9, doi: 10.1088/2041-8205/804/1/L9
-
[20]
2006, A&A, 451, 515, doi: 10.1051/0004-6361:20054081
Momany, Y., Zaggia, S., Gilmore, G., et al. 2006, A&A, 451, 515, doi: 10.1051/0004-6361:20054081
-
[21]
Greene, J. E. 2024, AJ, 167, 31, doi: 10.3847/1538-3881/acf7bc
-
[22]
J., Hernquist, L., & Fullagar, D
Quinn, P. J., Hernquist, L., & Fullagar, D. P. 1993, ApJ, 403, 74, doi: 10.1086/172184
-
[23]
Ranaivoharimina, N., Randriamampandry, T., Wang, J., Menéndez-Delmestre, K., & Gonçalves, T. S. 2024, The Astrophysical Journal, 977, 66, doi: 10.3847/1538-4357/ad85d5
-
[24]
Ram Pressure Stripping of Disc Galaxies: The Role of the Inclination Angle , shorttitle =
Reddy, B. E., Lambert, D. L., & Allende Prieto, C. 2006, MNRAS, 367, 1329, doi: 10.1111/j.1365-2966.2006.10148.x
-
[25]
Kotov, S. S., & Savchenko, S. S. 2016, MNRAS, 461, 4233, doi: 10.1093/mnras/stw1623
-
[26]
F., Capozziello, S., & Dainotti, M
Saha, K., de Jong, R., & Holwerda, B. 2009, MNRAS, 396, 409, doi: 10.1111/j.1365-2966.2009.14696.x
-
[27]
2023, MNRAS, 523, 3915, doi: 10.1093/mnras/stad1485 Ted Mackereth, J., Bovy, J., Schiavon, R
Sotillo-Ramos, D., Donnari, M., Pillepich, A., et al. 2023, MNRAS, 523, 3915, doi: 10.1093/mnras/stad1485 Ted Mackereth, J., Bovy, J., Schiavon, R. P., et al. 2017, Monthly Notices of the Royal Astronomical Society, 471, 3057, doi: 10.1093/mnras/stx1774
-
[28]
Trujillo, I., Chamba, N., & Knapen, J. H. 2020, MNRAS, 493, 87, doi: 10.1093/mnras/staa236
-
[29]
Tsukui, T., Wisnioski, E., Bland-Hawthorn, J., & Freeman, K. 2025, The emergence of galactic thin and thick discs across cosmic history, https://arxiv.org/abs/2409.15909 van der Kruit, P. C., & Searle, L. 1981, A&A, 95, 105 Villalobos, Á., & Helmi, A. 2008, MNRAS, 391, 1806, doi: 10.1111/j.1365-2966.2008.13979.x
-
[30]
Villumsen, J. V. 1985, ApJ, 290, 75, doi: 10.1086/162960
-
[31]
2018, The Astrophysical Journal Supplement Series, 237, 33, doi: 10.3847/1538-4365/aad237
Xiang, M., Shi, J., Liu, X., et al. 2018, The Astrophysical Journal Supplement Series, 237, 33, doi: 10.3847/1538-4365/aad237
-
[32]
Yi, S. K., Jang, J. K., Devriendt, J., et al. 2024, ApJS, 271, 1, doi: 10.3847/1538-4365/ad0e71
-
[33]
Yoachim, P., & Dalcanton, J. J. 2006, AJ, 131, 226, doi: 10.1086/497970
-
[34]
2021, The Astrophysical Journal, 912, 106, doi: 10.3847/1538-4357/abf098
Yu, Z., Li, J., Chen, B., et al. 2021, The Astrophysical Journal, 912, 106, doi: 10.3847/1538-4357/abf098
-
[35]
2025, ApJ, 989, 213, doi: 10.3847/1538-4357/adee1b
Zhou, X., Chen, X., Deng, L., et al. 2025, ApJ, 989, 213, doi: 10.3847/1538-4357/adee1b
discussion (0)
Sign in with ORCID, Apple, or X to comment. Anyone can read and Pith papers without signing in.