Recognition: unknown
Improving Solar Flare Soft X-ray Classification With FOXES: A Framework For Operational X-ray Emission Synthesis
Pith reviewed 2026-05-10 15:09 UTC · model grok-4.3
The pith
FOXES translates EUV images into spatially resolved soft X-ray flux predictions to fix GOES classification limits.
A machine-rendered reading of the paper's core claim, the machinery that carries it, and where it could break.
Core claim
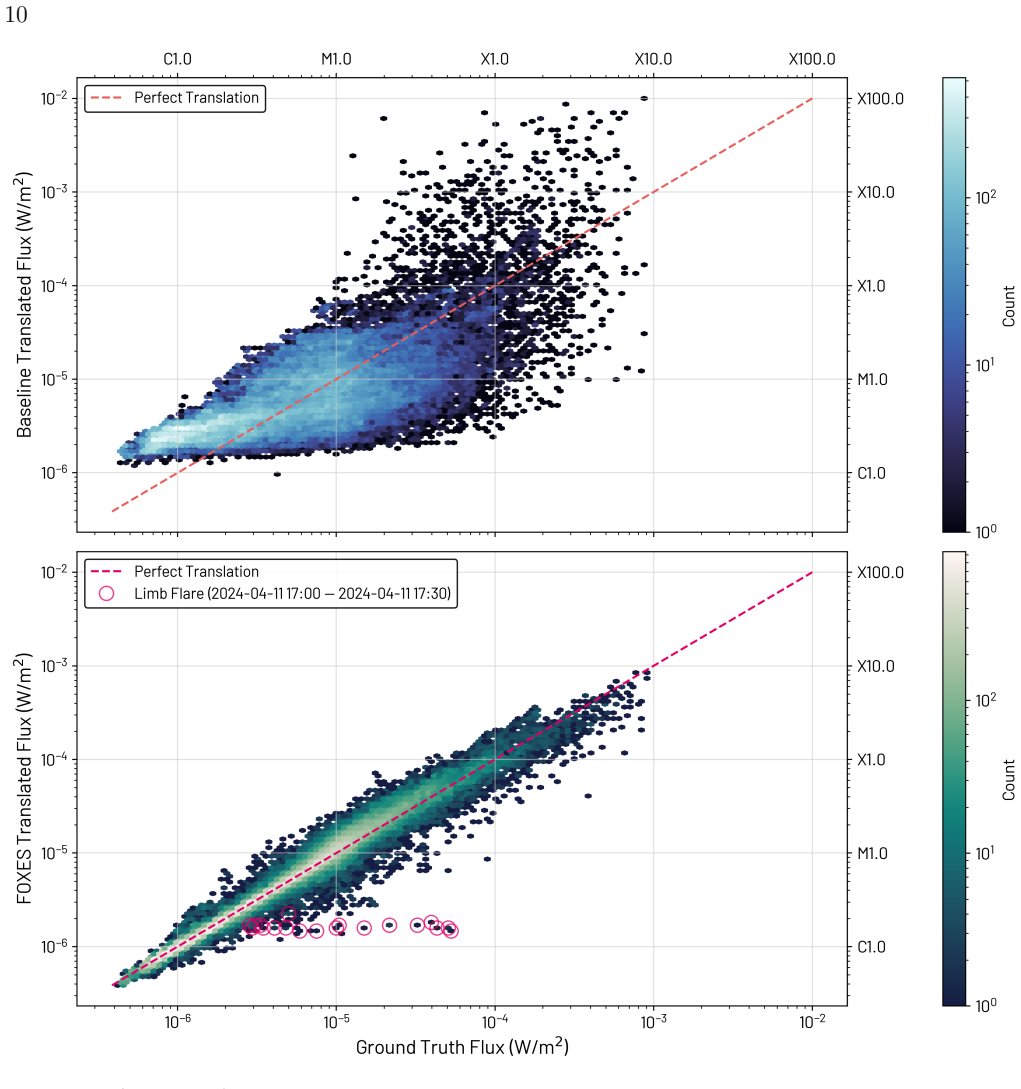
FOXES is a Vision Transformer framework that converts spatially resolved EUV observations into global 1-8 Å SXR irradiance predictions together with per-patch flux maps. After training, validation, and testing on over 3200 hours of observations, it reports a translational mean absolute error of 0.051 dex for the integrated flux and demonstrates the ability to isolate solar background SXR contributions in both flaring and non-flaring intervals, thereby enabling EUV-based flare detection from locations other than Earth's line of sight.
What carries the argument
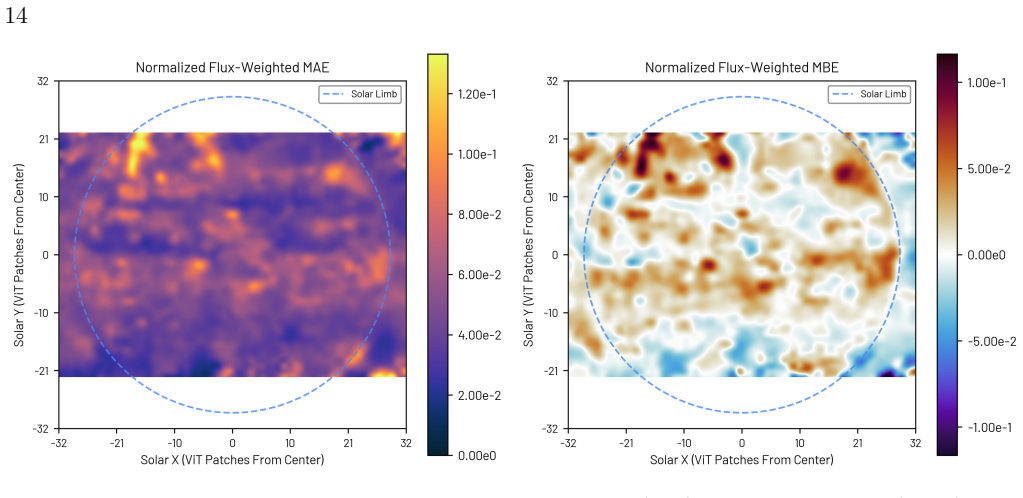
Vision Transformer that produces both a single global 1-8 Å SXR flux value and a set of per-patch flux contributions from input EUV images.
If this is right
- Flare classification can assign correct strengths even when multiple events occur at the same time.
- Flare catalogs can be built from any EUV-capable viewpoint instead of only Earth orbit.
- Space-weather forecasts that use flare class and light curves can be driven by data from multiple spacecraft positions.
- Real-time background subtraction becomes possible for both flaring and quiet-Sun intervals.
Where Pith is reading between the lines
- The per-patch maps could be compared against simultaneous magnetograms or hard X-ray images to test whether the model attributes emission to the correct magnetic structures.
- Retraining the same architecture on data from solar cycle minima versus maxima would reveal whether the learned mapping changes with overall activity level.
- The framework could be extended to predict additional wavelength bands, supplying consistent multi-wavelength inputs for energetic-particle and CME models.
- Deployment on operational EUV imagers would allow continuous multiviewpoint SXR synthesis without requiring new hardware.
Load-bearing premise
The statistical mapping from EUV images to SXR flux learned on Earth-orbit data will remain accurate for new flares, different activity levels, and observations taken from other points in the heliosphere.
What would settle it
Direct comparison of FOXES-predicted total SXR flux against simultaneous measurements from a spacecraft at a non-Earth heliospheric longitude during a well-observed flare that shows an error substantially larger than 0.051 dex.
Figures


read the original abstract
The Geostationary Operational Environmental Satellite (GOES) solar soft X-ray (SXR) irradiance in the 1-8{\AA} wavelength range is a long-standing measure of solar activity, used to define the classification of flare strengths. As a result, the flare class, along with the SXR light curves, are routinely used as a primary input for forecasting properties of space weather drivers, from coronal mass ejection speed to energetic particle output. However, the GOES SXR irradiance lacks spatial information, leading to known classification errors, such as misattributed flare locations during periods of high activity. Moreover, GOES only provides observations from Earth's orbit, hindering forecasting for other places in the heliosphere. Motivated by these limitations, we introduce the Framework for Operational X-ray Emission Synthesis (FOXES), a Vision Transformer-based approach for translating Extreme Ultraviolet (EUV) spatially-resolved observations into SXR irradiance predictions. The model produces two outputs: (1) a global 1-8{\AA} SXR flux prediction and (2) per-patch flux contributions, which offer a spatially-resolved interpretation of where the model attributes SXR emission. Trained, validated, and tested on over 3200 hours of observations, FOXES has demonstrated a translational mean absolute error of 0.051 dex for integrated SXR measurements. FOXES has also shown promise in dissecting the solar background SXR flux during flaring and non-flaring events. Overall, this model paves the way for EUV-based spatially-resolved flare detection to be extended beyond Earth's line of sight. Such capabilities could lead to a more comprehensive flare catalog and enable a true multiviewpoint monitoring of solar activity.
Editorial analysis
A structured set of objections, weighed in public.
Referee Report
Summary. The paper introduces FOXES, a Vision Transformer framework that maps spatially resolved EUV observations to soft X-ray (SXR) irradiance predictions in the 1-8 Å band. It generates both a global integrated SXR flux and per-patch attribution maps for interpretability. Trained, validated, and tested on over 3200 hours of joint EUV/SXR data, the model reports a translational MAE of 0.051 dex on held-out integrated measurements and explores separation of background SXR flux in flaring versus non-flaring intervals. The work aims to mitigate GOES classification errors from lack of spatial information and to enable SXR-based monitoring from non-Earth heliospheric viewpoints.
Significance. If the learned EUV-to-SXR mapping generalizes, FOXES could supply spatially resolved SXR estimates that improve flare location attribution during high-activity periods and support space-weather inputs from arbitrary solar-system locations. The per-patch output provides useful physical interpretability. The current significance is limited because all quantitative results remain within the Earth-orbit training distribution, leaving the multiviewpoint extension prospective rather than demonstrated.
major comments (2)
- [Abstract] Abstract: the claim that FOXES 'paves the way for EUV-based spatially-resolved flare detection to be extended beyond Earth's line of sight' and enables 'true multiviewpoint monitoring' is unsupported. No quantitative results are reported on STEREO, Solar Orbiter, or any off-Earth viewpoint data; all MAE and attribution results are obtained on held-out samples drawn from the identical Earth-orbit EUV/SXR joint distribution used for training.
- [Results/Evaluation] Results/Evaluation section: the headline performance figure of 0.051 dex MAE is presented without error bars, explicit train/validation/test split descriptions, baseline comparisons (e.g., against direct EUV integration or prior irradiance-mapping methods), or stratification by solar-cycle phase and flare frequency. These omissions make it impossible to judge whether the reported accuracy constitutes a genuine improvement or is robust outside the training distribution.
minor comments (1)
- [Abstract] Abstract: the phrase 'translational mean absolute error' is introduced without a definition or reference to how it is computed from the model's outputs.
Simulated Author's Rebuttal
We thank the referee for their constructive and detailed review. We address each major comment below and have revised the manuscript accordingly to improve clarity and rigor.
read point-by-point responses
-
Referee: [Abstract] Abstract: the claim that FOXES 'paves the way for EUV-based spatially-resolved flare detection to be extended beyond Earth's line of sight' and enables 'true multiviewpoint monitoring' is unsupported. No quantitative results are reported on STEREO, Solar Orbiter, or any off-Earth viewpoint data; all MAE and attribution results are obtained on held-out samples drawn from the identical Earth-orbit EUV/SXR joint distribution used for training.
Authors: We agree that the original abstract language presents the multiviewpoint capability as more immediate than the current results support. The FOXES architecture is viewpoint-agnostic by design, as it ingests spatially resolved EUV images and produces integrated SXR flux plus per-patch attributions without embedding Earth-specific assumptions; EUV data from STEREO and Solar Orbiter already exist and could be used for future testing. Nevertheless, because all reported metrics derive from the Earth-orbit joint distribution, the extension remains prospective. In the revised version we will replace the abstract sentence with: 'FOXES provides a general framework for EUV-to-SXR mapping that can be applied to non-Earth viewpoints once co-observed datasets become available.' We will also add a dedicated paragraph in the Discussion section outlining the data requirements and any necessary domain-adaptation steps for such extensions. revision: yes
-
Referee: [Results/Evaluation] Results/Evaluation section: the headline performance figure of 0.051 dex MAE is presented without error bars, explicit train/validation/test split descriptions, baseline comparisons (e.g., against direct EUV integration or prior irradiance-mapping methods), or stratification by solar-cycle phase and flare frequency. These omissions make it impossible to judge whether the reported accuracy constitutes a genuine improvement or is robust outside the training distribution.
Authors: We accept that the evaluation section would benefit from greater transparency. Although the manuscript states the total data volume (>3200 hours) and the use of held-out test samples, we will expand it to include: (i) error bars on the 0.051 dex MAE obtained via bootstrap resampling across the test set; (ii) a clear description of the temporal train/validation/test partitioning, including the fraction of data from each solar-cycle phase and confirmation that no temporal overlap exists between splits; (iii) quantitative baseline comparisons, specifically a linear combination of EUV channel intensities calibrated to SXR and any previously published EUV-to-SXR mapping approaches; and (iv) performance tables stratified by solar-cycle phase (rising, maximum, declining) and by flare activity level (quiet Sun vs. periods containing C-class or larger flares). These additions will allow readers to assess both improvement over baselines and robustness across conditions. revision: yes
Circularity Check
No circularity: performance metric on held-out data is independent of inputs
full rationale
The paper trains a Vision Transformer on paired EUV/SXR observations and reports a translational MAE of 0.051 dex on held-out test data drawn from the same Earth-orbit distribution. This is a standard empirical evaluation, not a quantity obtained by fitting a parameter to a subset and then renaming the fit as a prediction, nor by any self-referential equation or self-citation chain. No mathematical derivation exists that reduces to its own inputs by construction. The untested generalization to other viewpoints is an assumption about future applicability, not a circularity in the reported results.
Axiom & Free-Parameter Ledger
free parameters (1)
- Vision Transformer weights
axioms (1)
- domain assumption EUV observations contain sufficient information to predict SXR irradiance
Reference graph
Works this paper leans on
-
[1]
Ahmadzadeh, A., Aydin, B., Georgoulis, M. K., et al. 2021, The Astrophysical Journal Supplement Series, 254, 23, doi: 10.3847/1538-4365/abec88
-
[2]
Angryk, R. A., Martens, P. C., Aydin, B., et al. 2020, Scientific Data, 7, 227, doi: 10.1038/s41597-020-0548-x Asensio Ramos, A., Cheung, M. C. M., Chifu, I., & Gafeira, R. 2023, Living Reviews in Solar Physics, 20, 4, doi: 10.1007/s41116-023-00038-x
-
[3]
Barnes, G., Leka, K. D., Schrijver, C. J., et al. 2016, The Astrophysical Journal, 829, 89, doi: 10.3847/0004-637X/829/2/89
-
[4]
2025, The Astrophysical Journal Supplement Series, 278, 9, doi: 10.3847/1538-4365/adc731
Berretti, M., Mestici, S., Giovannelli, L., et al. 2025, The Astrophysical Journal Supplement Series, 278, 9, doi: 10.3847/1538-4365/adc731
-
[5]
Bobra, M. G., Sun, X., Hoeksema, J. T., et al. 2014, Solar Physics, 289, 3549, doi: 10.1007/s11207-014-0529-3
-
[6]
Space Weather 17(8), 1166–1207 (2019) https://doi.org/10.1029/2018SW002061
Camporeale, E. 2019, Space Weather, 17, 1166, doi: 10.1029/2018SW002061
-
[7]
Caspi, A., Krucker, S., & Lin, R. P. 2014, The Astrophysical Journal, 781, 43, doi: 10.1088/0004-637X/781/1/43
-
[8]
C., Woods, T
Chamberlin, P. C., Woods, T. N., Eparvier, F. G., & Jones, A. R. 2009, in Solar physics and space weather instrumentation III, Vol. 7438, SPIE, 11–20
2009
-
[9]
Chertok, I. M., Belov, A. V., & Grechnev, V. V. 2015, Solar Physics, 290, 1947, doi: 10.1007/s11207-015-0738-4 Dos Santos, L. F. G., Bose, S., Salvatelli, V., et al. 2021, Astronomy & Astrophysics, 648, A53, doi: 10.1051/0004-6361/202040051
-
[10]
An Image is Worth 16x16 Words: Transformers for Image Recognition at Scale
Dosovitskiy, A., Beyer, L., Kolesnikov, A., et al. 2020, arXiv preprint arXiv:2010.11929
work page internal anchor Pith review Pith/arXiv arXiv 2020
-
[11]
Georgoulis, M. K., Bloomfield, D. S., Piana, M., et al. 2021, Journal of Space Weather and Space Climate, 11, 39, doi: 10.1051/swsc/2021023
-
[12]
T., March, A., Biradar, J., et al
Goodwin, G. T., March, A., Biradar, J., et al. 2026a, FOXES-Data (Revision 6b434f8), Hugging Face, doi: 10.57967/hf/7737
-
[13]
T., March, A., Biradar, J., et al
Goodwin, G. T., March, A., Biradar, J., et al. 2026b, FOXES (Revision 0affdc2), Hugging Face, doi: 10.57967/hf/8234
-
[14]
Goodwin, G. T., Sadykov, V. M., & Martens, P. C. 2024, The Astrophysical Journal, 964, 163, doi: 10.3847/1538-4357/ad276c
-
[15]
2018, The Astrophysical Journal, 856, 7, doi: 10.3847/1538-4357/aaae00
Huang, X., Wang, H., Xu, L., et al. 2018, The Astrophysical Journal, 856, 7, doi: 10.3847/1538-4357/aaae00
-
[16]
2025, Nature Communications, 16, 3157
Podladchikova, T. 2025, Nature Communications, 16, 3157
2025
-
[17]
Kameswari, C., J, K., Reddy, T., et al. 2023, International Journal of Advanced Computer Science and Applications, 14, doi: 10.14569/IJACSA.2023.0140830
-
[18]
Khan, S., Naseer, M., Hayat, M., et al. 2022, ACM Comput. Surv., 54, 200:1, doi: 10.1145/3505244
-
[19]
D., Dissauer, K., Barnes, G., & Wagner, E
Leka, K. D., Dissauer, K., Barnes, G., & Wagner, E. L. 2023, The Astrophysical Journal, 942, 84, doi: 10.3847/1538-4357/ac9c04
-
[20]
D., Park, S.-H., Kusano, K., et al
Leka, K. D., Park, S.-H., Kusano, K., et al. 2019, The Astrophysical Journal Supplement Series, 243, 36, doi: 10.3847/1538-4365/ab2e12
-
[21]
Lemen, J., Title, A., Akin, D., et al. 2012, solphys, 275, 17, doi: 10.1007/s11207-011-9776-8
-
[22]
2025, 11-vision-transformer.ipynb, https: //github.com/Lightning-AI/tutorials/blob/ 69112e6fe73b50d159c4b7add6ddea412b458691/ .notebooks/course UvA-DL/11-vision- transformer.ipynb
Lippe, P. 2025, 11-vision-transformer.ipynb, https: //github.com/Lightning-AI/tutorials/blob/ 69112e6fe73b50d159c4b7add6ddea412b458691/ .notebooks/course UvA-DL/11-vision- transformer.ipynb
2025
-
[23]
Machol, J., Viereck, R., Peck, C., & Iii, J. M. 2022,
2022
-
[24]
2007 in Solar Storm Threat Analysis
Marusek, J. 2007 in Solar Storm Threat Analysis. https://www.semanticscholar.org/paper/Solar- Storm-Threat-Analysis-Marusek/ 73420378d1a42d74ebbfe63eaff697a32b401577
2007
-
[25]
2019, SN Applied Sciences, 1, 49
Natras, R., Horozovic, D., & Mulic, M. 2019, SN Applied Sciences, 1, 49
2019
-
[26]
2018, The Astrophysical Journal, 858, 113, doi: 10.3847/1538-4357/aab9a7
Ishii, M. 2018, The Astrophysical Journal, 858, 113, doi: 10.3847/1538-4357/aab9a7
-
[27]
2013, Solar Physics, 288, 241 Padial Doble, J
Nitta, N., Aschwanden, M., Boerner, P., et al. 2013, Solar Physics, 288, 241 Padial Doble, J. R., & Holley-Bockelmann, K. 2025, The Astrophysical Journal Supplement Series, 278, 14, doi: 10.3847/1538-4365/adbe35
-
[28]
Pesnell, W., Thompson, B., & Chamberlin, P. 2012, solphys, 275, 3, doi: 10.1007/s11207-011-9841-3
-
[29]
2012, Astronomy & Astrophysics, 547, A25
Bradshaw, S. 2012, Astronomy & Astrophysics, 547, A25
2012
-
[30]
Priest, E. R., & Forbes, T. G. 2002, A&A Rv, 10, 313, doi: 10.1007/s001590100013 20
-
[31]
2025, Surya: Foundation Model for Heliophysics, arXiv, doi: 10.48550/arXiv.2508.14112
Roy, S., Schmude, J., Lal, R., et al. 2025, Surya: Foundation Model for Heliophysics, arXiv, doi: 10.48550/arXiv.2508.14112
-
[32]
Schirninger, C., Jarolim, R., Veronig, A. M., et al. 2025, A&A, 703, A152, doi: 10.1051/0004-6361/202556401
-
[33]
Schrijver, C. J. 2009, Advances in Space Research, 43, 739, doi: 10.1016/j.asr.2008.11.004 The SunPy Community, Barnes, W. T., Bobra, M. G., et al. 2020, ApJ, 890, 68, doi: 10.3847/1538-4357/ab4f7a
-
[34]
Thiemann, E. M. B., Chamberlin, P. C., Eparvier, F. G., & Epp, L. 2018, Solar Physics, 293, 19, doi: 10.1007/s11207-018-1244-2 Van der Sande, K., Flyer, N., Berger, T. E., &
-
[35]
2022, Frontiers in Astronomy and Space Sciences, 9, 1031211
Gagnon, R. 2022, Frontiers in Astronomy and Space Sciences, 9, 1031211
2022
-
[36]
2017, Advances in neural information processing systems, 30
Vaswani, A., Shazeer, N., Parmar, N., et al. 2017, Advances in neural information processing systems, 30
2017
-
[37]
Sadykov, V. M., & Angryk, R. A. 2025, The Astrophysical Journal Supplement Series, 277, 60, doi: 10.3847/1538-4365/adb9e3
-
[38]
Woods, T. N., Eden, T., Eparvier, F. G., et al. 2024, Journal of Geophysical Research: Space Physics, 129, e2024JA032925, doi: https://doi.org/10.1029/2024JA032925
discussion (0)
Sign in with ORCID, Apple, or X to comment. Anyone can read and Pith papers without signing in.