Recognition: unknown
Architectural Trade-offs in the Energy-Efficient Era: A Comparative Study of power-capping NVIDIA H100 and H200
Pith reviewed 2026-05-10 15:15 UTC · model grok-4.3
The pith
Under power caps, the H100 GPU is slightly better for compute-bound workloads while the H200 excels for memory-bound applications.
A machine-rendered reading of the paper's core claim, the machinery that carries it, and where it could break.
Core claim
By isolating memory bandwidth as the main architectural variable between the H100 (HBM2e) and H200 (HBM3e), and applying power caps, the work finds that the H100 remains the slightly better choice for strictly compute-bound workloads across varying power caps, whereas the H200 demonstrates superior efficiency for memory-bound applications.
What carries the argument
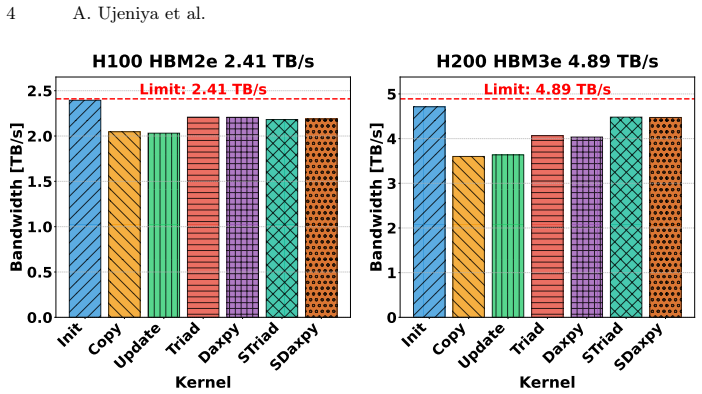
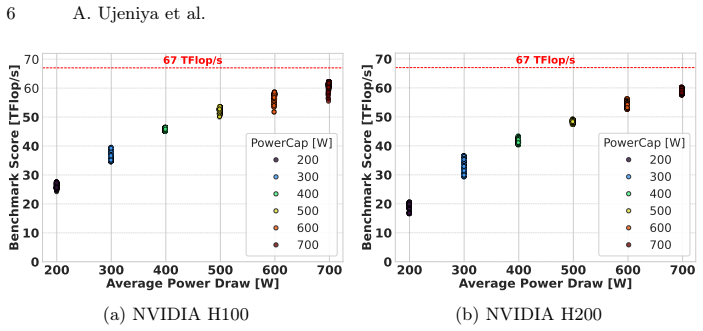
Power capping that shifts the split of power between memory and streaming multiprocessors, combined with the Roofline extremes of DGEMM for compute-bound and TheBandwidthBenchmark for memory-bound workloads.
If this is right
- GPU selection for energy efficiency under power limits should depend on whether a workload is limited by arithmetic or by memory access.
- Higher memory bandwidth in the H200 improves efficiency specifically when memory power becomes the dominant consumer under caps.
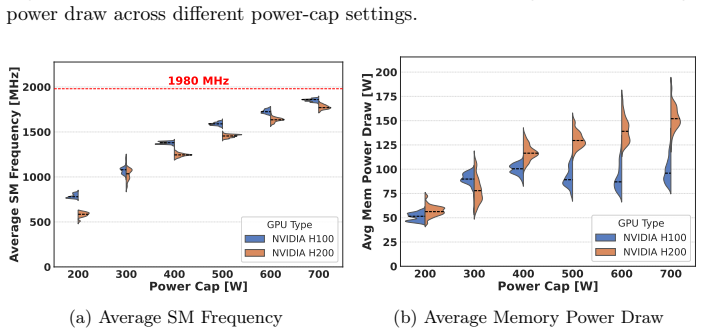
- Memory power consumption follows a predictable regression with occasional outliers that exceed the fitted limit.
- Efficiency rankings hold across the range of power caps tested for the two workload classes.
- Workload-aware assignment of H100 and H200 cards can improve overall system energy use in power-constrained installations.
Where Pith is reading between the lines
- Clusters running mixed job types could improve total efficiency by routing compute-heavy jobs to H100 nodes and memory-heavy jobs to H200 nodes.
- The same isolation method could be applied to future GPU generations to quantify how memory technology changes affect power-limited efficiency.
- Profiling tools that classify jobs by their position on the Roofline would help operators decide which card type to allocate.
- Extending the measurements to frequency scaling or other power-management knobs could reveal additional trade-offs.
Load-bearing premise
That the selected benchmarks accurately isolate pure compute-bound and memory-bound behavior and that memory bandwidth is the dominant difference driving the efficiency results.
What would settle it
Running the same power-cap sweeps on a mixed workload such as sparse matrix-vector multiplication or a real application that sits between the two Roofline extremes to check whether the efficiency ranking between H100 and H200 stays the same or reverses.
Figures


read the original abstract
Modern NVIDIA GPUs like the H100 (HBM2e) and H200 (HBM3e) share similar compute characteristics but differ significantly in memory interface technology and bandwidth. By isolating memory bandwidth as a key variable, the power distribution between the memory and Streaming Multiprocessors (SM) changes notably between the two architectures. In the era of energy-efficient computing, analyzing how these hardware characteristics impact performance per watt is critical. This study investigates how the H100 and H200 manage memory power consumption at various power-cap levels. By a regression analysis, we study the memory power limit and uncover outliers consuming more memory power. To evaluate efficiency, we employ compute-bound (DGEMM) and memory-bound (TheBandwidthBenchmark) workloads, representing the two extremes of the Roof\-line model. Our observations indicate that across varying power caps, the H100 remains the slightly better choice for strictly compute-bound workloads, whereas the H200 demonstrates superior efficiency for memory-bound applications.
Editorial analysis
A structured set of objections, weighed in public.
Referee Report
Summary. The manuscript compares power-capping behavior on NVIDIA H100 (HBM2e) and H200 (HBM3e) GPUs, which share similar compute characteristics but differ in memory bandwidth. It performs regression analysis on memory power limits to identify outliers, then evaluates energy efficiency using DGEMM (compute-bound) and TheBandwidthBenchmark (memory-bound) workloads that represent Roofline extremes. The central observation is that the H100 is slightly preferable for compute-bound workloads while the H200 shows superior efficiency for memory-bound applications across power-cap levels.
Significance. If the empirical results and methodology are fully documented, the work would provide practical guidance on GPU architecture selection for power-constrained HPC and data-center workloads, highlighting how memory-subsystem differences affect performance per watt. The choice of standard Roofline-aligned benchmarks is a positive aspect that grounds the comparison in established performance modeling.
major comments (3)
- [Abstract] Abstract: The regression analysis on memory power limits and outlier detection is described but no model equation, fitting procedure, coefficients, R² values, or quantitative results are supplied, so the power-distribution claims cannot be evaluated.
- [Abstract] Abstract / Results: No tables, figures, or numerical values (performance per watt, power breakdowns, error bars, or statistical tests) are presented for the DGEMM and TheBandwidthBenchmark runs, leaving the central efficiency comparison unsupported.
- [Abstract] Abstract: The claim that the workloads remain strictly compute-bound versus memory-bound under power caps (and that memory bandwidth is isolated) is not accompanied by any re-validation of arithmetic intensity or Roofline position at each cap level, so attribution of efficiency differences solely to HBM2e vs. HBM3e is not yet demonstrated.
minor comments (2)
- The benchmark name 'TheBandwidthBenchmark' should be clarified (is it a standard tool or custom code?) and any source or citation provided.
- [Title] Title uses inconsistent capitalization ('power-capping'); standardize to 'Power-Capping' or 'power capping'.
Simulated Author's Rebuttal
We thank the referee for the constructive and detailed feedback. The comments highlight important areas where additional documentation and validation will improve the clarity and rigor of the manuscript. We address each major comment below and outline the revisions we will make.
read point-by-point responses
-
Referee: [Abstract] Abstract: The regression analysis on memory power limits and outlier detection is described but no model equation, fitting procedure, coefficients, R² values, or quantitative results are supplied, so the power-distribution claims cannot be evaluated.
Authors: We agree that the abstract provides only a high-level description. The full manuscript details the regression in Section 3, but to enable direct evaluation we will revise the abstract to include the linear regression model equation, the fitting procedure (ordinary least squares), the coefficients, R² values, and a brief summary of the quantitative outlier results. A supporting table with these statistics will also be added to the main text. revision: yes
-
Referee: [Abstract] Abstract / Results: No tables, figures, or numerical values (performance per watt, power breakdowns, error bars, or statistical tests) are presented for the DGEMM and TheBandwidthBenchmark runs, leaving the central efficiency comparison unsupported.
Authors: The results section contains figures showing the efficiency trends, but we acknowledge the absence of explicit numerical tables and statistical details in both the abstract and main text. We will add a summary table of performance-per-watt values, power breakdowns, and error bars for representative power-cap levels, along with the results of statistical tests comparing the two architectures. Key numerical highlights will be incorporated into the revised abstract. revision: yes
-
Referee: [Abstract] Abstract: The claim that the workloads remain strictly compute-bound versus memory-bound under power caps (and that memory bandwidth is isolated) is not accompanied by any re-validation of arithmetic intensity or Roofline position at each cap level, so attribution of efficiency differences solely to HBM2e vs. HBM3e is not yet demonstrated.
Authors: This observation is correct. Our original analysis relied on the established Roofline characteristics of the chosen benchmarks without re-measuring arithmetic intensity at every power-cap setting. We will add a dedicated validation subsection (or appendix) that reports arithmetic intensity and Roofline placement for both DGEMM and TheBandwidthBenchmark across the full range of power caps on each GPU. This will confirm that the workloads remain in their intended regimes and strengthen the attribution to memory-subsystem differences. revision: yes
Circularity Check
No circularity: purely empirical comparison with no derivations or self-referential reductions
full rationale
The paper presents direct experimental measurements of performance and power on H100 and H200 GPUs under power caps using DGEMM (compute-bound) and TheBandwidthBenchmark (memory-bound). It describes a regression analysis solely to identify outliers in memory power consumption, with no fitted parameters then reused as 'predictions' of efficiency ratios or other quantities. No equations, first-principles derivations, uniqueness theorems, or ansatzes appear; the central claim follows from the observed data points without any step that reduces by construction to prior inputs or self-citations. The analysis is self-contained against external benchmarks.
Axiom & Free-Parameter Ledger
Reference graph
Works this paper leans on
-
[1]
Anantha,C.,Samuel,S.,Robert,B.:AJSSCclassicpaper:Low-powerCMOSdigital design. IEEE Solid-State Circuits Society Newsletter8(2), 6–6 (2003).https:// doi.org/10.1109/N-SSC.2003.6499960
-
[2]
Plexus: Taming billion-edge graphs with 3D parallel full-graph GNN training,
Antepara, O., Zhao, Z., Austin, B., Ding, N., Oliker, L., Wright, N.J., Williams, S.: Benchmark-driven models for energy analysis and attribution of GPU-accelerated supercomputing. In: Proceedings of the International Conference for High Perfor- mance Computing, Networking, Storage and Analysis. p. 888–904. SC ’25, Associa- tion for Computing Machinery, N...
-
[3]
Distributed, Parallel, and Cluster Computing0, 0 (2025).https://doi.org/10.48550/arXiv.2510.06902
Ayesha, A., Anna, K., Georg, H., Gerhard, W.: GROMACS unplugged: How power capping and frequency shapes performance on GPUs. Distributed, Parallel, and Cluster Computing0, 0 (2025).https://doi.org/10.48550/arXiv.2510.06902
-
[4]
Krzywaniak, A., Czarnul, P., Proficz, J.: Dynamic GPU power capping with online performance tracing for energy efficient GPU computing using DEPO tool. Future Generation Computer Systems145, 396–414 (2023).https://doi.org/10.1016/j. future.2023.03.041
work page doi:10.1016/j 2023
-
[5]
IEEE Trans- actions on Very Large Scale Integration (VLSI) Systems2(4), 446–455 (1994)
Najm, F.: A survey of power estimation techniques in VLSI circuits. IEEE Trans- actions on Very Large Scale Integration (VLSI) Systems2(4), 446–455 (1994). https://doi.org/10.1109/92.335013
-
[6]
In: 2019 IEEE/ACM Workflows in Support of Large-Scale Science (WORKS)
Patki, T., Frye, Z., Bhatia, H., Di Natale, F., Glosli, J., Ingolfsson, H., Rountree, B.: ComparingGPUpowerandfrequencycapping:AcasestudywiththeMuMMIwork- flow. In: 2019 IEEE/ACM Workflows in Support of Large-Scale Science (WORKS). pp. 31–39 (2019).https://doi.org/10.1109/WORKS49585.2019.00009
-
[7]
A., Bustos, B., & Hitschfeld, N
Schöne, R., Ilsche, T., Bielert, M., Gocht, A., Hackenberg, D.: Energy efficiency features of the Intel Skylake-SP processor and their impact on performance. In: 2019 International Conference on High Performance Computing & Simulation (HPCS). pp. 399–406 (2019).https://doi.org/10.1109/HPCS48598.2019.9188239
-
[8]
Association for Computing Machinery0, 449–459 (2025).https://doi.org/10.1145/3754598.3754670
Yuan, M., Srinivasan, S., Wang, X.: Power capping of GPU servers for machine learning inference optimization. Association for Computing Machinery0, 449–459 (2025).https://doi.org/10.1145/3754598.3754670
discussion (0)
Sign in with ORCID, Apple, or X to comment. Anyone can read and Pith papers without signing in.