0
Adaptive packed layouts enable efficient VLA ML code
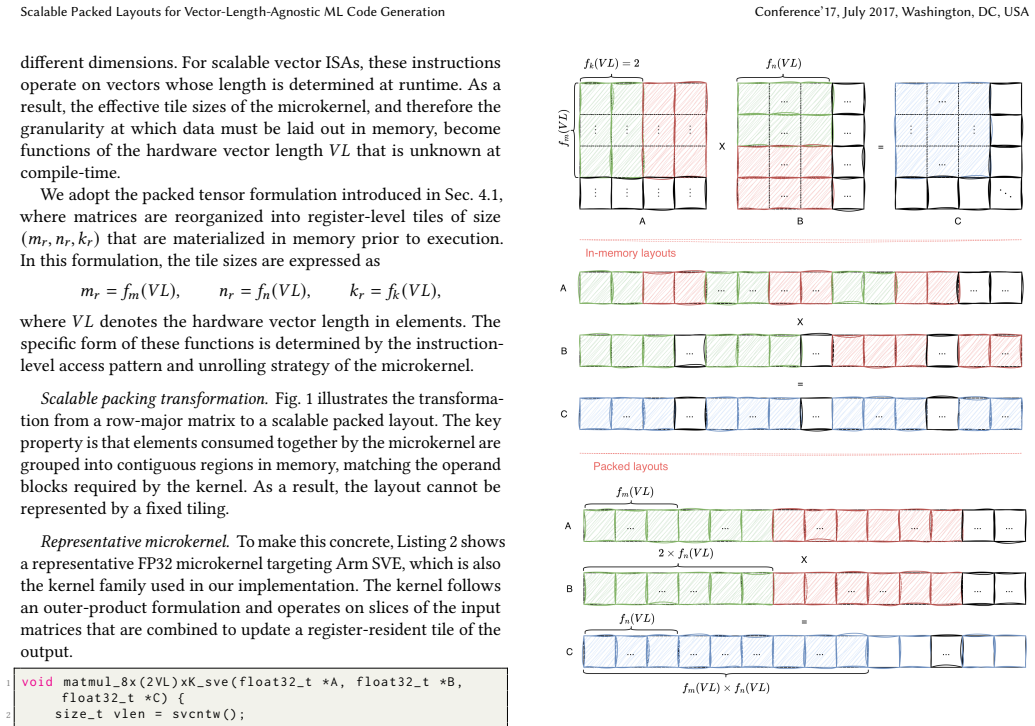
Scalable Packed Layouts for Vector-Length-Agnostic ML Code Generation
Layouts that respect runtime vector length let one compilation produce code that adapts across hardware and reaches 1.45 times the speed of
 full image
abstract click to expand
Scalable vector instruction sets such as Arm SVE enable vector-length-agnostic (VLA) execution, allowing a single implementation to adapt across hardware with different vector lengths. However, they complicate compiler code generation, as tiling and data layout decisions can no longer be fixed at compile time.
We present an approach for enabling VLA code generation in an end-to-end ML compilation pipeline through vector-length-aware packed data layouts and corresponding compiler extensions. We integrate these mechanisms into MLIR/IREE and extend tiling, fusion, and vectorization to operate with scalable vector lengths.
Evaluated on real-world ML workloads on Arm CPUs, our approach generates SVE code that is competitive with, and often outperforms, existing NEON-based code generation within IREE, achieving up to $1.45\times$ speedup. We also outperform PyTorch ecosystem frameworks, including ExecuTorch, TorchInductor, and eager execution, demonstrating the effectiveness of scalable vectorization in a production compiler setting. A simulator-based study further shows that the generated code scales with increasing SVE vector length on compute-bound workloads, supporting performance portability across hardware configurations.