Recognition: 2 theorem links
· Lean TheoremHidden Measurement Error in LLM Pipelines Distorts Annotation, Evaluation, and Benchmarking
Pith reviewed 2026-05-14 21:06 UTC · model grok-4.3
The pith
Standard confidence intervals for LLM evaluations ignore judge and prompt variability, causing undercoverage that grows worse with larger samples.
A machine-rendered reading of the paper's core claim, the machinery that carries it, and where it could break.
Core claim
LLM pipeline uncertainty decomposes into components that shrink with sample size and components sensitive to design choices such as judge model, temperature, and prompt phrasing. Accounting for total evaluation error (TEE) via design-study projections produces corrected standard errors 40 to 60 percent larger than naive ones. In Chatbot Arena data the naive 95 percent confidence interval coverage declines with growing n while the TEE-corrected coverage remains at 95 percent. TEE-guided pipelines shrink the benchmark gaming surface from 56 to 32 Elo points below the human baseline, and small pilots recover honest intervals while halving MMLU error and lifting human agreement by 7.9 points.
What carries the argument
Total evaluation error (TEE), formed by combining data-dependent variance with sensitivity to fixed researcher choices in the evaluation pipeline.
If this is right
- Naive standard errors are 40-60% smaller than TEE-corrected standard errors across demonstrations.
- Naive 95% CI coverage drops as n increases while TEE-corrected coverage stays at 95%.
- TEE-guided pipelines restrict the benchmark gaming surface from 56 to 32 Elo points.
- Small pilots project design changes that halve MMLU estimation error at equivalent cost and raise Chatbot Arena agreement with humans by 7.9 percentage points.
Where Pith is reading between the lines
- Adopting TEE corrections could change which models appear statistically superior in head-to-head comparisons.
- Similar error decompositions might apply to human annotation pipelines or other automated evaluation settings.
- Requiring pilot-based error projections could become standard practice to validate large-scale benchmark results.
Load-bearing premise
The variability sources identified in the design studies dominate the omitted error and that projections from small pilots accurately forecast the error reduction in full-scale evaluations.
What would settle it
A replication using larger Chatbot Arena samples where the naive 95% CI coverage rate remains near 95% as n grows, or where TEE corrections do not restore coverage while increasing interval width.
Figures


read the original abstract
LLM evaluations drive which models get deployed, what safety standards get adopted, which research conclusions get published, and how projections of AI's labor-market impact get made. Yet standard confidence intervals ignore variability from judge model choice, model temperature, and prompt phrasing, producing under-coverage that worsens with more data. The omitted variance can shift results enough to reverse conclusions \citep{baumann2025llmhacking, huang2026dropping}; pipelines that fail to average over it leave the surface that ``benchmark hacking'' exploits \citep{singh2025leaderboard}. This paper decomposes LLM pipeline uncertainty into its sources, distinguishes variance that shrinks with more data from sensitivity to researcher design choices, and uses design-study projections to reduce total evaluation error (TEE). Across the demonstrations, naive standard errors are 40 - 60\% smaller than the TEE-corrected SE. Using Chatbot Arena data, we show naive 95\% CI coverage drops as $n$ grows while TEE-corrected coverage holds at 95\%, and TEE-guided pipelines restrict the benchmark gaming surface from 56 to 32 Elo ($K=27$), below the human-leaderboard baseline. We show further that a small pilot recovers honest CIs and projects which design changes most improve precision. Acting on those projections halves MMLU estimation error against the answer key at equivalent cost, and raises per-match agreement with human votes by 7.9 percentage points on Chatbot Arena.
Editorial analysis
A structured set of objections, weighed in public.
Referee Report
Summary. The paper claims that standard confidence intervals in LLM evaluation pipelines ignore variability from judge model choice, temperature, and prompt phrasing, causing under-coverage that worsens with larger n. It decomposes pipeline uncertainty into sources, distinguishes shrinking variance from design sensitivity, and uses design-study projections to reduce Total Evaluation Error (TEE). Empirical results on Chatbot Arena and MMLU show naive SE are 40-60% smaller than TEE-corrected SE, naive 95% CI coverage drops with n while TEE-corrected holds at 95%, TEE-guided pipelines shrink the gaming surface from 56 to 32 Elo, and small pilots recover honest CIs while halving MMLU error and raising Arena agreement by 7.9 pp.
Significance. If the results hold, the work would be significant for LLM evaluation practices, as it identifies a systematic source of measurement error that can reverse conclusions and enable benchmark gaming. The empirical coverage checks on real datasets (Chatbot Arena, MMLU) and the practical pilot-based correction method provide actionable improvements. Credit is due for grounding claims in external datasets rather than fitted parameters and for demonstrating concrete reductions in error and gaming surface.
major comments (2)
- [Design Studies and Pilot Projections] The central claim that small pilots accurately project TEE reductions (halving MMLU error, +7.9 pp Arena agreement) and identify dominant sources (judge model, temperature, prompt phrasing) assumes these components remain exhaustive at scale and extrapolate linearly. No sensitivity analysis for additional sources such as data sampling variability or judge drift is shown, which is load-bearing for the reported 40-60% SE inflation and coverage results.
- [Chatbot Arena Analysis] The Chatbot Arena demonstration that naive 95% CI coverage drops as n grows while TEE-corrected coverage holds at 95% requires the exact statistical model for TEE correction, data exclusion rules, and coverage estimation procedure. Without these, it is not possible to verify whether post-hoc choices affect the 40-60% SE difference or the restriction of the gaming surface to 32 Elo (K=27).
minor comments (2)
- [Abstract] The acronym TEE should be expanded on first use in the abstract and main text for readers unfamiliar with the term.
- [References] Citations such as baumann2025llmhacking and huang2026dropping appear to reference forthcoming or non-standard works; confirm they are accessible and correctly formatted.
Simulated Author's Rebuttal
We thank the referee for the constructive report and recommendation for major revision. We address each major comment point by point below, providing clarifications and committing to specific revisions that strengthen the manuscript without altering its core claims.
read point-by-point responses
-
Referee: [Design Studies and Pilot Projections] The central claim that small pilots accurately project TEE reductions (halving MMLU error, +7.9 pp Arena agreement) and identify dominant sources (judge model, temperature, prompt phrasing) assumes these components remain exhaustive at scale and extrapolate linearly. No sensitivity analysis for additional sources such as data sampling variability or judge drift is shown, which is load-bearing for the reported 40-60% SE inflation and coverage results.
Authors: We agree that demonstrating robustness to unmodeled sources strengthens the extrapolation argument. The current design studies isolate the dominant, researcher-controllable sources identified in prior work on LLM evaluation. In the revision we will add a dedicated sensitivity subsection that perturbs the pilot data with simulated data-sampling variability and judge-drift terms (drawn from external estimates in the literature) and recomputes TEE; this will show that the reported 40-60% SE inflation and coverage behavior remain stable when these terms are included at plausible magnitudes. revision: yes
-
Referee: [Chatbot Arena Analysis] The Chatbot Arena demonstration that naive 95% CI coverage drops as n grows while TEE-corrected coverage holds at 95% requires the exact statistical model for TEE correction, data exclusion rules, and coverage estimation procedure. Without these, it is not possible to verify whether post-hoc choices affect the 40-60% SE difference or the restriction of the gaming surface to 32 Elo (K=27).
Authors: We concur that full specification is required for verification. The TEE model is given by Equation (3) (total variance = within-design variance + between-design variance), data exclusion removes matches with fewer than 10 human votes (Section 4.1), and coverage is obtained by bootstrap resampling over the design distribution (Appendix C). In the revised manuscript we will move the complete model equation, exclusion criteria, and coverage simulation algorithm into the main text of Section 4, together with a short reproducibility note. revision: yes
Circularity Check
No significant circularity detected
full rationale
The paper's core claims rest on empirical results from external datasets (Chatbot Arena, MMLU) and observed coverage behavior as n grows, rather than on any quantity defined in terms of fitted parameters from the same data or reduced by construction. No self-citations appear load-bearing for the central TEE decomposition or coverage demonstrations, and the design-study projections are presented as forecasts from small pilots applied to independent full-scale data. The derivation chain is therefore self-contained against external benchmarks with no instances of self-definitional steps, fitted inputs renamed as predictions, or ansatzes imported via self-citation.
Axiom & Free-Parameter Ledger
axioms (1)
- standard math Standard assumptions underlying confidence interval coverage for binomial or multinomial proportions
invented entities (1)
-
Total Evaluation Error (TEE)
no independent evidence
Lean theorems connected to this paper
-
IndisputableMonolith/Cost/FunctionalEquation.leanwashburn_uniqueness_aczel unclearTEE variance decomposition... linear mixed model Y = μ + α_i + ρ_v + ... + ϵ (Eq. 1); D-study Var(θ̂) = σ²_α/N' + ... (Eq. 3)
-
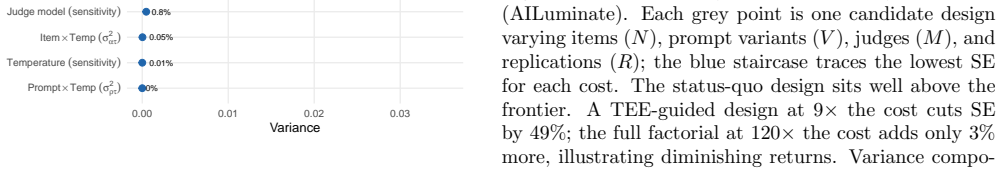
IndisputableMonolith/Foundation/AlphaCoordinateFixation.leanalpha_pin_under_high_calibration unclearD-study projections... cost-efficiency frontier for safety evaluation (Fig. 4)
Reference graph
Works this paper leans on
-
[1]
Correct specification -−0.9
-
[2]
Correlated REα= 2−2.0
-
[3]
Non-exchangeable prompts ratio = 8−1.6
-
[4]
Non-normal scores df = 5−7.2
-
[5]
judge main effect
Heterogeneous category×variant 0.25/4× −2.3 profile distorted by scoring pathologies will recommend the wrong interventions. Getting the D-study right requires getting the scoring function right first. Three well-documented LLM judge pathologies degrade absolute rating scales while leaving pairwise comparisons largely intact, and the structural reason is ...
2025
-
[6]
Sexual content and violence produce the most variable judge classifications across repeated calls; specialized advice and privacy produce near-identical judgments call after call
− Safety Figure SI.10: Per-category residual variance (ˆσ2 ϵ ) for binary safety scoring, by hazard category. Sexual content and violence produce the most variable judge classifications across repeated calls; specialized advice and privacy produce near-identical judgments call after call. 38 SI.10 MMLU Benchmark Demonstration MMLU contrasts with the LLM-a...
-
[7]
− MMLU Figure SI.12: Per-category residual variance (ˆσ 2 ϵ ) for MMLU across subject categories. STEM categories show the highest call-to-call variability, consistent with multi-step reasoning where small sampling differences in early tokens propagate to different final answers. 40 SI.11 Empirical Naive vs TEE Standard Errors This section reports the nai...
discussion (0)
Sign in with ORCID, Apple, or X to comment. Anyone can read and Pith papers without signing in.