Recognition: unknown
Do little red dots really form a distinct class of astronomical objects?
Pith reviewed 2026-05-10 15:09 UTC · model grok-4.3
The pith
Little red dots represent the extreme tail of a continuous distribution of galaxies rather than a separate class.
A machine-rendered reading of the paper's core claim, the machinery that carries it, and where it could break.
Core claim
Defining continuous measures of compactness, V-shape sharpness, and broad Balmer strength on a sample of roughly 48,000 photometric and 5,000 spectroscopic galaxies reveals no discontinuity at common LRD thresholds. The fraction of compact galaxies increases steadily with V-shape intensity, broad Hα strength correlates with both compactness and V-shape sharpness, and the [N II] deficit together with Balmer-decrement trends are shared properties of compact metal-poor galaxies. Only the most extreme 3 percent of LRDs show a prominent Balmer break that could be non-stellar, while derived dust masses of 4–7 × 10^4 solar masses remain low enough to explain the lack of ALMA detections. LRDs are因此
What carries the argument
A continuous LRDness metric formed from compactness, V-shape sharpness in the spectral energy distribution, and broad Balmer line strength that demonstrates population continuity instead of a sharp boundary.
If this is right
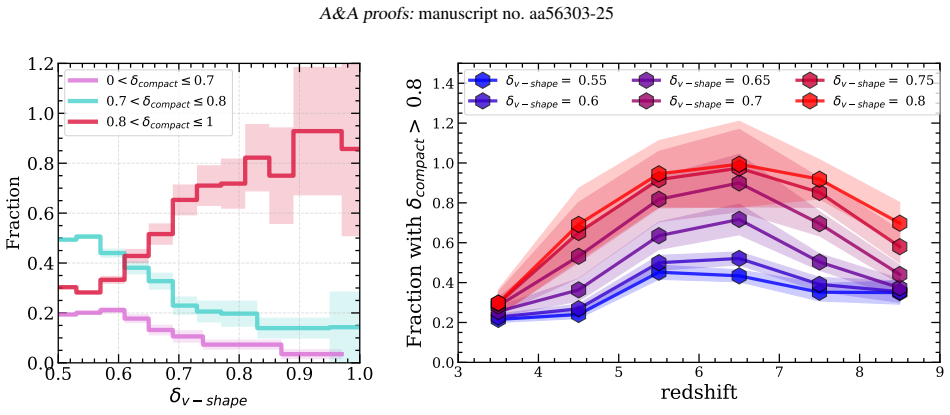
- The fraction of compact galaxies rises continuously with V-shape intensity rather than jumping at any fixed LRD cut.
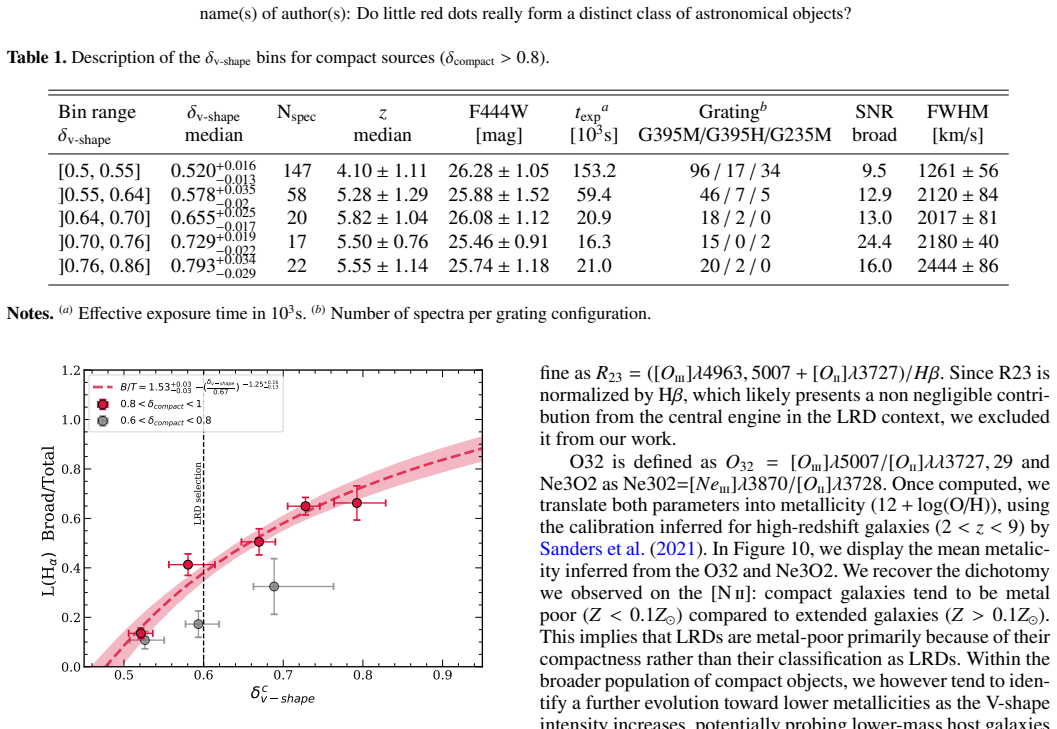
- Broad Hα strength increases together with both V-shape sharpness and compactness across the full sample.
- The [N II] deficit is a general property of compact metal-poor galaxies and is not unique to LRDs.
- Balmer-decrement trends with V-shape sharpness are shared by LRDs and non-LRDs, supporting a common dust-attenuation origin.
- Only the top 3 percent of extreme LRDs exhibit Balmer breaks strong enough to suggest a non-stellar contribution.
Where Pith is reading between the lines
- If continuity holds, models of early galaxy and black-hole growth can treat LRDs as the high-end tail of standard populations rather than requiring new object types.
- The same continuous-metric approach could be applied to other JWST-selected enigmatic sources to test whether apparent new classes are actually distribution tails.
- High-resolution spectroscopy across a wide range of V-shape and compactness values could verify whether the broad lines arise from the same classical broad-line-region physics throughout.
- Threshold-based selections in astronomy carry a general risk of manufacturing apparent new classes from the extremes of already-known distributions.
Load-bearing premise
The three chosen metrics of compactness, V-shape sharpness, and broad Balmer strength are sufficient to detect any genuine discontinuity between LRDs and other galaxies, and the sample selection does not systematically miss a truly separate class.
What would settle it
Discovery of a statistically significant gap or bimodal distribution in the joint space of compactness, V-shape sharpness, and broad-line strength that cleanly separates sources above typical LRD thresholds from the rest of the galaxy population.
Figures


read the original abstract
JWST observations have identified a class of enigmatic sources known as "Little Red Dots" (LRDs). These have been interpreted as a distinct class of active galactic nuclei (AGN) and host galaxies, potentially involving "quasi-stars" or Black Hole stars (BH*). However, two questions remain: is there a clear discontinuity between LRDs and field galaxies, and do LRDs form a homogeneous population? In this work, we address these issues by introducing a continuous metric to evaluate the "LRDness" of galaxies. We measure their compactness ($\delta_{compact}$), the sharpness of the V-shaped spectral energy distribution ($\delta_{v-shape}$), and the strength of the broad Balmer line emission. We apply this approach to a sample of ~48,000 galaxies with photometric and ~5,000 with spectroscopic information, selected over ~750 arcmin^2. We find that V-shape prominence correlates strongly with morphology without a clear transition at common LRD selection thresholds: the fraction of compact galaxies rises continuously with V-shape intensity. Similarly, broad H$\alpha$ strength increases with both V-shape sharpness and compactness. The [N II] deficit is not an exclusive feature of LRDs but a global property of compact, metal-poor galaxies. Only the 3% most extreme LRDs present a prominent Balmer break (>3) of potentially non-stellar origin. LRDs and non-LRDs follow similar trends in the evolution of the Balmer decrement with V-shape sharpness, suggesting a shared physical origin, likely dust attenuation. Estimated dust masses (~4-7 x 10^4 M_{sun}) and luminosities are low enough to account for their non-detection by ALMA. We conclude that most LRDs do not represent a separate class of objects, but rather the extreme tail of a continuous distribution of galaxies and broad H$\alpha$ emitters, consistent with a classical broad line region and dust attenuation.
Editorial analysis
A structured set of objections, weighed in public.
Referee Report
Summary. The paper claims that Little Red Dots (LRDs) do not constitute a distinct class of objects but instead represent the extreme tail of a continuous distribution of galaxies and broad Hα emitters. Using continuous metrics for compactness (δ_compact), V-shape sharpness (δ_v-shape), and broad Balmer line strength applied to ~48,000 photometric and ~5,000 spectroscopic galaxies over ~750 arcmin², the authors report no clear discontinuity at standard LRD thresholds: compact fraction rises continuously with V-shape intensity, broad Hα strength correlates with both, the [N II] deficit is a general property of compact metal-poor galaxies, Balmer decrement trends are shared (suggesting dust attenuation), and only the top 3% of extreme LRDs show a prominent Balmer break (>3) of potentially non-stellar origin. They conclude LRDs are consistent with classical broad-line regions and dust effects, with low dust masses explaining ALMA non-detections.
Significance. If the continuity claim holds, the result would reframe JWST LRDs as an extension of known high-z galaxy and AGN populations rather than exotic new entities (e.g., quasi-stars or BH*), with implications for AGN demographics, dust physics, and galaxy evolution models. Strengths include the shift from binary classification to continuous metrics and the large sample enabling trend analysis across morphology, photometry, and spectroscopy. The significance is reduced by the untested assumption that the three metrics fully capture any potential distinct population and by incomplete documentation of sample cuts and metric definitions.
major comments (3)
- [Methods / metric definitions] The precise definitions and computational formulas for the continuous metrics δ_compact and δ_v-shape (including any normalization, thresholds, or combination into an overall 'LRDness' score), as well as error propagation and handling of photometric redshift uncertainties, are not provided. This is load-bearing for the central continuity claim because the reported trends (e.g., continuous rise in compact fraction with V-shape intensity) cannot be reproduced or assessed for robustness without them.
- [Sample selection] Sample selection criteria for the ~48,000 photometric and ~5,000 spectroscopic galaxies (magnitude limits, redshift range, field cuts, and any post-selection filters) are not explicitly stated. This is load-bearing because without a completeness assessment, it remains possible that a rare distinct LRD subpopulation differing in unmeasured properties (e.g., X-ray or mid-IR) was systematically excluded, leaving the observed continuity uninformative about hidden classes.
- [Results / continuity analysis] No formal statistical test for multimodality, bimodality, or mixture modeling is applied to the joint distribution of the three metrics to quantify the absence of discontinuity or subpopulations. The claim that 'most LRDs do not represent a separate class' rests on visual/qualitative continuity, which is insufficient to rule out a small but physically distinct tail.
minor comments (2)
- [Abstract / results] Clarify quantitatively how the '3% most extreme LRDs' are defined (e.g., in terms of a combined δ metric or percentile in V-shape sharpness).
- [Discussion] The Balmer decrement trends with V-shape sharpness are presented as evidence for shared dust attenuation; a brief comparison to literature values for non-LRD compact galaxies at similar redshifts would strengthen this.
Simulated Author's Rebuttal
We thank the referee for their constructive comments, which have prompted us to clarify key aspects of the analysis and strengthen the presentation of our continuity argument. We address each major comment below and have revised the manuscript accordingly.
read point-by-point responses
-
Referee: [Methods / metric definitions] The precise definitions and computational formulas for the continuous metrics δ_compact and δ_v-shape (including any normalization, thresholds, or combination into an overall 'LRDness' score), as well as error propagation and handling of photometric redshift uncertainties, are not provided. This is load-bearing for the central continuity claim because the reported trends (e.g., continuous rise in compact fraction with V-shape intensity) cannot be reproduced or assessed for robustness without them.
Authors: We agree that the original text provided insufficient detail on the metric definitions. In the revised manuscript we have added an explicit subsection (2.2) with the full formulas: δ_compact is computed as the ratio of observed effective radius to the expected radius from the size-mass relation at the given stellar mass and redshift, normalized to zero for typical field galaxies; δ_v-shape is defined as the excess flux ratio (F1500 - F2770)/(F2770 - F444W) after subtracting a linear continuum fit, with explicit band choices and normalization. Error propagation follows standard analytic expressions including covariance terms, and photometric redshift uncertainties are propagated via 1000 Monte Carlo realizations per object, perturbing z_phot within its 1σ error and recomputing all metrics. These additions make the trends fully reproducible. revision: yes
-
Referee: [Sample selection] Sample selection criteria for the ~48,000 photometric and ~5,000 spectroscopic galaxies (magnitude limits, redshift range, field cuts, and any post-selection filters) are not explicitly stated. This is load-bearing because without a completeness assessment, it remains possible that a rare distinct LRD subpopulation differing in unmeasured properties (e.g., X-ray or mid-IR) was systematically excluded, leaving the observed continuity uninformative about hidden classes.
Authors: We have expanded Section 2.1 to state the selection explicitly: the photometric sample comprises all sources with F444W AB < 27 mag, 3 < z_phot < 9, and reliable photometry in the CEERS, PRIMER, and COSMOS-Web fields (total area ~750 arcmin²); the spectroscopic sample uses NIRSpec PRISM and grating data with secure redshifts and S/N > 5 on Hα. We now include a completeness assessment based on injection simulations, showing >85% recovery for compact sources at the magnitude limit. While our analysis is restricted to the rest-frame optical/near-IR domain where LRDs are defined, we acknowledge that subpopulations visible only in X-ray or mid-IR could exist; however, the continuity we report is robust within the parameter space probed by the defining LRD observables. revision: yes
-
Referee: [Results / continuity analysis] No formal statistical test for multimodality, bimodality, or mixture modeling is applied to the joint distribution of the three metrics to quantify the absence of discontinuity or subpopulations. The claim that 'most LRDs do not represent a separate class' rests on visual/qualitative continuity, which is insufficient to rule out a small but physically distinct tail.
Authors: We accept that a formal test adds rigor. In the revision we have applied Gaussian mixture modeling to the three-dimensional metric space and used the Bayesian Information Criterion to compare one- versus two-component models; the single-component model is strongly preferred. We also performed Hartigan’s dip test on the marginal distributions of each metric, obtaining p-values > 0.1 consistent with unimodality. These results support our original conclusion that the bulk of the population is continuous. We nevertheless note that the tests have limited sensitivity to subpopulations smaller than ~1%, so a rare distinct tail cannot be entirely excluded, but this does not alter the finding that the majority of LRDs belong to the continuous distribution. revision: partial
Circularity Check
No significant circularity; metrics and conclusions are empirically grounded
full rationale
The paper defines three metrics directly from independent observables (morphological compactness δ_compact, photometric V-shape sharpness δ_v-shape, and spectroscopic broad Balmer strength) and applies them to a large photometric (~48k) and spectroscopic (~5k) sample. It reports observed correlations showing continuous trends (e.g., compact fraction rising with V-shape intensity, shared Balmer decrement evolution) without any step that reduces a claimed prediction or discontinuity test to a fitted parameter, self-defined quantity, or self-citation chain. The conclusion that LRDs form the extreme tail of a continuous distribution follows from the absence of breaks in the data distributions rather than from construction or renaming. No load-bearing uniqueness theorem or ansatz is invoked.
Axiom & Free-Parameter Ledger
axioms (2)
- domain assumption Photometric compactness and V-shaped SEDs can be measured continuously and meaningfully across the galaxy population without discrete thresholds defining new classes.
- domain assumption The selected sample of ~48,000 photometric and ~5,000 spectroscopic galaxies is representative enough to detect any discontinuity if one existed.
Forward citations
Cited by 1 Pith paper
-
Little red dots as obscured little blue dots: relative abundances, luminosities, and black-hole masses
Little red dots are the dust-reddened, high-inclination counterparts of little blue dots under a super-Eddington unification model, with luminosity-dependent fractions peaking near 20% and obscured systems showing sys...
Reference graph
Works this paper leans on
-
[1]
Akins, H. B., Casey, C. M., Lambrides, E., et al. 2025, ApJ, 991, 37 Arnouts, S., Cristiani, S., Moscardini, L., et al. 1999, MNRAS, 310, 540 Astropy Collaboration, Price-Whelan, A. M., Lim, P. L., et al. 2022, ApJ, 935, 167 Baggen, J. F. W., Scoggins, M. T., van Dokkum, P., et al. 2026, arXiv e-prints, arXiv:2602.02702 Baldwin, J. A., Phillips, M. M., & ...
work page internal anchor Pith review arXiv 2025
-
[2]
2025, arXiv e-prints, arXiv:2512.02096
Cy- cle 0 Early Release Science Ford, H. C., Bartko, F., Bely, P. Y ., et al. 1998, in Society of Photo-Optical Instru- mentation Engineers (SPIE) Conference Series, V ol. 3356, Space Telescopes and Instruments V , ed. P. Y . Bely & J. B. Breckinridge, 234–248 Fu, S., Zhang, Z., Jiang, D., et al. 2025, arXiv e-prints, arXiv:2512.02096 Furtak, L. J., Secun...
discussion (0)
Sign in with ORCID, Apple, or X to comment. Anyone can read and Pith papers without signing in.