Recognition: unknown
GraphTide: Augmenting Knowledge-Intensive Text with Progressive Nested Graph
Pith reviewed 2026-05-10 15:32 UTC · model grok-4.3
The pith
Progressive animated nested graphs improve reader comprehension of knowledge-intensive texts over static methods.
A machine-rendered reading of the paper's core claim, the machinery that carries it, and where it could break.
Core claim
GraphTide progressively constructs nested entity-relationship graphs with an on-demand decomposition pipeline for intra- and inter-sentence relationships, applies a structure-aware force-directed layout optimization, and reveals content through animated incremental transitions, leading to significantly higher user comprehension scores than traditional graph techniques or static nested graph representations.
What carries the argument
On-demand entity-relationship decomposition pipeline that builds nested graphs for intra- and inter-sentence relationships, combined with animated progressive revelation and structure-aware force-directed layout.
If this is right
- Readers can track entity connections more reliably as the text narrative unfolds without losing overall context.
- Structural clarity of the growing graph improves through the layout optimization step.
- Comprehension gains hold relative to both conventional graph visualizations and non-animated nested graphs.
- The method supports knowledge-intensive domains such as academic articles where entity relationships span multiple sentences.
Where Pith is reading between the lines
- The same progressive nesting idea could be tested on other dense relational texts such as legal documents or technical reports.
- Combining the pipeline with existing text-analysis tools might allow the graphs to update automatically when new sections are read.
- The animation component could be examined for effects on reading speed in addition to comprehension accuracy.
Load-bearing premise
The automatic decomposition pipeline accurately extracts and structures entity relationships without introducing misrepresentations, and the animations do not add new cognitive burdens.
What would settle it
A replication user study with the same texts and tasks that finds no statistically significant comprehension difference between GraphTide and the static or traditional graph baselines.
Figures


read the original abstract
Knowledge-intensive text usually contains fruitful entities and complex relationships, such as academic articles and scientific exposition. Reading and comprehending such texts often demands considerable time and mental effort to track the relationships between entities. To reduce the burden, we present GraphTide, a visualization technique that progressively constructs nested entity-relationship graphs with animation to support the understanding of complex text. Our method features an on-demand entity-relationship decomposition pipeline that constructs nested graphs to represent intra- and inter-sentence relationships. Moreover, we propose a structure-aware force-directed layout optimization algorithm to enhance structural clarity. Sentences and their associated entities are incrementally revealed through animated transitions, helping users maintain context as the narrative unfolds. A user study shows that GraphTide significantly improves users' comprehension of knowledge-intensive texts compared to traditional graph-based techniques and static nested graph representations.
Editorial analysis
A structured set of objections, weighed in public.
Referee Report
Summary. The paper presents GraphTide, a visualization technique that augments knowledge-intensive texts (e.g., academic articles) with progressively constructed nested entity-relationship graphs. Key components include an on-demand decomposition pipeline for intra- and inter-sentence relationships, a structure-aware force-directed layout algorithm, and animated incremental revelation of sentences and entities to maintain narrative context. The central claim is that a user study demonstrates GraphTide significantly improves user comprehension compared to traditional graph-based techniques and static nested graph representations.
Significance. If the empirical results hold under scrutiny, GraphTide offers a novel approach to reducing cognitive load in reading complex texts by combining nested graph structures with progressive animation. This could have practical value in HCI applications for education, scientific literature review, and information visualization, extending prior work on graph-based text augmentation with dynamic, context-preserving presentation.
major comments (2)
- [User study / results] User study section (details referenced in abstract and results): The claim of 'significant improvement' in comprehension lacks any description of study design elements including participant count, recruitment method, demographics, exact baseline implementations (how traditional graphs and static nested graphs were realized), comprehension metrics (e.g., accuracy on relationship questions, reading time, NASA-TLX scores), statistical tests (t-tests, ANOVA, p-values), or effect sizes. This information is required to evaluate whether the data support the central claim.
- [Methods / pipeline description] Entity-relationship decomposition pipeline (described in methods): No validation is reported for the on-demand pipeline's accuracy in capturing intra- and inter-sentence relationships, such as comparison to expert-annotated ground truth, precision/recall metrics, or inter-rater reliability. This directly affects the weakest assumption that the generated nested graphs faithfully represent the text without introducing misrepresentations.
minor comments (2)
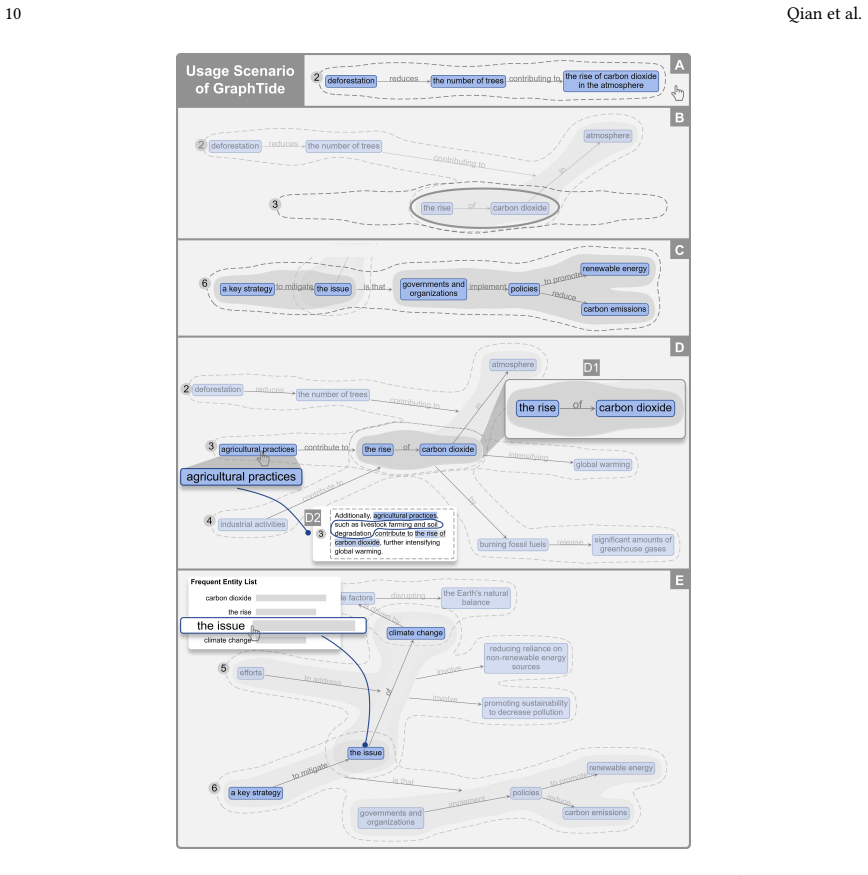
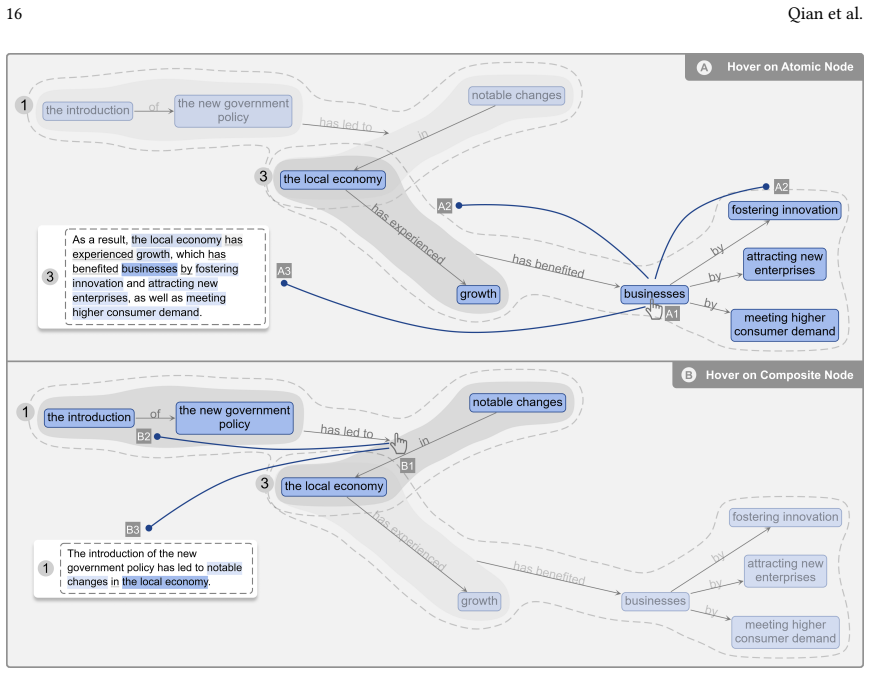
- [Figures] Figure captions for the progressive animation examples could include more detail on what specific relationships are being revealed in each transition step to aid reader understanding.
- [Notation / layout] Notation for graph elements (nodes as entities, edges as relationships) is introduced but not consistently referenced with the same symbols across the layout optimization and animation sections.
Simulated Author's Rebuttal
We thank the referee for the constructive feedback on our manuscript. We address each major comment below and commit to substantial revisions that will strengthen the empirical and methodological sections.
read point-by-point responses
-
Referee: [User study / results] User study section (details referenced in abstract and results): The claim of 'significant improvement' in comprehension lacks any description of study design elements including participant count, recruitment method, demographics, exact baseline implementations (how traditional graphs and static nested graphs were realized), comprehension metrics (e.g., accuracy on relationship questions, reading time, NASA-TLX scores), statistical tests (t-tests, ANOVA, p-values), or effect sizes. This information is required to evaluate whether the data support the central claim.
Authors: We agree that the current description of the user study is insufficient for full evaluation and reproducibility. The manuscript summarized the key outcome to emphasize the visualization contribution, but this led to omission of critical design details. In the revised version we will expand the User Study section with a complete account of participant count and demographics, recruitment procedure, precise implementations of the two baseline conditions (traditional graph-based techniques and static nested graph representations), the comprehension metrics employed (including accuracy on relationship questions, reading time, and NASA-TLX workload scores), the statistical tests performed, associated p-values, and effect sizes. These additions will directly support the claim of significant improvement. revision: yes
-
Referee: [Methods / pipeline description] Entity-relationship decomposition pipeline (described in methods): No validation is reported for the on-demand pipeline's accuracy in capturing intra- and inter-sentence relationships, such as comparison to expert-annotated ground truth, precision/recall metrics, or inter-rater reliability. This directly affects the weakest assumption that the generated nested graphs faithfully represent the text without introducing misrepresentations.
Authors: We acknowledge that the absence of quantitative validation for the decomposition pipeline is a limitation that weakens confidence in the generated graphs. The pipeline combines dependency parsing and coreference resolution to extract intra- and inter-sentence relationships on demand, yet no accuracy assessment was included. In the revision we will add a new subsection reporting validation results: precision/recall against expert-annotated ground-truth texts drawn from the same domain as the study materials, together with inter-rater reliability statistics where multiple annotators were used. This will substantiate that the nested graphs faithfully capture the source text. revision: yes
Circularity Check
No circularity: design technique plus empirical user study
full rationale
The paper introduces GraphTide as a visualization technique featuring an on-demand entity-relationship decomposition pipeline, structure-aware force-directed layout, and animated progressive nested graphs. Its central claim rests on a comparative user study measuring comprehension improvements. No mathematical derivations, predictions, fitted parameters, or first-principles results are present that could reduce to inputs by construction. No self-citation load-bearing steps, uniqueness theorems, or ansatzes appear in the argument. The contribution is self-contained as an applied design plus external empirical validation.
Axiom & Free-Parameter Ledger
Reference graph
Works this paper leans on
-
[1]
Shaaron Ainsworth. 2006. DeFT: A conceptual framework for learning with multiple representations. Learning and Instruction, 16, 183-198.Learning and Instruction16 (06 2006), 183–198. doi:10.1016/j.learninstruc.2006.03.001
-
[2]
Mohammad Alharbi and Robert S. Laramee. 2019. SoS TextVis: An Extended Survey of Surveys on Text Visualization.Comput.8, 1 (2019), 17. doi:10.3390/COMPUTERS8010017
-
[3]
2003.Logics of conversation
Nicholas Asher and Alex Lascarides. 2003.Logics of conversation. Cambridge University Press
2003
-
[4]
Matthew Berger, Katherine McDonough, and Lee M. Seversky. 2017. cite2vec: Citation-Driven Document Exploration via Word Embeddings.IEEE Trans. Vis. Comput. Graph.23, 1 (2017), 691–700. doi:10.1109/TVCG.2016.2598667
-
[5]
Rachel M Best, Michael Rowe, Yasuhiro Ozuru, and Danielle S McNamara. 2005. Deep-level comprehension of science texts: The role of the reader and the text.Topics in language disorders25, 1 (2005), 65–83
2005
-
[6]
Eric A Bier, Edward W Ishak, and Ed Chi. 2006. Entity workspace: an evidence file that aids memory, inference, and reading. InIntelligence and Security Informatics: IEEE International Conference on Intelligence and Security Informatics, ISI 2006, San Diego, CA, USA, May 23-24, 2006. Proceedings
2006
-
[7]
Matthew Brehmer, Stephen Ingram, Jonathan Stray, and Tamara Munzner. 2014. Overview: The Design, Adoption, and Analysis of a Visual Document Mining Tool for Investigative Journalists.IEEE Trans. Vis. Comput. Graph.20, 12 (2014), 2271–2280. doi:10.1109/TVCG.2014.2346431
-
[8]
Bruce K Britton and Sami Gülgöz. 1991. Using Kintsch’s computational model to improve instructional text: Effects of repairing inference calls on recall and cognitive structures.Journal of educational Psychology83, 3 (1991), 329
1991
-
[9]
Quim Castellà and Charles Sutton. 2014. Word storms: multiples of word clouds for visual comparison of documents. In23rd International World Wide Web Conference, WWW ’14, Seoul, Republic of Korea, April 7-11, 2014. ACM, 665–676. doi:10.1145/2566486.2567977
-
[10]
Wei Chen, Tianyi Lao, Jing Xia, Xinxin Huang, Biao Zhu, Wanqi Hu, and Huihua Guan. 2016. GameFlow: Narrative Visualization of NBA Basketball Games.IEEE Trans. Multim.18, 11 (2016), 2247–2256. doi:10.1109/TMM.2016.2614221
-
[11]
Ming-Te Chi, Shih-Syun Lin, Shiang-Yi Chen, Chao-Hung Lin, and Tong-Yee Lee. 2015. Morphable Word Clouds for Time-Varying Text Data Visualization.IEEE Trans. Vis. Comput. Graph.21, 12 (2015), 1415–1426. doi:10.1109/TVCG.2015.2440241
-
[12]
Weiwei Cui, Yingcai Wu, Shixia Liu, Furu Wei, Michelle X. Zhou, and Huamin Qu. 2010. Context-Preserving, Dynamic Word Cloud Visualization. IEEE Computer Graphics and Applications30, 6 (2010), 42–53. doi:10.1109/MCG.2010.102
-
[13]
Dagre. 2015. Dagre: A Directed Graph Layout Library. https://github.com/dagrejs/dagre. Accessed: 2025-02-21
2015
-
[14]
Ugur Dogrusöz, Erhan Giral, Ahmet Cetintas, Ali Civril, and Emek Demir. 2004. A Compound Graph Layout Algorithm for Biological Pathways. In Graph Drawing, 12th International Symposium, GD 2004, New York, NY, USA, September 29 - October 2, 2004, Revised Selected Papers (Lecture Notes in Computer Science, Vol. 3383). 442–447. doi:10.1007/978-3-540-31843-9_45
-
[15]
Ugur Dogrusöz, Erhan Giral, Ahmet Cetintas, Ali Civril, and Emek Demir. 2009. A layout algorithm for undirected compound graphs.Inf. Sci.179, 7 (2009), 980–994. doi:10.1016/J.INS.2008.11.017
-
[16]
FMS Advanced Systems Group. 2007. Sentinel Visualizer. Website. https://sentinelvisualizer.com/
2007
-
[17]
Michael Forster. 2002. Applying Crossing Reduction Strategies to Layered Compound Graphs. InGraph Drawing, 10th International Symposium, GD 2002, Irvine, CA, USA, August 26-28, 2002, Revised Papers (Lecture Notes in Computer Science, Vol. 2528), Stephen G. Kobourov and Michael T. Goodrich (Eds.). 276–284. doi:10.1007/3-540-36151-0_26
-
[18]
Thomas MJ Fruchterman and Edward M Reingold. 1991. Graph drawing by force-directed placement.Software: Practice and experience21, 11 (1991), 1129–1164
1991
-
[19]
Johanna Fulda, Matthew Brehmer, and Tamara Munzner. 2016. TimeLineCurator: Interactive Authoring of Visual Timelines from Unstructured Text. IEEE Trans. Vis. Comput. Graph.22, 1 (2016), 300–309. doi:10.1109/TVCG.2015.2467531 Manuscript submitted to ACM GraphTide: Augmenting Knowledge-Intensive Text with Progressive Nested Graph 25
- [20]
-
[21]
In Proceedings of the 2024 CHI Conference on Human Factors in Computing Systems (CHI ’24)
Ziwei Gu, Ian Arawjo, Kenneth Li, Jonathan K. Kummerfeld, and Elena L. Glassman. 2024. An AI-Resilient Text Rendering Technique for Reading and Skimming Documents. InProceedings of the CHI Conference on Human Factors in Computing Systems, CHI 2024, Honolulu, HI, USA, May 11-16, 2024, Florian ’Floyd’ Mueller, Penny Kyburz, Julie R. Williamson, Corina Sas, ...
-
[22]
Boedihardjo, and Naren Ramakrishnan
Mahmud Shahriar Hossain, Patrick Butler, Arnold P. Boedihardjo, and Naren Ramakrishnan. 2012. Storytelling in entity networks to support intelligence analysts. InThe 18th ACM SIGKDD International Conference on Knowledge Discovery and Data Mining, KDD ’12, Beijing, China, August 12-16, 2012, Qiang Yang, Deepak Agarwal, and Jian Pei (Eds.). ACM, 1375–1383. ...
-
[23]
Chao-Wen Hsuan Yuan, Tzu-Wei Yu, Jia-Yu Pan, and Wen-Chieh Lin. 2024. KGScope: Interactive Visual Exploration of Knowledge Graphs With Embedding-Based Guidance.IEEE Transactions on Visualization and Computer Graphics30, 12 (2024), 7702–7716. doi:10.1109/TVCG.2024.3360690
-
[24]
Mengdie Hu, Krist Wongsuphasawat, and John T. Stasko. 2017. Visualizing Social Media Content with SentenTree.IEEE Trans. Vis. Comput. Graph. 23, 1 (2017), 621–630. doi:10.1109/TVCG.2016.2598590
- [25]
-
[26]
Franziska Huth, Maurice Koch, Miriam Awad-Mohammed, Daniel Weiskopf, and Kuno Kurzhals. 2024. Eye tracking on text reading with visual enhancements. InProceedings of the 2024 Symposium on Eye Tracking Research and Applications. 1–7
2024
-
[27]
Magdalena Jankowska, Vlado Keselj, and Evangelos E. Milios. 2012. Relative N-gram signatures: Document visualization at the level of character N-grams. In7th IEEE Conference on Visual Analytics Science and Technology, IEEE V AST 2012, Seattle, W A, USA, October 14-19, 2012. IEEE Computer Society, 103–112. doi:10.1109/VAST.2012.6400484
-
[28]
Peiling Jiang, Jude Rayan, Steven P. Dow, and Haijun Xia. 2023. Graphologue: Exploring Large Language Model Responses with Interactive Diagrams. InProceedings of the 36th Annual ACM Symposium on User Interface Software and Technology. Article 3, 20 pages. doi:10.1145/3586183.3606737
-
[29]
Tomihisa Kamada and Satoru Kawai. 1989. An Algorithm for Drawing General Undirected Graphs.Inf. Process. Lett.31, 1 (1989), 7–15. doi:10.1016/0020- 0190(89)90102-6
-
[30]
Hyunmo Kang, Catherine Plaisant, Bongshin Lee, and Benjamin B. Bederson. 2006. NetLens: Iterative Exploration of Content-Actor Network Data. In1st IEEE Symposium On Visual Analytics Science And Technology, IEEE V AST 2006, Baltimore, MD, USA, October 31 - November 2, 2006, Pak Chung Wong and Daniel A. Keim (Eds.). IEEE Computer Society, 91–98. doi:10.1109...
- [31]
-
[32]
Walter Kintsch and Teun A Van Dijk. 1978. Toward a model of text comprehension and production.Psychological review85, 5 (1978), 363
1978
-
[33]
Yao-Ting Sung Kuo-En Chang and Ine-Dai Chen. 2002. The Effect of Concept Mapping to Enhance Text Comprehension and Summarization.The Journal of Experimental Education71, 1 (2002), 5–23. doi:10.1080/00220970209602054
-
[34]
Haotian Li, Yong Wang, Songheng Zhang, Yangqiu Song, and Huamin Qu. 2022. KG4Vis: A Knowledge Graph-Based Approach for Visualization Recommendation.IEEE Transactions on Visualization and Computer Graphics28, 1 (2022), 195–205. doi:10.1109/TVCG.2021.3114863
-
[35]
Wei Li, Xinyan Xiao, Jiachen Liu, Hua Wu, Haifeng Wang, and Junping Du. 2020. Leveraging Graph to Improve Abstractive Multi-Document Summarization. InProceedings of the 58th Annual Meeting of the Association for Computational Linguistics, ACL 2020, Online, July 5-10, 2020. Association for Computational Linguistics, 6232–6243. doi:10.18653/V1/2020.ACL-MAIN.555
-
[36]
WILLIAM C. MANN and SANDRA A. THOMPSON. 1988. Rhetorical Structure Theory: Toward a functional theory of text organization.Text - Interdisciplinary Journal for the Study of Discourse8, 3 (1988), 243–281. doi:doi:10.1515/text.1.1988.8.3.243
-
[37]
Danielle S McNamara and Walter Kintsch. 1996. Learning from texts: Effects of prior knowledge and text coherence.Discourse processes22, 3 (1996), 247–288
1996
-
[38]
Mindjet. 1999. MindManager – Intuitive Visualization Tools. Website. https://www.mindmanager.com/
1999
-
[39]
Jaume Nualart Vilaplana, Mario Pérez-Montoro, and Mitchell Whitelaw. 2014. How we draw texts: A review of approaches to text visualization and exploration.El Profesional de la Informacion23 (05 2014), 221–235. doi:10.3145/epi.2014.may.02
-
[40]
Daniela Oelke and Iryna Gurevych. 2014. A study on human-generated tag structures to inform tag cloud layout. InInternational Working Conference on Advanced Visual Interfaces, A VI 2014, Como, Italy, May 27-29, 2014. ACM, 297–304. doi:10.1145/2598153.2598155
-
[41]
OpenAI. 2024. GPT-4o System Card.arXiv preprint arXiv: 2410.21276(2024)
work page internal anchor Pith review Pith/arXiv arXiv 2024
-
[42]
Zhou, Yangqiu Song, Weihong Qian, Fei Wang, and Shixia Liu
Shimei Pan, Michelle X. Zhou, Yangqiu Song, Weihong Qian, Fei Wang, and Shixia Liu. 2013. Optimizing temporal topic segmentation for intelligent text visualization. In18th International Conference on Intelligent User Interfaces, IUI 2013, Santa Monica, CA, USA, March 19-22, 2013. ACM, 339–350. doi:10.1145/2449396.2449441
-
[43]
Fernando Vieira Paulovich and Rosane Minghim. 2008. HiPP: A Novel Hierarchical Point Placement Strategy and its Application to the Exploration of Document Collections.IEEE Trans. Vis. Comput. Graph.14, 6 (2008), 1229–1236. doi:10.1109/TVCG.2008.138
-
[44]
Teresa Schurer, Bertram Opitz, and Torsten Schubert. 2020. Working Memory Capacity but Not Prior Knowledge Impact on Readers’ Attention and Text Comprehension.Frontiers in Education5 (03 2020). doi:10.3389/feduc.2020.00026
-
[45]
Zohreh Sharafi, Alessandro Marchetto, Angelo Susi, Giuliano Antoniol, and Yann-Gaël Guéhéneuc. 2013. An empirical study on the efficiency of graphical vs. textual representations in requirements comprehension. In2013 21st International Conference on Program Comprehension (ICPC). IEEE, Manuscript submitted to ACM 26 Qian et al. 33–42
2013
-
[46]
Aaron Springer and Steve Whittaker. 2019. Progressive disclosure: empirically motivated approaches to designing effective transparency. In Proceedings of the 24th international conference on intelligent user interfaces. 107–120
2019
-
[47]
Stasko, Carsten Görg, Zhicheng Liu, and Kanupriya Singhal
John T. Stasko, Carsten Görg, Zhicheng Liu, and Kanupriya Singhal. 2007. Jigsaw: Supporting Investigative Analysis through Interactive Visualization. In2nd IEEE Symposium on Visual Analytics Science and Technology, IEEE V AST 2007, Sacramento, CA,USA, October 30 - November 1, 2007. IEEE Computer Society, 131–138. doi:10.1109/VAST.2007.4389006
-
[48]
Florian Stoffel, Wolfgang Jentner, Michael Behrisch, Johannes Fuchs, and Daniel A. Keim. 2017. Interactive Ambiguity Resolution of Named Entities in Fictional Literature.Comput. Graph. Forum36, 3 (2017), 189–200. doi:10.1111/CGF.13179
-
[49]
Seifert, Priti Shah, and Eytan Adar
Hariharan Subramonyam, Colleen M. Seifert, Priti Shah, and Eytan Adar. 2020. texSketch: Active Diagramming through Pen-and-Ink Annotations. InCHI ’20: CHI Conference on Human Factors in Computing Systems, Honolulu, HI, USA, April 25-30, 2020, Regina Bernhaupt, Florian ’Floyd’ Mueller, David Verweij, Josh Andres, Joanna McGrenere, Andy Cockburn, Ignacio Av...
-
[50]
Kozo Sugiyama and Kazuo Misue. 1991. Visualization of structural information: automatic drawing of compound digraphs.IEEE Trans. Syst. Man Cybern.21, 4 (1991), 876–892. doi:10.1109/21.108304
-
[52]
Kozo Sugiyama and Kazuo Misue. 1995. A Generic Compound Graph Visualizer/Manipulator: D-ABDUCTOR. InGraph Drawing, Symposium on Graph Drawing, GD ’95, Passau, Germany, September 20-22, 1995, Proceedings (Lecture Notes in Computer Science, Vol. 1027), Franz-Josef Brandenburg (Ed.). 500–503. doi:10.1007/BFB0021834
-
[53]
Kozo Sugiyama, Shojiro Tagawa, and Mitsuhiko Toda. 1981. Methods for visual understanding of hierarchical system structures.IEEE Transactions on Systems, Man, and Cybernetics11, 2 (1981), 109–125
1981
-
[54]
Ashley Suh, Mustafa Hajij, Bei Wang, Carlos Scheidegger, and Paul Rosen. 2020. Persistent Homology Guided Force-Directed Graph Layouts.IEEE Trans. Vis. Comput. Graph.26, 1 (2020), 697–707. doi:10.1109/TVCG.2019.2934802
-
[55]
Sangho Suh, Bryan Min, Srishti Palani, and Haijun Xia. 2023. Sensecape: Enabling Multilevel Exploration and Sensemaking with Large Language Models. InProceedings of the 36th Annual ACM Symposium on User Interface Software and Technology, UIST 2023, San Francisco, CA, USA, 29 October 2023- 1 November 2023. 1:1–1:18. doi:10.1145/3586183.3606756
-
[56]
Guodao Sun, Yingcai Wu, Shixia Liu, Tai-Quan Peng, Jonathan J. H. Zhu, and Ronghua Liang. 2014. EvoRiver: Visual Analysis of Topic Coopetition on Social Media.IEEE Trans. Vis. Comput. Graph.20, 12 (2014), 1753–1762. doi:10.1109/TVCG.2014.2346919
-
[57]
Danielle Albers Szafir, D. Stuffer, Y. Sohail, and Michael Gleicher. 2016. TextDNA: Visualizing Word Usage with Configurable Colorfields.Comput. Graph. Forum35, 3 (2016), 421–430. doi:10.1111/CGF.12918
-
[58]
Craig S. Tashman and W. Keith Edwards. 2011. LiquidText: a flexible, multitouch environment to support active reading. InProceedings of the International Conference on Human Factors in Computing Systems, CHI 2011, Vancouver, BC, Canada, May 7-12, 2011, Desney S. Tan, Saleema Amershi, Bo Begole, Wendy A. Kellogg, and Manas Tungare (Eds.). ACM, 3285–3294. d...
-
[59]
Frank van Ham, Martin Wattenberg, and Fernanda B. Viégas. 2009. Mapping Text with Phrase Nets.IEEE Trans. Vis. Comput. Graph.15, 6 (2009), 1169–1176. doi:10.1109/TVCG.2009.165
-
[60]
Xingbo Wang, Renfei Huang, Zhihua Jin, Tianqing Fang, and Huamin Qu. 2024. CommonsenseVIS: Visualizing and Understanding Commonsense Reasoning Capabilities of Natural Language Models.IEEE Transactions on Visualization and Computer Graphics30, 1 (2024), 273–283. doi:10.1109/ TVCG.2023.3327153
-
[61]
Martin Wattenberg and Fernanda B. Viégas. 2008. The Word Tree, an Interactive Visual Concordance.IEEE Trans. Vis. Comput. Graph.14, 6 (2008), 1221–1228. doi:10.1109/TVCG.2008.172
-
[62]
Krist Wongsuphasawat and David Gotz. 2012. Exploring Flow, Factors, and Outcomes of Temporal Event Sequences with the Outflow Visualization. IEEE Trans. Vis. Comput. Graph.18, 12 (2012), 2659–2668. doi:10.1109/TVCG.2012.225
-
[63]
William Wright, David Schroh, Pascale Proulx, Alex Skaburskis, and Brian Cort. 2006. The Sandbox for analysis: concepts and methods. InProceedings of the SIGCHI conference on Human Factors in computing systems. 801–810
2006
-
[64]
Yingcai Wu, Shixia Liu, Kai Yan, Mengchen Liu, and Fangzhao Wu. 2014. OpinionFlow: Visual Analysis of Opinion Diffusion on Social Media.IEEE Trans. Vis. Comput. Graph.20, 12 (2014), 1763–1772. doi:10.1109/TVCG.2014.2346920
-
[65]
Youfu Yan, Yu Hou, Yongkang Xiao, Rui Zhang, and Qianwen Wang. 2025. KNowNEt:Guided Health Information Seeking from LLMs via Knowledge Graph Integration.IEEE Transactions on Visualization and Computer Graphics31, 1 (2025), 547–557. doi:10.1109/TVCG.2024.3456364 Received 20 February 2007; revised 12 March 2009; accepted 5 June 2009 Manuscript submitted to ACM
discussion (0)
Sign in with ORCID, Apple, or X to comment. Anyone can read and Pith papers without signing in.