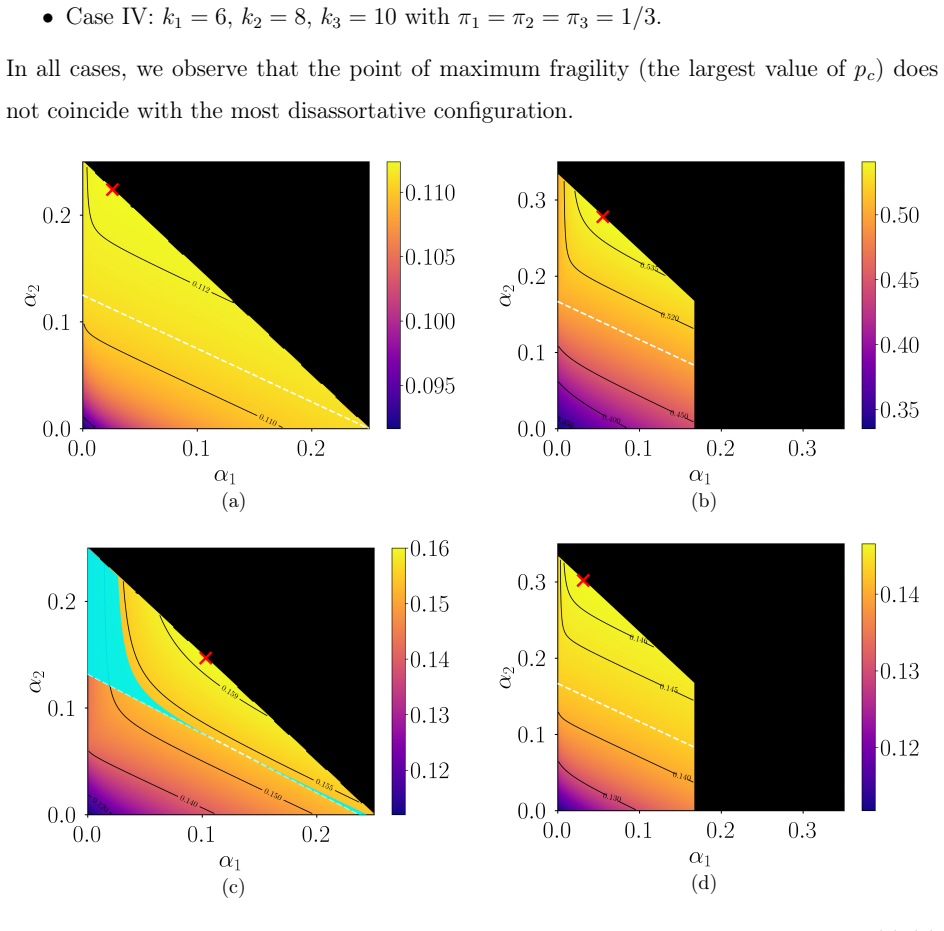
Recognition: unknown
Nonmonotonic percolation threshold in correlated networks and hypergraphs
Pith reviewed 2026-05-10 11:50 UTC · model grok-4.3
The pith
Moderately disassortative networks can be more fragile to random failures than either strongly disassortative or uncorrelated ones.
A machine-rendered reading of the paper's core claim, the machinery that carries it, and where it could break.
Core claim
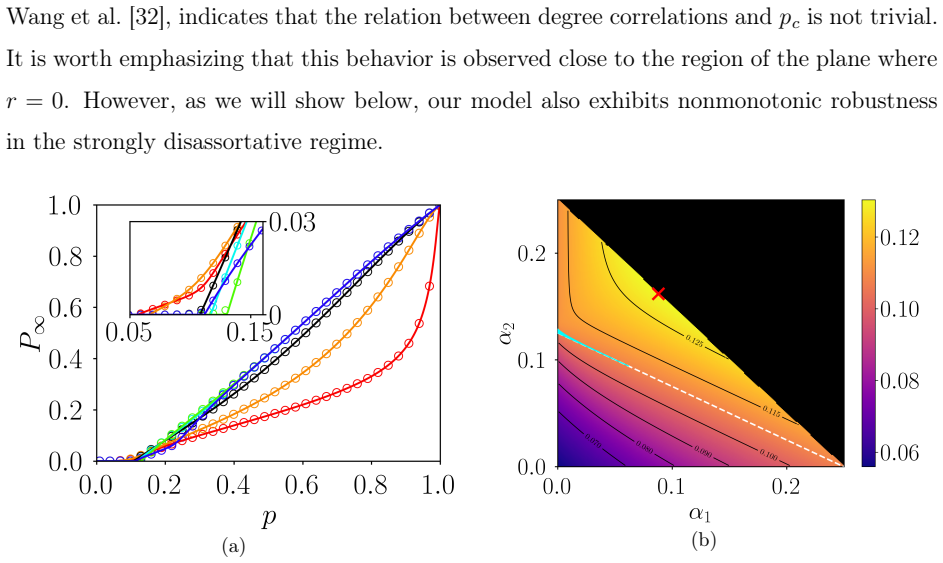
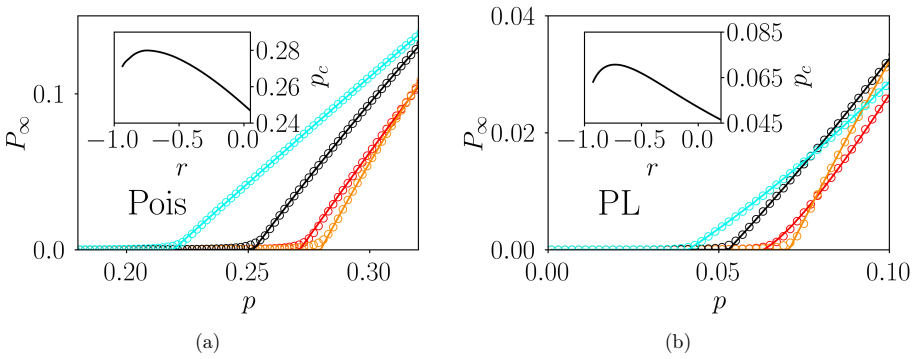
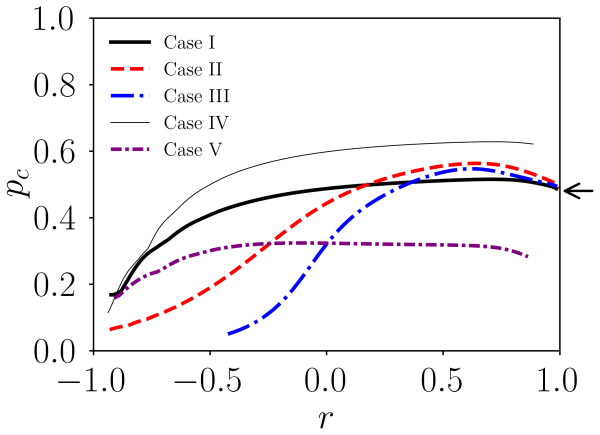
Using the generating function technique and stochastic simulations on configuration-model networks, the authors establish that the percolation threshold pc is a non-monotonic function of the Pearson assortativity coefficient r. Moderately disassortative networks can exhibit larger pc than either uncorrelated networks or strongly disassortative ones. This nonmonotonicity is observed for trimodal degree distributions as well as Poisson and power-law cases. For hypergraphs with correlations between node hyperdegree and hyperedge cardinality, positively correlated hypergraphs are more fragile than negatively correlated ones, and the relationship between r and pc remains nonmonotonic such that an
What carries the argument
Generating function formalism on configuration models with enforced degree sequences and pairwise correlations parameterized by the assortativity coefficient r.
Load-bearing premise
The configuration model procedure that enforces exact degree sequences and pairwise correlations is sufficient to determine percolation behavior, without higher-order structural effects altering the threshold.
What would settle it
An exact calculation or set of Monte Carlo simulations on a fixed trimodal degree sequence at r = 0, an intermediate negative r, and r near -1, checking whether pc peaks at the intermediate value.
Figures


read the original abstract
We study the effect of assortative and disassortative mixing on the robustness of networks under random node failures. For ordinary (dyadic) networks, by using the generating function technique and stochastic simulations, we show that the relationship between the Pearson assortativity coefficient $r$ and the percolation threshold $p_c$ is not always monotonic. More specifically, in certain regions of the parameter space of our model, moderately disassortative networks can be more fragile than either strongly disassortative or uncorrelated networks. We observe this nonmonotonic behavior for trimodal networks as well as for networks with Poisson and power-law degree distributions. We then extend our analysis to hypergraphs with correlations between node hyperdegree and hyperedge cardinality. For this case, we find that positively correlated hypergraphs tend to be more fragile than negatively correlated ones. Additionally, as in the dyadic case, the relationship between $r$ and $p_c$ is nonmonotonic, and the most fragile configuration does not correspond to the most assortative hypergraph.
Editorial analysis
A structured set of objections, weighed in public.
Referee Report
Summary. The manuscript uses generating-function analysis and stochastic simulations to examine how degree correlations affect the percolation threshold pc under random node removal in networks. It reports that pc is a non-monotonic function of the Pearson assortativity coefficient r for trimodal, Poisson, and power-law degree distributions, with moderately disassortative networks sometimes more fragile than either strongly disassortative or uncorrelated ones. The analysis is extended to hypergraphs with correlations between node hyperdegree and hyperedge cardinality, where positive correlations increase fragility and pc(r) again exhibits nonmonotonicity.
Significance. If the central claim holds, the result is significant because it shows that the intuitive expectation of monotonic dependence of robustness on assortativity does not always apply, with implications for the design and analysis of resilient networked systems. The analytic generating-function approach is cross-validated against simulations on multiple degree distributions, which is a methodological strength. The hypergraph extension broadens the scope beyond ordinary graphs.
major comments (3)
- [Model construction and correlation enforcement] The configuration-model-like procedure that enforces exact degree sequences and pairwise correlations (described in the model-construction section) may systematically induce higher-order structural features such as excess clustering or non-trivial conditional degree distributions beyond nearest neighbors. The generating-function closure assumes these effects are negligible, yet the paper provides no quantitative check (e.g., measured clustering coefficient or second-neighbor degree correlations) in the parameter windows where nonmonotonic pc(r) appears. Because both the analytic pc and the simulations are performed on the same ensembles, agreement between them does not rule out a shared artifact; this issue is load-bearing for the claim that the nonmonotonicity arises purely from the prescribed pairwise correlations.
- [Results for Poisson and power-law degree distributions] For the Poisson and power-law cases, the manuscript states that nonmonotonicity occurs “in certain regions of the parameter space,” but does not specify the ranges of mean degree, variance, or correlation strength at which the minimum in pc(r) is observed, nor does it report simulation error bars or the number of realizations. Without these details it is difficult to assess whether the reported nonmonotonicity is statistically robust or sensitive to finite-size effects.
- [Hypergraph analysis] In the hypergraph extension, the same configuration-model construction is used to impose correlations between hyperdegree and hyperedge cardinality. The manuscript should similarly verify that higher-order hypergraph motifs (e.g., overlapping hyperedges or degree-dependent local densities) remain negligible in the regimes where nonmonotonic pc(r) and the positive-correlation fragility effect are reported.
minor comments (3)
- [Abstract] The abstract would benefit from a single sentence indicating the specific degree distributions and the qualitative location of the nonmonotonic regime (e.g., “for moderate negative r in trimodal networks with mean degree 3”).
- [Figures and simulation details] All simulation figures should include error bars or state the number of independent realizations used; the current presentation leaves the statistical reliability of the curves unclear.
- [Hypergraph notation] Notation for the assortativity coefficient r in the hypergraph setting should be explicitly defined, as the standard Pearson formula for dyadic networks does not directly carry over.
Simulated Author's Rebuttal
We thank the referee for the careful reading and constructive comments on our manuscript. We address each major comment point by point below and indicate the revisions we will make.
read point-by-point responses
-
Referee: [Model construction and correlation enforcement] The configuration-model-like procedure that enforces exact degree sequences and pairwise correlations (described in the model-construction section) may systematically induce higher-order structural features such as excess clustering or non-trivial conditional degree distributions beyond nearest neighbors. The generating-function closure assumes these effects are negligible, yet the paper provides no quantitative check (e.g., measured clustering coefficient or second-neighbor degree correlations) in the parameter windows where nonmonotonic pc(r) appears. Because both the analytic pc and the simulations are performed on the same ensembles, agreement between them does not rule out a shared artifact; this issue is load-bearing for the claim that the nonmonotonicity arises purely from the prescribed pairwise correlations.
Authors: We thank the referee for this important observation. The configuration model with fixed degrees and pairwise correlations is constructed to suppress uncontrolled higher-order features, and the generating-function equations close exactly on the prescribed joint degree distribution. Nevertheless, we agree that explicit verification is warranted. In the revised manuscript we will add quantitative checks—specifically the global clustering coefficient and the average degree correlation between second neighbors—computed directly on the generated ensembles in the parameter windows where nonmonotonic pc(r) is reported. These additional diagnostics will confirm that any residual higher-order structure remains small and does not account for the observed nonmonotonicity. revision: yes
-
Referee: [Results for Poisson and power-law degree distributions] For the Poisson and power-law cases, the manuscript states that nonmonotonicity occurs “in certain regions of the parameter space,” but does not specify the ranges of mean degree, variance, or correlation strength at which the minimum in pc(r) is observed, nor does it report simulation error bars or the number of realizations. Without these details it is difficult to assess whether the reported nonmonotonicity is statistically robust or sensitive to finite-size effects.
Authors: We agree that the lack of explicit parameter ranges and statistical details limits the reader’s ability to evaluate robustness. In the revised manuscript we will (i) state the precise intervals of mean degree, degree variance, and assortativity coefficient r over which the minimum in pc(r) appears for both the Poisson and power-law families, (ii) include error bars obtained from the stochastic simulations, and (iii) report the number of independent realizations used for each data point. These additions will make the statistical reliability of the nonmonotonicity transparent. revision: yes
-
Referee: [Hypergraph analysis] In the hypergraph extension, the same configuration-model construction is used to impose correlations between hyperdegree and hyperedge cardinality. The manuscript should similarly verify that higher-order hypergraph motifs (e.g., overlapping hyperedges or degree-dependent local densities) remain negligible in the regimes where nonmonotonic pc(r) and the positive-correlation fragility effect are reported.
Authors: We accept the referee’s parallel concern for the hypergraph setting. In the revision we will extend the same style of diagnostic analysis to the hypergraph ensembles: we will measure the frequency of overlapping hyperedges and any systematic dependence of local hyperedge density on node hyperdegree, restricting the checks to the correlation strengths and hyperdegree distributions where nonmonotonic pc(r) and the positive-correlation fragility are observed. These results will be reported alongside the existing hypergraph percolation curves. revision: yes
Circularity Check
Derivation self-contained with no reduction to inputs by construction
full rationale
The paper derives the percolation threshold pc via the standard generating-function closure applied to an explicit configuration-model ensemble whose degree correlations are controlled by free parameters; the assortativity coefficient r is computed directly from those same parameters. Varying the correlation parameters and solving the resulting equations produces the reported nonmonotonic pc(r) curve. This is an ordinary forward calculation, not a fit, not a renaming of a known result, and not dependent on any self-citation chain for its central claim. Stochastic simulations on the identical ensembles serve as an independent numerical check rather than a circular confirmation. No step equates pc to r by definition or imports a uniqueness theorem from prior work by the same authors.
Axiom & Free-Parameter Ledger
free parameters (1)
- assortativity strength parameter
axioms (2)
- domain assumption The network is generated according to a configuration model with prescribed degree sequence and pairwise degree correlations.
- domain assumption The generating-function equations close at the level of the degree distribution and the assortativity coefficient without requiring higher-order motif corrections.
Reference graph
Works this paper leans on
-
[1]
Albert and A.-L
R. Albert and A.-L. Barabási, Rev. Mod. Phys.74, 47 (2002)
2002
-
[2]
Barabási and R
A.-L. Barabási and R. Albert, Science286, 509 (1999)
1999
-
[3]
Boccaletti, V
S. Boccaletti, V. Latora, Y. Moreno, M. Chavez, and D.-U. Hwang, Phys. Rep.424, 175 (2006)
2006
-
[4]
Artime, M
O. Artime, M. Grassia, M. De Domenico, J. P. Gleeson, H. A. Makse, G. Mangioni, M. Perc, and F. Radicchi, Nat. Rev. Phys.6, 114 (2024)
2024
-
[5]
A. F. Al Musawi, S. Roy, and P. Ghosh, Sci. Rep.13, 18208 (2023)
2023
-
[6]
Hasegawa, K
T. Hasegawa, K. Konno, and K. Nemoto, Eur. Phys. J. B85, 262 (2012). 32 (a) (b) (c) (d) FIG. 10. Heatmap of the critical percolation thresholdp c in theα 1–α2 plane. Panels (a)-(d) correspond to Cases I-IV described in the text, respectively. Each cross indicates the point of maximum fragility (largest value ofpc), which occurs at an intermediate positive...
2012
-
[7]
S. L. Chang, M. Piraveenan, and M. Prokopenko, Chaos, solitons & fractals140, 110143 (2020)
2020
-
[8]
P. Li, K. Zhang, X. Xu, J. Zhang, and M. Small, Phys. Rev. E87, 042803 (2013)
2013
-
[9]
M. Roy, S. Poria, and C. Hens, Phys. Rev. E103, 062307 (2021)
2021
-
[10]
C. E. La Rocca, L. A. Braunstein, and P. A. Macri, Physica A390, 2840 (2011)
2011
-
[11]
Sun, S.-J
J.-T. Sun, S.-J. Wang, Z.-G. Huang, and Y.-H. Wang, Physica A388, 3244 (2009). 33 (a) (b) FIG. 11. Panel (a): In the main panel, we plotP∞ as a function ofpfor hypergraphs in which P(k)andQ(m)follow a truncated Poisson distributionPois(4,1,20). Solid lines correspond to the theoretical solution of Eq. (30), while symbols represent stochastic simulations f...
2009
-
[12]
Newman, A.-L
M. Newman, A.-L. Barabási, and D. J. Watts,The structure and dynamics of networks (Princeton University Press, Princeton, NJ, USA, 2011)
2011
-
[13]
M. A. Serrano, M. Boguná, R. Pastor-Satorras, and A. Vespignani, inLarge Scale Structure and Dynamics of Complex Networks: From Information Technology to Finance and Natural Sciences(World Scientific, Singapore, 2007) pp. 35–66
2007
-
[14]
M. E. J. Newman, Phys. Rev. Lett.89, 208701 (2002)
2002
-
[15]
M. E. J. Newman, Phys. Rev. E67, 026126 (2003)
2003
-
[16]
A. V. Goltsev, S. N. Dorogovtsev, and J. F. Mendes, Phys. Rev. E78, 051105 (2008)
2008
-
[17]
Dorogovtsev, A
S. Dorogovtsev, A. Ferreira, A. Goltsev, and J. Mendes, Phys. Rev. E81, 031135 (2010)
2010
-
[18]
Hao and C
D. Hao and C. Li, PLoS ONE6, e28322 (2011)
2011
-
[19]
Mussmann, J
S. Mussmann, J. Moore, J. Pfeiffer, and J. Neville, inProceedings of the AAAI Conference on Artificial Intelligence, Vol. 29 (2015). 34
2015
- [20]
-
[21]
C. R. Sampson, J. G. Restrepo, and M. A. Porter, Phys. Rev. E112, 024303 (2025)
2025
-
[22]
N. W. Landry and J. G. Restrepo, Chaos32(2022)
2022
-
[23]
G.-G. Ha, I. Neri, and A. Annibale, J. Phys.: Complex.6, 045006 (2025)
2025
-
[24]
G. F. de Arruda, G. Petri, and Y. Moreno, Phys. Rev. Research2, 023032 (2020)
2020
-
[25]
E. V. Konstantinova and V. A. Skorobogatov, Discrete Math.235, 365 (2001)
2001
-
[26]
Zhang, L
H. Zhang, L. Song, Y. Li, and G. Y. Li, IEEE Commun. Mag.55, 70 (2017)
2017
-
[27]
Bretto,Hypergraph Theory: An Introduction(Springer, Cham, Switzerland, 2013)
A. Bretto,Hypergraph Theory: An Introduction(Springer, Cham, Switzerland, 2013)
2013
- [28]
-
[29]
J. D. Noh, Phys. Rev. E76, 026116 (2007)
2007
-
[30]
L. D. Valdez, C. Buono, L. A. Braunstein, and P. A. Macri, EPL96, 38001 (2011)
2011
-
[31]
Mizutaka and T
S. Mizutaka and T. Tanizawa, Phys. Rev. E94, 022308 (2016)
2016
-
[32]
Y. Wang, J. Ma, and J. Cao, Physica D433, 133183 (2022)
2022
-
[33]
Molloy and B
M. Molloy and B. Reed, Random Struct. Algorithms6, 161 (1995)
1995
-
[34]
Stauffer and A
D. Stauffer and A. Aharony,Introduction to percolation theory(Taylor & Francis, London, UK, 2018)
2018
-
[35]
M. E. J. Newman, S. H. Strogatz, and D. J. Watts, Phys. Rev. E64, 026118 (2001)
2001
-
[36]
Li, R.-R
M. Li, R.-R. Liu, L. Lü, M.-B. Hu, S. Xu, and Y.-C. Zhang, Phys. Rep.907, 1 (2021)
2021
-
[37]
D. S. Callaway, M. E. Newman, S. H. Strogatz, and D. J. Watts, Phys. Rev. Lett.85, 5468 (2000)
2000
-
[38]
Vázquez and Y
A. Vázquez and Y. Moreno, Phys. Rev. E67, 015101 (2003)
2003
-
[39]
Van Mieghem, X
P. Van Mieghem, X. Ge, P. Schumm, S. Trajanovski, and H. Wang, Phys. Rev. E82, 056113 (2010)
2010
-
[40]
Z. Jing, T. Lin, Y. Hong, L. Jian-Hua, C. Zhi-Wei, and L. Yi-Xue, Chin. Phys.16, 3571 (2007)
2007
-
[41]
Bastian, S
M. Bastian, S. Heymann, and M. Jacomy, inProceedings of the international AAAI conference on web and social media, Vol. 3 (2009) pp. 361–362
2009
-
[42]
Lomax and P
N. Lomax and P. Norman, Prof. Geogr.68, 451 (2016)
2016
-
[43]
Norman,Putting iterative proportional fitting on the researcher’s desk, Tech
P. Norman,Putting iterative proportional fitting on the researcher’s desk, Tech. Rep. (Univer- sity of Leeds, Leeds, UK, 1999). 35
1999
-
[44]
Zhang and M
J. Zhang and M. Shields, Int. J. Approx. Reason.122, 24 (2020)
2020
-
[45]
Geenens, Depend
G. Geenens, Depend. Model.8, 417 (2020)
2020
-
[46]
Raschke, M
M. Raschke, M. Schläpfer, and K. Trantopoulos, J. Stat. Mech.2014, P02019 (2014)
2014
-
[47]
Battiston, E
F. Battiston, E. Amico, A. Barrat, G. Bianconi, G. Ferraz de Arruda, B. Franceschiello, I. Iacopini, S. Kéfi, V. Latora, Y. Moreno,et al., Nat. Phys.17, 1093 (2021)
2021
-
[48]
Bianconi and S
G. Bianconi and S. N. Dorogovtsev, Phys. Rev. E109, 014306 (2024)
2024
-
[49]
L. D. Valdez and C. E. La Rocca,https://github.com/LDVal/NonMonotonicCorr(2026)
2026
-
[50]
D. Yang, L. Pan, and T. Zhou, Chaos27(2017). 36
2017
discussion (0)
Sign in with ORCID, Apple, or X to comment. Anyone can read and Pith papers without signing in.