Recognition: 2 theorem links
· Lean TheoremPortfolio Optimization Proxies under Label Scarcity and Regime Shifts via Bayesian and Deterministic Students under Semi-Supervised Sandwich Training
Pith reviewed 2026-05-13 18:59 UTC · model grok-4.3
The pith
Neural student models match or outperform a CVaR teacher optimizer in portfolio construction when real labels are scarce and markets undergo regime shifts.
A machine-rendered reading of the paper's core claim, the machinery that carries it, and where it could break.
Core claim
The paper establishes that Bayesian and deterministic neural students, trained via semi-supervised sandwich training on a mixture of 104 real observations and synthetic returns generated by a factor-based model with t-copula residuals, can match or exceed the CVaR teacher's performance in controlled synthetic experiments, in-distribution real-market evaluation, and cross-universe generalization, while delivering improved robustness under regime shifts and reduced portfolio turnover.
What carries the argument
The semi-supervised sandwich training pipeline that lets a CVaR optimizer generate labels for neural student models trained on mixed real and synthetic market data.
If this is right
- Student models reach comparable or better risk-adjusted returns than the teacher in synthetic grid tests and real data deployments.
- Robustness to regime shifts increases because the synthetic augmentation supplies examples outside the limited real sample.
- Portfolio turnover falls, which reduces transaction costs during live deployment.
- The rolling fine-tuning protocol keeps the model stable while allowing limited adaptation to new observations.
- Hybrid optimization-learning methods become viable for settings where labeled examples are too few for direct supervised training.
Where Pith is reading between the lines
- Similar teacher-student augmentation may help other optimization tasks where simulation can cheaply expand scarce real observations.
- Lower turnover from the students suggests material cost savings in environments that rebalance frequently.
- Success in cross-universe tests implies the learned policies capture some market structures that transfer beyond the training assets.
- Replacing the t-copula generator with richer simulation engines could further improve generalization when real regimes differ sharply from historical patterns.
Load-bearing premise
The factor-based model with t-copula residuals generates synthetic data that accurately represents real market behavior, including during regime shifts.
What would settle it
If the student models produce consistently higher risk or lower returns than the CVaR teacher across multiple out-of-sample real-market periods that contain regime shifts, the central claim would not hold.
Figures


read the original abstract
This paper proposes a machine learning assisted portfolio optimization framework designed for low data environments and regime uncertainty. We construct a teacher student learning pipeline in which a Conditional Value at Risk (CVaR) optimizer generates supervisory labels, and neural models (Bayesian and deterministic) are trained using both real and synthetically augmented data. The synthetic data is generated using a factor based model with t copula residuals, enabling training beyond the limited real sample of 104 labeled observations. We evaluate four student models under a structured experimental framework comprising (i) controlled synthetic experiments (3 x 5 seed grid), (ii) in-distribution real market evaluation (C2A) and (iii) cross-universe generalization (D2A). In real-market settings, models are deployed using a rolling evaluation protocol where a frozen pretrained model is periodically fine tuned on recent observations and reset to its base state, ensuring stability while allowing limited adaptation. Results show that student models can match or outperform the CVaR teacher in several settings, while achieving improved robustness under regime shifts and reduced turnover. These findings suggest that hybrid optimization learning approaches can enhance portfolio construction in data constrained environments
Editorial analysis
A structured set of objections, weighed in public.
Referee Report
Summary. The manuscript presents a semi-supervised teacher-student framework for portfolio optimization under label scarcity. A CVaR optimizer serves as the teacher providing labels, while Bayesian and deterministic neural networks act as students trained on 104 real observations augmented by synthetic data generated from a factor-based model with t-copula residuals. The approach is tested in controlled synthetic settings, in-distribution real markets (C2A), and cross-universe generalization (D2A) using a rolling evaluation protocol with periodic fine-tuning. The central claim is that the student models can match or outperform the teacher in performance while offering improved robustness to regime shifts and reduced portfolio turnover.
Significance. If the results hold, the work demonstrates a viable hybrid approach to portfolio construction that leverages limited real data through synthetic augmentation and teacher supervision. This could be significant for practical applications in finance where data is scarce and markets exhibit regime changes, potentially leading to more stable and efficient optimization strategies. The use of both Bayesian and deterministic students adds to the methodological contribution in handling uncertainty.
major comments (3)
- [Synthetic data generation and experimental framework] The robustness claims under regime shifts in the D2A cross-universe setting rest on the assumption that synthetic data from the factor-based model with t-copula residuals faithfully reproduces real-market tail dependencies and regime-shift statistics. No quantitative validation (e.g., moment matching, tail quantile comparisons, or regime-detection tests) is described, which is load-bearing for the generalization results.
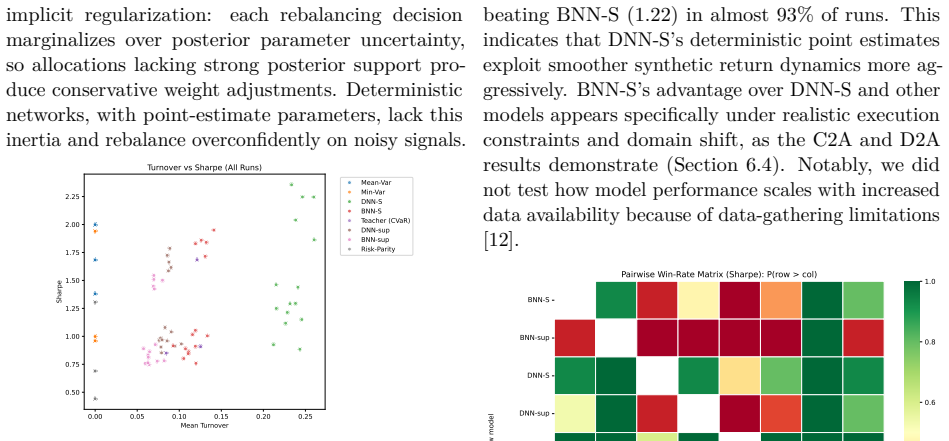
- [Results and evaluation protocol] The abstract and results sections report that student models match or outperform the CVaR teacher with improved robustness and reduced turnover, but lack specific metrics, statistical significance tests, error bars, or direct comparisons (e.g., Sharpe ratios or CVaR values) across the 3x5 seed grid and rolling evaluations, undermining assessment of the central performance claims.
- [Rolling evaluation protocol] In the rolling evaluation protocol, the interaction between the frozen pretrained model, periodic fine-tuning on recent observations, and reset to base state is not fully specified; this leaves open the possibility of lookahead bias or instability in the C2A and D2A real-market deployments.
minor comments (3)
- [Abstract] The abstract would benefit from including concrete quantitative results (e.g., average improvement percentages or turnover reductions) instead of qualitative statements.
- [Experimental framework] Clarify the exact definitions and differences between the C2A and D2A settings, including how cross-universe generalization is operationalized.
- [Model architecture and training details] Provide full hyperparameter specifications for the neural student models, the factor model, and t-copula to support reproducibility.
Simulated Author's Rebuttal
We thank the referee for their detailed and constructive feedback on our manuscript. We address each of the major comments below and will incorporate revisions to strengthen the paper.
read point-by-point responses
-
Referee: [Synthetic data generation and experimental framework] The robustness claims under regime shifts in the D2A cross-universe setting rest on the assumption that synthetic data from the factor-based model with t-copula residuals faithfully reproduces real-market tail dependencies and regime-shift statistics. No quantitative validation (e.g., moment matching, tail quantile comparisons, or regime-detection tests) is described, which is load-bearing for the generalization results.
Authors: We agree that explicit quantitative validation of the synthetic data generator is necessary to support the generalization claims in the D2A setting. In the revised manuscript, we will add a dedicated subsection detailing moment matching for means, variances, and correlations, comparisons of tail quantiles (e.g., 5% and 1% VaR), and regime-detection tests using statistical methods such as Markov-switching models on both real and synthetic data. This will provide evidence that the t-copula factor model captures the relevant tail dependencies and regime characteristics. revision: yes
-
Referee: [Results and evaluation protocol] The abstract and results sections report that student models match or outperform the CVaR teacher with improved robustness and reduced turnover, but lack specific metrics, statistical significance tests, error bars, or direct comparisons (e.g., Sharpe ratios or CVaR values) across the 3x5 seed grid and rolling evaluations, undermining assessment of the central performance claims.
Authors: We acknowledge that the current version presents aggregate claims without sufficient granular metrics. In the revision, we will expand the results section to include tables with specific performance metrics such as Sharpe ratios, CVaR values, turnover rates, and robustness measures (e.g., drawdown statistics) for each model across the 3x5 seed grid. We will also report statistical significance using paired t-tests or Wilcoxon tests with p-values, and include error bars representing standard deviations over the seeds and rolling windows. Direct comparisons to the teacher will be highlighted. revision: yes
-
Referee: [Rolling evaluation protocol] In the rolling evaluation protocol, the interaction between the frozen pretrained model, periodic fine-tuning on recent observations, and reset to base state is not fully specified; this leaves open the possibility of lookahead bias or instability in the C2A and D2A real-market deployments.
Authors: We appreciate the need for precise specification to rule out biases. In the revised manuscript, we will clarify the rolling protocol in detail: the pretrained model is frozen for inference on the next period, fine-tuning occurs only on data up to the current time (no future data), and resets to the base pretrained state occur at the start of each new regime or after a fixed number of periods to prevent drift. We will provide pseudocode and specify the exact fine-tuning frequency and data windows used in C2A and D2A to ensure no lookahead bias is present. revision: yes
Circularity Check
No significant circularity; derivation relies on external teacher and independent real-data evaluation
full rationale
The paper's pipeline uses an external CVaR optimizer to generate labels and a standard factor+t-copula model for data augmentation, then evaluates student models on held-out real-market rolling windows (C2A/D2A). No equation reduces a claimed prediction to a fitted parameter by construction, no self-citation is load-bearing for the central result, and the synthetic generator is not presented as a derived uniqueness theorem. The reported robustness and turnover improvements are therefore not forced by re-labeling the training inputs.
Axiom & Free-Parameter Ledger
free parameters (1)
- Parameters of the factor model and t-copula
axioms (1)
- domain assumption The t-copula factor model captures the joint distribution of asset returns sufficiently well for training purposes
Lean theorems connected to this paper
-
IndisputableMonolith/Cost/FunctionalEquation.leanwashburn_uniqueness_aczel unclearWe construct a teacher–student learning pipeline in which a Conditional Value at Risk (CVaR) optimizer generates supervisory labels, and neural models (Bayesian and deterministic) are trained using both real and synthetically augmented data. The synthetic data is generated using a factor-based model with t-copula residuals.
-
IndisputableMonolith/Foundation/ArrowOfTime.leanarrow_from_z unclearResults show that student models can match or outperform the CVaR teacher in several settings, while achieving improved robustness under regime shifts and reduced turnover.
Reference graph
Works this paper leans on
-
[1]
Markowitz, Portfolio selection, The Journal of Finance 7 (1) (1952) 77–91
H. Markowitz, Portfolio selection, The Journal of Finance 7 (1) (1952) 77–91
work page 1952
-
[2]
R. T. Rockafellar, S. Uryasev, Optimization of conditional value-at-risk, Journal of Risk 2 (3) (2000) 21–41
work page 2000
-
[3]
S. Gu, B. Kelly, D. Xiu, Empirical asset pricing via machine learning, The Review of Financial Studies 33 (5) (2020) 2223–2273.doi:10.1093/ rfs/hhaa009
work page 2020
- [4]
-
[5]
M. Bagnara, Asset pricing and machine learning: A critical review, Journal of Economic Surveys 38 (2024) 27–56.doi:10.1111/joes.12532
-
[6]
F. Feng, X. He, X. Wang, et al., Temporal re- lational ranking for stock prediction, in: ACM SIGIR, 2020
work page 2020
-
[7]
R.Sawhney, S.Agarwal, A.Wadhwa, etal., Stock selection via spatiotemporal hypergraph atten- tion network, in: AAAI Conference on Artificial Intelligence, 2021
work page 2021
-
[8]
A Deep Reinforcement Learning Framework for the Financial Portfolio Management Problem
Z. Jiang, D. Xu, J. Liang, Deep portfolio manage- ment: A deep reinforcement learning framework for the financial portfolio management problem, arXiv preprint arXiv:1706.10059 (2017). URLhttps://arxiv.org/abs/1706.10059
work page Pith review arXiv 2017
-
[9]
C. Blundell, J. Cornebise, K. Kavukcuoglu, D. Wierstra, Weight uncertainty in neural net- works, in: Proceedings of the 32nd International ConferenceonMachineLearning(ICML),PMLR, 2015, pp. 1613–1622. URLhttps://arxiv.org/abs/1505.05424
-
[10]
Y. Gal, Z. Ghahramani, Dropout as a bayesian approximation: Representing model uncertainty 26 in deep learning, in: Proceedings of the 33rd International Conference on Machine Learning (ICML), Vol. 48, PMLR, 2016, pp. 1050–1059. URLhttps://arxiv.org/abs/1506.02142
work page Pith review arXiv 2016
-
[11]
D. P. Kingma, M. Welling, Auto-encoding vari- ational bayes, arXiv preprint arXiv:1312.6114 (2013).doi:10.48550/arXiv.1312.6114. URLhttps://arxiv.org/abs/1312.6114
work page internal anchor Pith review Pith/arXiv arXiv doi:10.48550/arxiv.1312.6114 2013
-
[12]
P. Pareek, A. Jayakumar, K. Sundar, S. Misra, D. Deka, Optimization proxies using limited la- beled data and training time – a semi-supervised bayesian neural network approach, in: Proceed- ings of the 42nd International Conference on Machine Learning, Vol. 267 of Proceedings of Machine Learning Research, PMLR, 2025, pp. 47953–47970. URL https://proceedin...
work page 2025
-
[13]
W. F. Sharpe, Capital asset prices: A theory of market equilibrium under conditions of risk, The Journal of Finance 19 (3) (1964) 425–442
work page 1964
-
[14]
J. Lintner, The valuation of risk assets and the selection of risky investments in stock portfolios and capital budgets, The Review of Economics and Statistics 47 (1) (1965) 13–37
work page 1965
-
[15]
F.Black, R.Litterman, Globalportfoliooptimiza- tion, Financial Analysts Journal 48 (5) (1992) 28–43
work page 1992
-
[16]
E. F. Fama, K. R. French, Common risk factors in the returns on stocks and bonds, Journal of Financial Economics 33 (1) (1993) 3–56
work page 1993
-
[17]
E. F. Fama, K. R. French, A five-factor asset pricing model, Journal of Financial Economics 116 (1) (2015) 1–22
work page 2015
-
[18]
M. M. Carhart, On persistence in mutual fund performance, The Journal of Finance 52 (1) (1997) 57–82
work page 1997
-
[19]
S. K. Agarwalla, J. Jacob, J. R. Varma, Four fac- tor model in indian equities market, Working Pa- per 2013-09-05, Indian Institute of Management Ahmedabad, revised version of IIMA Working Paper No. 2013-09-05 (Sep. 2014)
work page 2013
- [20]
- [21]
- [22]
- [23]
- [24]
- [25]
-
[26]
J. Hoffmann, Y. Bar-Sinai, L. M. Lee, J. Andreje- vic, S. Mishra, S. M. Rubinstein, C. H. Rycroft, Machine learning in a data-limited regime: Aug- menting experiments with synthetic data uncov- ers order in crumpled sheets, Science Advances 5 (4) (2019) eaau6792. doi:10.1126/sciadv. aau6792. 27
-
[27]
A. J. Patton, A review of copula models for eco- nomic time series, Journal of Multivariate Analy- sis 110 (2012) 4–18.doi:10.1016/j.jmva.2012. 02.021
-
[28]
I. D. L. Salvatierra, A. J. Patton, Dynamic copula models and high frequency data, Tech. rep., Duke University (Aug. 2014). URL https://www.econ.duke.edu/~ap172/ research.html
work page 2014
-
[29]
D. H. Oh, A. J. Patton, Dynamic factor copula models with estimated cluster as- signments, Tech. Rep. 2021-029, Board of Governors of the Federal Reserve System (2021). doi:10.17016/FEDS.2021.029. URL https://www. federalreserve.gov/econres/feds/ dynamic-factor-copula-models-with-estimated-cluster-assignments. htm
-
[30]
Aroussi, yfinance: Download market data from yahoo! finance’s api (2019)
R. Aroussi, yfinance: Download market data from yahoo! finance’s api (2019). URL https://github.com/ranaroussi/ yfinance
work page 2019
-
[31]
C. E. Shannon, A mathematical theory of com- munication, Bell System Technical Journal 27 (3) (1948) 379–423. doi:10.1002/j.1538-7305. 1948.tb01338.x
-
[32]
S. S. Shapiro, M. B. Wilk, An analysis of variance test for normality (complete samples), Biometrika 52 (3/4) (1965) 591–611
work page 1965
-
[33]
C. M. Jarque, A. K. Bera, Efficient tests for nor- mality, homoscedasticity and serial independence of regression residuals, Economics Letters 6 (3) (1980) 255–259
work page 1980
-
[34]
T. W. Anderson, D. A. Darling, Asymptotic the- ory of certain "goodness of fit" criteria based on stochastic processes, The Annals of Mathemati- cal Statistics 23 (2) (1952) 193–212
work page 1952
-
[35]
A. N. Kolmogorov, Sulla determinazione em- pirica di una legge di distribuzione, Giornale dell’Istituto Italiano degli Attuari 4 (1933) 83– 91. 28
work page 1933
discussion (0)
Sign in with ORCID, Apple, or X to comment. Anyone can read and Pith papers without signing in.