Recognition: unknown
Who Saw It Coming? Historical Experience and the 2021 Inflation Forecast Failure
Pith reviewed 2026-05-10 11:19 UTC · model grok-4.3
The pith
The 2021 inflation forecast failure occurred because models drew most of their data from the low-volatility Great Moderation and underweighted earlier supply-shock periods.
A machine-rendered reading of the paper's core claim, the machinery that carries it, and where it could break.
Core claim
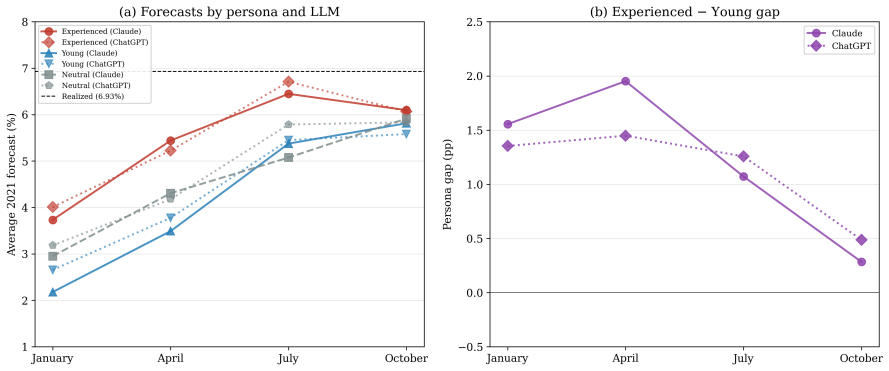
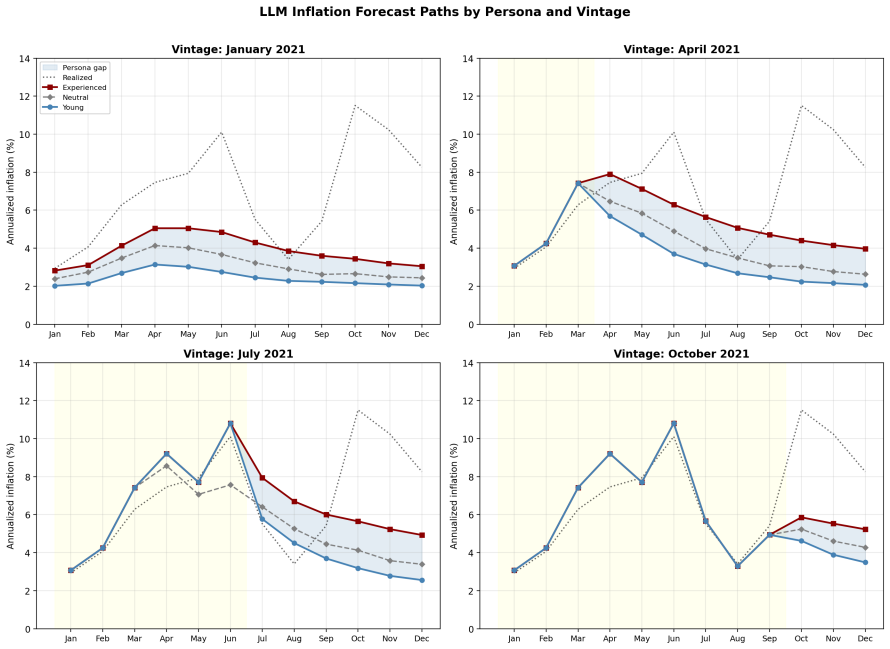
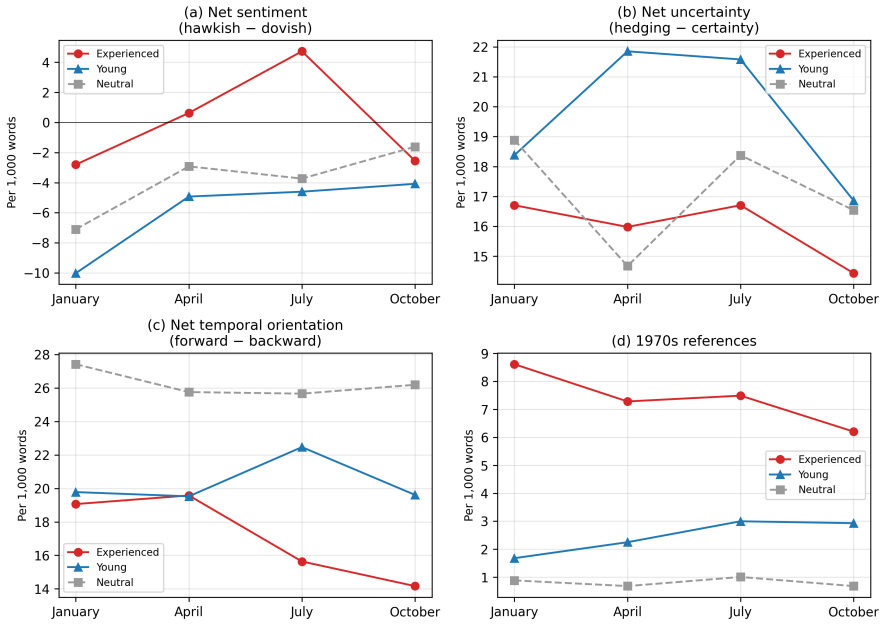
The central claim is that the source of the prior mattered more than model sophistication: estimation samples dominated by the Great Moderation under-represented supply-shock regimes, anchoring expectations to the prevailing low-inflation environment. Intercept corrections, similarity re-estimation on 1970s observations, and kernel-weighted estimators each reduced forecast errors substantially, with gains holding for eight additional U.S. price series. Household respondents over age 60, whose lifetimes include the 1970s, reported higher inflation expectations from early 2021 onward, while younger cohorts stayed anchored; language models given experienced versus young professional personas, (
What carries the argument
Sample-composition adjustment through historical similarity re-estimation, in which data from prior supply-shock regimes receives greater weight in forming current forecasts.
If this is right
- Forecasts that overweight recent low-volatility data will systematically lag when supply shocks reappear.
- Reweighting estimation samples toward historically similar high-inflation episodes improves accuracy without changing the model's functional form.
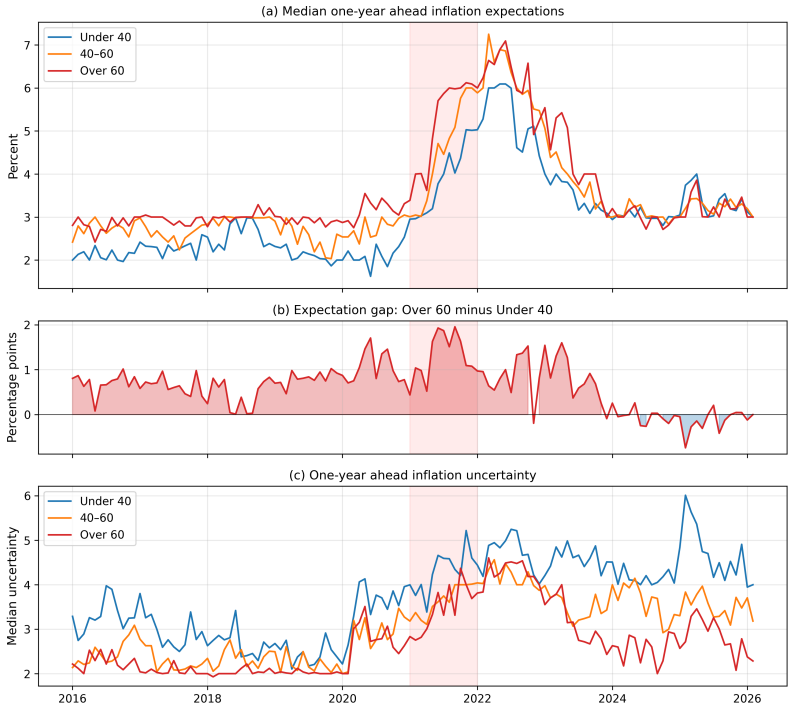
- Individuals whose lifetimes include prior supply-shock periods form higher inflation expectations sooner than those whose experience is limited to the Great Moderation.
- The same pattern of improved forecasts after historical adjustments appears across multiple price indices, not only headline CPI.
- Differences in experiential priors dominate differences in model complexity when explaining forecast misses during regime shifts.
Where Pith is reading between the lines
- Forecasting systems may need explicit regime-detection rules or permanent historical scenario libraries to reduce lag during transitions out of long stable periods.
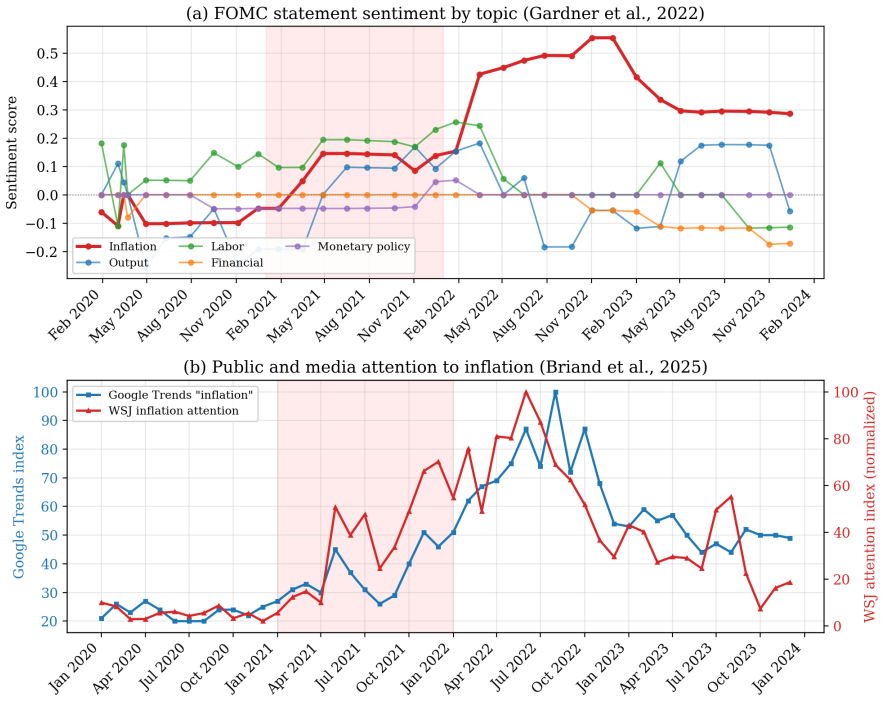
- Public discussion of historical parallels could accelerate the updating of private expectations when supply shocks occur.
- The same sample-composition problem could affect forecasts of other variables, such as output or unemployment, whenever recent data exclude earlier crisis regimes.
- Central banks might maintain parallel historical-analog models alongside standard ones to provide earlier signals during shifts in inflation drivers.
Load-bearing premise
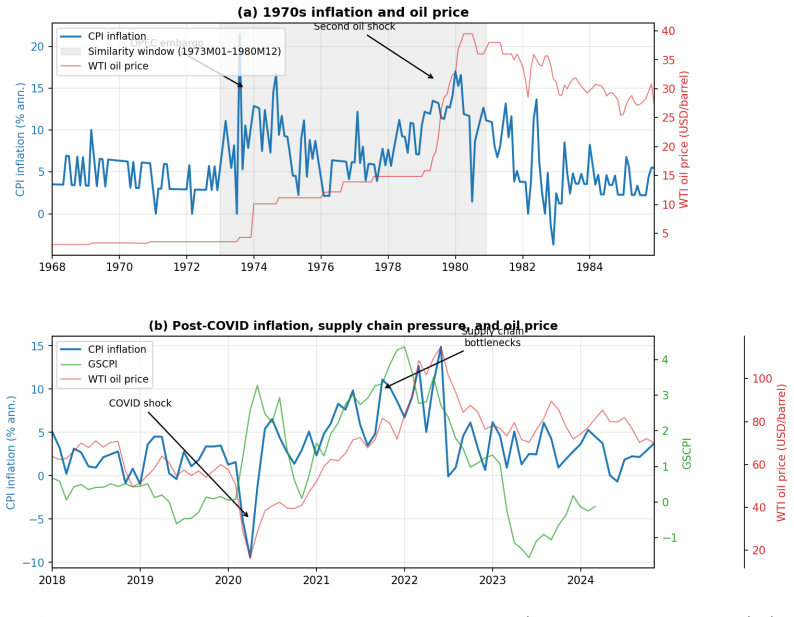
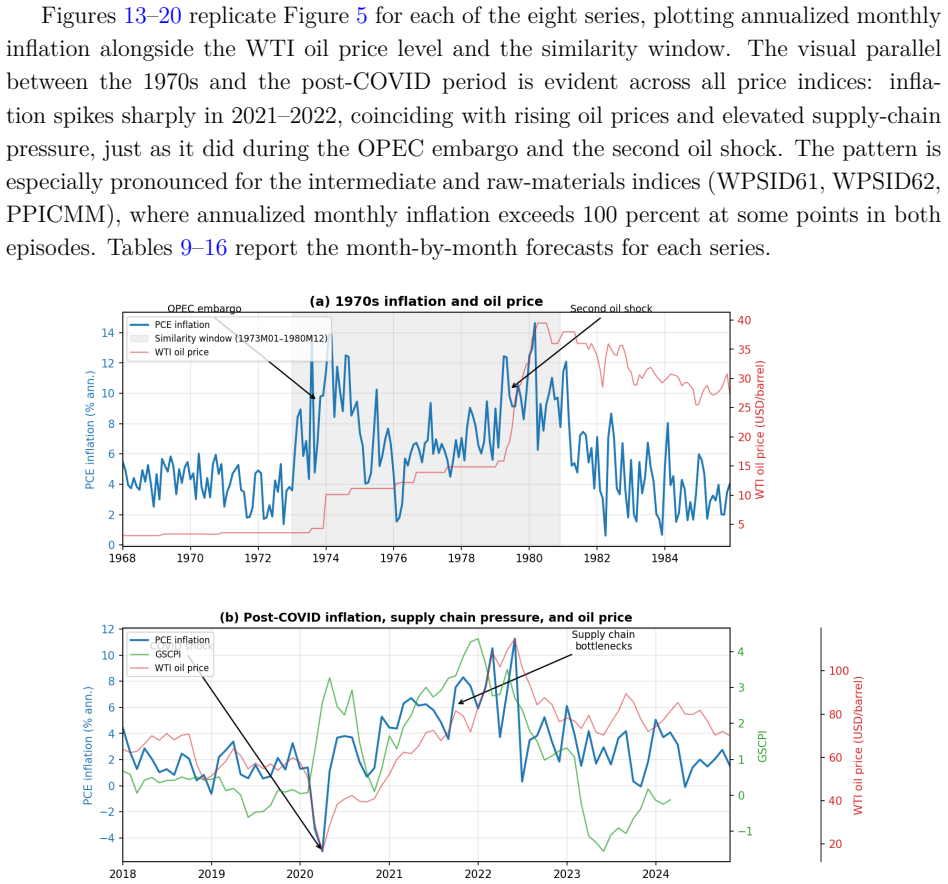
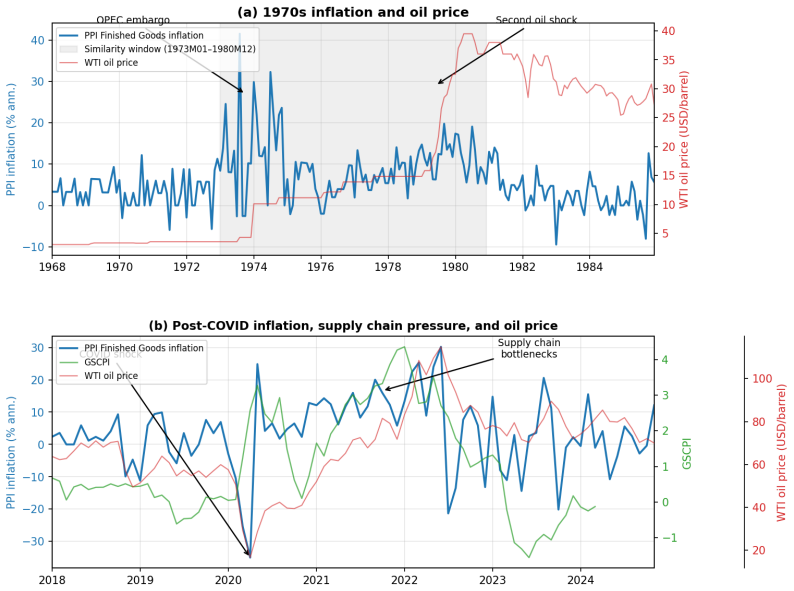
The 1970s supply shocks are similar enough to those in 2021 that reweighting toward that earlier period produces valid improvements in forecast accuracy.
What would settle it
If models re-estimated with equal or greater weight on 1970s data still produce forecast errors for 2021 inflation as large as those from standard recent-sample models, the sample-composition explanation would be falsified.
Figures


read the original abstract
This paper studies the 2021 U.S. inflation forecasting failure. I show that the failure was primarily driven by sample composition rather than functional-form misspecification: estimation samples dominated by the Great Moderation underweight supply-shock regimes, and expectations anchored to that regime were slow to recognize the shift. Three historically informed adjustments, an intercept correction, a similarity re-estimation on 1970s data, and a kernel-weighted estimator, substantially close the forecast gap, and the gains extend to eight additional U.S. price indices. Household survey respondents over 60, whose lifetime includes the 1970s, reported higher inflation expectations from early 2021, consistent with experience-based learning; younger cohorts remained anchored to the prevailing regime. A controlled experiment with large language models conditioned on ``experienced'' and ``young'' professional personas confirms that experiential priors generate significant forecast differences under a common training leakage assumption. Across all three exercises, the source of the prior mattered more than the sophistication of the model.
Editorial analysis
A structured set of objections, weighed in public.
Referee Report
Summary. The paper claims that the 2021 U.S. inflation forecast failure was driven primarily by sample composition—estimation samples dominated by the Great Moderation underweight supply-shock regimes—rather than functional-form misspecification. Three adjustments (intercept correction, similarity re-estimation on 1970s data, and kernel-weighted estimator) substantially close the forecast gap for the CPI and eight additional price indices. Supporting evidence includes higher inflation expectations among household survey respondents over 60 (whose lifetimes include the 1970s) from early 2021 onward, and LLM experiments showing that 'experienced' versus 'young' professional personas produce significant forecast differences under a shared training-leakage assumption. The source of the prior is argued to matter more than model sophistication.
Significance. If the central claim holds, the paper contributes to the literature on inflation expectations and forecast errors by emphasizing experience-based learning and the consequences of regime under-representation in estimation samples. The combination of econometric adjustments, age-stratified survey evidence, and LLM persona experiments provides a multi-method test of the mechanism. Extension of the forecast improvements to multiple price indices adds some robustness. The work suggests practical implications for forecasters facing potential regime shifts.
major comments (3)
- [Similarity re-estimation section] Section on similarity re-estimation (1970s reference period): The central claim that re-estimation on 1970s data corrects for under-represented supply-shock regimes requires that the 1970s and 2021 episodes share comparable transmission mechanisms. Differences in shock persistence, wage-price dynamics, and policy credibility (pre-Volcker de-anchoring versus post-Volcker inflation targeting) could mean the documented gains arise from fitting distinct historical covariances rather than isolating sample composition. A direct comparison of impulse responses or regime-specific parameters between the two periods would be needed to support the interpretation.
- [LLM experiment section] LLM persona experiment section: The result that experiential priors generate forecast differences relies on the assumption that conditioning on 'experienced' and 'young' personas isolates lifetime inflation experience without confounding from LLM training data. The paper should report explicit tests or controls for training leakage (e.g., prompt variations or knowledge cutoff checks) to confirm that the persona effect is not an artifact of the model's pre-training on post-2021 data.
- [Survey evidence section] Household survey evidence section: The finding that respondents over 60 reported higher expectations from early 2021 is presented as consistent with experience-based learning. However, cohort differences may be confounded by other observables (education, income, location). Without matching or regression controls for these factors, the age gradient cannot be cleanly attributed to 1970s exposure versus other cohort characteristics.
minor comments (2)
- [Introduction] The abstract and introduction should clarify the exact econometric specification of the kernel-weighted estimator and how the bandwidth is chosen, as this choice directly affects the weighting toward historical regimes.
- [Results tables] Tables reporting forecast errors or R² values for the three adjustments should include standard errors or confidence intervals to allow assessment of statistical significance of the gap closure.
Simulated Author's Rebuttal
We thank the referee for the thoughtful and constructive comments. We address each major comment below, indicating planned revisions where appropriate.
read point-by-point responses
-
Referee: [Similarity re-estimation section] Section on similarity re-estimation (1970s reference period): The central claim that re-estimation on 1970s data corrects for under-represented supply-shock regimes requires that the 1970s and 2021 episodes share comparable transmission mechanisms. Differences in shock persistence, wage-price dynamics, and policy credibility (pre-Volcker de-anchoring versus post-Volcker inflation targeting) could mean the documented gains arise from fitting distinct historical covariances rather than isolating sample composition. A direct comparison of impulse responses or regime-specific parameters between the two periods would be needed to support the interpretation.
Authors: We thank the referee for highlighting this important interpretive caveat. The similarity re-estimation is a reduced-form exercise that incorporates data from a high-inflation regime to address under-representation in the estimation sample; the documented forecast gains for CPI and other indices are consistent with this mechanism. We acknowledge that transmission mechanisms differ across periods due to policy regime changes. We will revise the manuscript to include an explicit discussion of these differences and clarify that the exercise demonstrates the value of regime-representative data for forecasting rather than claiming structural equivalence between episodes. revision: partial
-
Referee: [LLM experiment section] LLM persona experiment section: The result that experiential priors generate forecast differences relies on the assumption that conditioning on 'experienced' and 'young' personas isolates lifetime inflation experience without confounding from LLM training data. The paper should report explicit tests or controls for training leakage (e.g., prompt variations or knowledge cutoff checks) to confirm that the persona effect is not an artifact of the model's pre-training on post-2021 data.
Authors: We agree that explicit checks for training leakage would strengthen the LLM results. The experiment is conducted under a shared training-leakage assumption across personas, with differences arising from the persona conditioning. In the revision we will add robustness checks including prompt variations and, where feasible, comparisons using models with differing knowledge cutoffs to confirm that the forecast differences are driven by the experiential persona rather than data artifacts. revision: yes
-
Referee: [Survey evidence section] Household survey evidence section: The finding that respondents over 60 reported higher expectations from early 2021 is presented as consistent with experience-based learning. However, cohort differences may be confounded by other observables (education, income, location). Without matching or regression controls for these factors, the age gradient cannot be cleanly attributed to 1970s exposure versus other cohort characteristics.
Authors: We appreciate this suggestion for addressing potential confounding. The age gradient is presented as consistent with experience-based learning, but we agree that controls would help isolate the cohort effect. In the revised manuscript we will add regression specifications that include controls for education, income, and location to provide cleaner evidence on the role of lifetime inflation exposure. revision: yes
Circularity Check
No significant circularity; derivation relies on independent empirical adjustments and external validation.
full rationale
The paper's central claim—that forecast failure stems from sample composition rather than misspecification—is supported by three explicit adjustments (intercept correction, 1970s similarity re-estimation, kernel weighting) whose performance is evaluated on forecast gaps and extended to eight other price indices. These are presented as data-driven corrections without equations reducing the target outcome to the fitted parameters by construction. Independent corroboration comes from household survey cohort differences (over-60 vs. younger respondents) and LLM persona experiments, which do not rely on self-citation chains or re-labeling of fitted inputs as predictions. No load-bearing step invokes prior author work as a uniqueness theorem or smuggles an ansatz; the derivation chain remains self-contained against the reported benchmarks.
Axiom & Free-Parameter Ledger
free parameters (1)
- Choice of 1970s as reference period
axioms (1)
- domain assumption Experience-based learning affects inflation expectations differently by age cohort
Reference graph
Works this paper leans on
-
[1]
Justify your reasoning
Report your forecasts as a table with columns: Date, Forecast. Justify your reasoning. Young persona You are a junior macroeconomist in January 2021. You started your career in the mid- 2000s. Your entire professional experience has been shaped by the Great Moderation and the 2008 financial crisis. You have studied the 1970s in textbooks but have no perso...
2021
-
[2]
Justify your reasoning
Report your forecasts as a table with columns: Date, Forecast. Justify your reasoning. Neutral persona (control) You are an economist in January 2021. You know nothing about what happens after January 2021. I provide the January 2021 vintage of the FRED-MD macroeconomic database as an attached CSV file. The CPI series is the variable CPIAUCSL (seasonally ...
2021
-
[3]
pipeline
Report your forecasts as a table with columns: Date, Forecast. Justify your reasoning. C.2 Methodology described by Claude The forecasts rest onno formal econometric model—there is no VAR, no estimated Phillips curve, no calibrated DSGE model. They arejudgmental forecasts, constructed by combining three sources of information. The FRED-MD data file The fo...
2020
discussion (0)
Sign in with ORCID, Apple, or X to comment. Anyone can read and Pith papers without signing in.