Recognition: unknown
Sensitivity Improvement by Sample Vibration Excitation in Resistivity Measurement for Non-Magnetic Material Using MFM
Pith reviewed 2026-05-10 08:23 UTC · model grok-4.3
The pith
Adding controlled vibration to the sample during MFM scans increases the phase shift signal from induced eddy currents, thereby improving the sensitivity of resistivity measurements for non-magnetic materials, as validated by theory and experiment.
A machine-rendered reading of the paper's core claim, the machinery that carries it, and where it could break.
Core claim
Theoretical analysis predicts increase of the phase shift by sample vibration, and experimental validation using a modified MFM system confirms the improvement in sensitivity. The calculated and experimental results exhibit relatively good agreement, establishing that sample vibration excitation is an effective strategy for high-sensitivity resistivity measurements.
Load-bearing premise
That the introduction of sample vibration primarily increases the relative velocity and eddy current magnitude without significantly altering other factors such as tip-sample interaction forces, mechanical resonances, or introducing additional noise in the MFM signal.
Figures


read the original abstract
A novel approach for measuring the electrical resistivity of non-magnetic materials using magnetic force microscopy (MFM) is discussed. In this method, MFM detects magnetic fields generated by eddy currents induced by the oscillation of a magnetized probe tip. To enhance measurement sensitivity, it is essential to increase the magnitude of these eddy currents. It is discussed that introducing controlled sample vibration amplifies eddy current generation by increasing the relative velocity between the probe tip and the sample surface. Theoretical analysis predicts increase of the phase shift by sample vibration, and experimental validation using a modified MFM system confirms the improvement in sensitivity. The calculated and experimental results exhibit relatively good agreement, establishing that sample vibration excitation is an effective strategy for high-sensitivity resistivity measurements.
Editorial analysis
A structured set of objections, weighed in public.
Referee Report
Summary. The manuscript proposes a method to enhance sensitivity in resistivity measurements of non-magnetic materials via magnetic force microscopy (MFM). Eddy currents are induced in the sample by the oscillating magnetized MFM tip, and the resulting magnetic fields are detected through phase shifts. The central innovation is the addition of controlled sample vibration to increase the relative velocity between tip and sample, thereby amplifying eddy currents and phase shift. Theoretical analysis predicts this increase, and experiments on a modified MFM system are reported to confirm improved sensitivity with relatively good agreement between calculation and measurement.
Significance. If the phase-shift gain can be rigorously attributed to enhanced eddy currents rather than mechanical side effects, the approach would provide a useful non-contact route to higher-sensitivity resistivity mapping, particularly for samples where conventional probes are impractical. The combination of a predictive model with experimental validation is a strength, although the absence of quantitative agreement metrics and control data limits immediate applicability.
major comments (2)
- [Abstract] Abstract: the assertion of 'relatively good agreement' between calculated and experimental phase shifts is not supported by any quantitative metric (R², residuals, or uncertainties), nor by error bars on the data, which is required to evaluate whether the observed improvement validates the eddy-current mechanism.
- [Experimental validation] Experimental validation: the manuscript does not report control measurements (e.g., on insulating samples, or monitoring of cantilever resonance frequency, amplitude stability, and mean tip-sample distance under vibration) needed to exclude confounding mechanical effects that could alter the MFM phase signal independently of increased relative velocity.
minor comments (2)
- Details of the theoretical model derivation, including the explicit dependence of induced E-field and phase shift on vibration amplitude and frequency, are not provided.
- Data exclusion criteria, post-hoc adjustments, and the specific vibration parameters used in both theory and experiment are omitted, reducing reproducibility.
Circularity Check
No circularity: theory derives from standard EM induction; experiment provides independent check
full rationale
The paper's central derivation starts from the Lorentz force and Faraday induction on the relative velocity between a vibrating magnetized tip and the sample, yielding an increased eddy-current field and thus larger MFM phase shift. This step uses textbook electromagnetic relations without defining the phase-shift output in terms of itself or fitting parameters to the target quantity. The subsequent experimental confirmation on a modified MFM system is reported as an external test, not a re-derivation of the same fitted inputs. No self-citation load-bearing steps, uniqueness theorems, or ansatz smuggling appear in the abstract or described chain. The result therefore remains self-contained against external benchmarks.
Axiom & Free-Parameter Ledger
free parameters (1)
- sample vibration amplitude and frequency
axioms (2)
- standard math Eddy currents are induced by the changing magnetic field from the oscillating magnetized probe tip, with magnitude increasing with relative velocity
- domain assumption The observed MFM phase shift is proportional to the magnetic field produced by the sample's eddy currents
Reference graph
Works this paper leans on
-
[1]
Various doping techniques— such as thermal diffusion, ion implantation, plasma doping, and epitaxial growth—are em- ployed to introduce impurities [2–4]
Introduction The impurity density or resistivity of semicon- ductors is a critical parameter for semiconduc- tor devices [1]. Various doping techniques— such as thermal diffusion, ion implantation, plasma doping, and epitaxial growth—are em- ployed to introduce impurities [2–4]. Post- doping annealing is commonly used to activate these impurities, but it ...
-
[2]
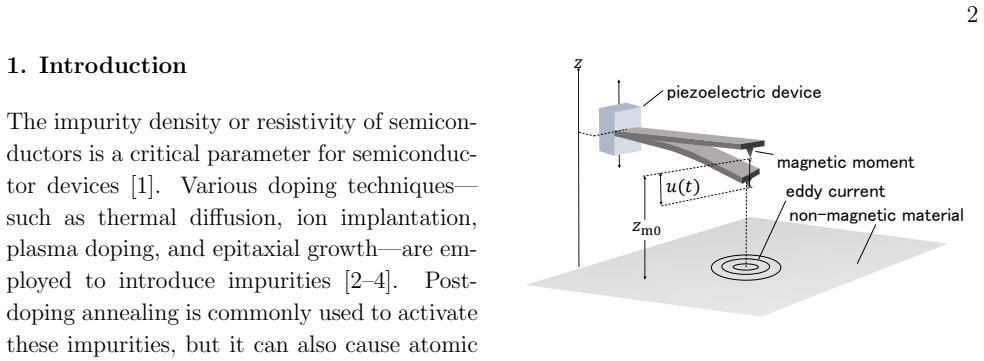
Theory Figure 1 illustrates the MFM system for re- sistivity measurement of non-magnetic mate- rials, whereu(t) andz m0 denote the displace- ment of the tip and the average height of the oscillating tip from the sample surface, respec- tively. Figure 2 shows the equivalent mechan- ical model, wherea,ω,k,pandmdenote the amplitude of the piezoelectric devic...
-
[3]
Figure 4 illustrates the measuring system for non-magnetic materials used in this experiment
Experimental procedure 3.1.Exciting sample vibration The MFM equipment was modified to vibrate the sample. Figure 4 illustrates the measuring system for non-magnetic materials used in this experiment. The most significant change was the placement of a piezoelectric device beneath the sample. The sample was vibrated by the piezoelectric device. To match ex...
-
[4]
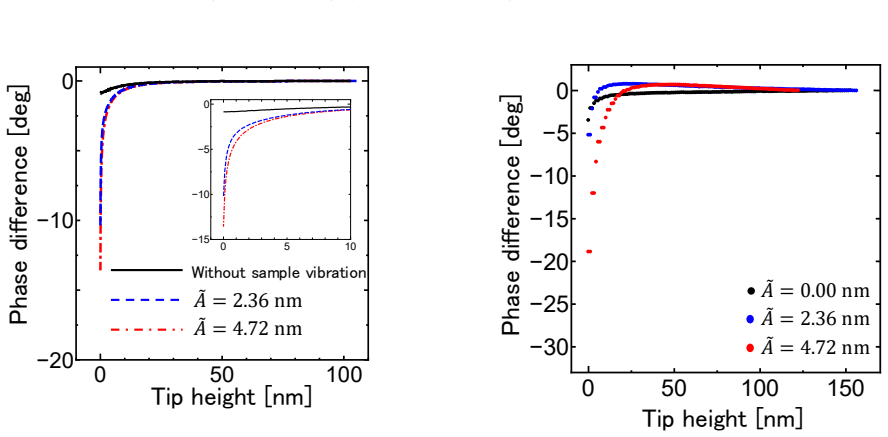
As the tip approaches the sample, the phase difference increases negatively
Results and discussion 4.1.Phase difference Figure 5 shows the phase difference ∆ϕ derived by the numerical analysis as a function ofz m0 where the black line is a phase difference without a sample vibration, the blue and red lines are phase difference with a sample vibration. As the tip approaches the sample, the phase difference increases negatively. Ad...
-
[5]
The numerical solution showed that the sensitiv- ity should be improved by vibrating the sam- ple
Conclusions To improve the sensitivity in measuring resis- tivity by using MFM, a new technique using sample vibration excitation was proposed. The numerical solution showed that the sensitiv- ity should be improved by vibrating the sam- ple. To demonstrate the sensitivity improve- ment, the MFM was equipped with a piezo- electric device for sample vibrat...
-
[6]
S. M. Sze: Physics of semiconductor device (JHON WILEY SONS, New York, 1981) 2nd ed., p. 16
1981
-
[7]
P. A. Stolk, H.-J. Gossmanna, D. J. Eaglesham, D. C. Jacobson, C. S. Rafferty, G. H. Gilmer, M. Jara´ ız, J. M. Poate, H. S. Luftman, and T. E. Haynes: Journal of Applied Physics81 (1997) 6031
1997
-
[8]
Pandey, K
K. Pandey, K. Paredis, A. J. Robson, and W. Vandervorst: Journal of Applied Physics 128(2020) 034303
2020
-
[9]
J. S. Williams: Materials Science and Enginnering A253(1998). 7
1998
-
[10]
Ruterana, M
P. Ruterana, M. Albrecht, and J. Neugebauer: Nitride Semiconductors Handbook on Materials and Device (WILEY-VCH GmbH Co. KGaA, Berlin, 2003), p. 146
2003
-
[11]
Y. Ju, K. Inoue, M. Saka, and H. Ab´ e: Applied Physics Letters81(2002) 3585
2002
-
[12]
Shinada, S
T. Shinada, S. Okamoto, T. Kobayashi, and I. Ohdomari: Nature437(2005) 1128
2005
-
[13]
Eyben, M
P. Eyben, M. Xu, N. Duhayon, T. Clarysse, S. Callewaert, and W. Vandervorst: Journal of the Vacuum Science and Technology BB 20 (2002) 471
2002
-
[14]
Rugar, H
D. Rugar, H. J. Mamin, P. Guethner, S. E. Lambert, J. E. Stern, I. McFadyen, and T. Yogi: Journal of Applied Physics68(1990) 1169
1990
-
[15]
Kazakova, R
O. Kazakova, R. Puttock, C. Barton, M. J. H. Corte-Le´ on, V. Neu, and A. Asenjo: Journal of Applied Physics125(2019) 060901
2019
-
[16]
Hartmann: Annual Review of Materials Science29(1999) 53
U. Hartmann: Annual Review of Materials Science29(1999) 53
1999
-
[17]
J. J. S´ aenz, N. Garc´ ıa, P. Gr¨ utter, E. Meyer, H. Heinzelmann, R. Wiesendanger, L. R. Hidber, and H. G¨ untherodt: Journal of Applied Physics62(1987) 4293
1987
-
[18]
Tanaka, Y
K. Tanaka, Y. Mori, H. Yamagiwa, S. Abo, F. Wakaya, and M. Takai: Microelectronic Engineering84(2007) 1416
2007
-
[19]
Wakaya, K
F. Wakaya, K. Oosawa, M. Kajiwara, S. Abo, and M. Takai: Applied Physics Letters113(2018) 261601
2018
-
[20]
Hirsekorn, U
S. Hirsekorn, U. Rabe, A. Boud, and W. Arnold: SURFACE AND INTERFACE ANALYSIS27 (1999) p. 474
1999
-
[21]
Okamoto, T
K. Okamoto, T. Imura, S. Abo, F. Wakaya, K. Murakami, and M. Nagao: Japanese Journal of Applied Physics64(2025) 04SP24
2025
-
[22]
G. T. Meaden: Electrical Resistance of Metals (Springer, New York, 1965), p. 15
1965
-
[23]
S. S. Li and W. R. Thurber: Solid.State Electronics20(1977) 609
1977
-
[24]
Feinleib and W
J. Feinleib and W. Paul: PHVSICAL REVIEW 155(1967)
1967
-
[25]
G. T. Meaden: Electrical Resistance of Metals. p. 17, (Springer, New York2013)
-
[26]
D. K. SCHRODER: SEMICONDUCTOR MATE- RIAL AND DEVICE CHARACTERIZATION. p.p. 1-50, (Hoboken, N.J2006), third edition edn
-
[27]
Sarid: Scanning Force Microscopy (Oxford University Press, New York, 1994) Revised ed., pp
D. Sarid: Scanning Force Microscopy (Oxford University Press, New York, 1994) Revised ed., pp. 6-17. p.p.19-38 (2007), revised edition edn
1994
-
[28]
P. M. Vilarinho, Y. Rosenwaks, and A. Kingo: Scanning Probe Microscopy: Characteriza- tion, Nanofabrication and Device Application of Functionaln Materials (Kluwer Academic Pub- lishers, Dordrecht, 2005), pp. 81-82, vol. 186 (2005)
2005
-
[29]
Garcia and A
R. Garcia and A. S. Paulo: PHYSICAL REVIEW B60(1999)
1999
-
[30]
S. I. Lee, S. W. Howell, A. Raman, and R. Reifenberger: PHYSICAL REVIEW B66 (2002)
2002
-
[31]
Gottlieb, D
S. Gottlieb, D. Kercheson, and C.-W. Shu: STRONG STABILITY PRESERVING RUNGE-KUTTA AND MULTISTEP TIME DISCRETIZATIONS. pp. 20-24, (World Scientific2011)
-
[32]
Deville, P
M. Deville, P. Fischer, and E. Mund: High-order methods for incompressible fluid flow. pp.113- 119, (Cambridge University Press2002)
-
[33]
S. S. Pathaneni and G. R. Desiraju: Journal of the Chemical Society, Dalton Transactions (1993) 319
1993
-
[34]
Tolias: Surface Science700(2020) 121652
P. Tolias: Surface Science700(2020) 121652
2020
-
[35]
A. C. L. X. J. CHEN and E. TOSATTI: IL NUOVO CIMENTO13(1991)
1991
-
[36]
VISSER: Advances in Colloid and Interface Science3(1972)
J. VISSER: Advances in Colloid and Interface Science3(1972)
1972
-
[37]
Chyasnavichyus, S
M. Chyasnavichyus, S. L. Young, R. Geryak, and V. V. Tsukruk: Polymer102(2016) 317
2016
-
[38]
Kong and S
L. Kong and S. Y. Chou: Applied Physics Letters 70(1997)
1997
-
[39]
Lohau, S
J. Lohau, S. Kirsch, A. Carl, G. Dumpich, and E. F. Wassermann: JOURNAL OF APPLIED PHYSICS86(1999)
1999
-
[40]
F. M. Smits: The Bell System Technical Journal 37(1958) 711
1958
discussion (0)
Sign in with ORCID, Apple, or X to comment. Anyone can read and Pith papers without signing in.