Recognition: unknown
Broken Symmetry, Conservation Law, and Scaling in Accumulated Stock Returns -- a Modified Jones-Faddy Skew t-Distribution Perspective
Pith reviewed 2026-05-10 09:11 UTC · model grok-4.3
The pith
Variance and mean of stock returns scale linearly with accumulation time despite broken symmetry between gains and losses.
A machine-rendered reading of the paper's core claim, the machinery that carries it, and where it could break.
Core claim
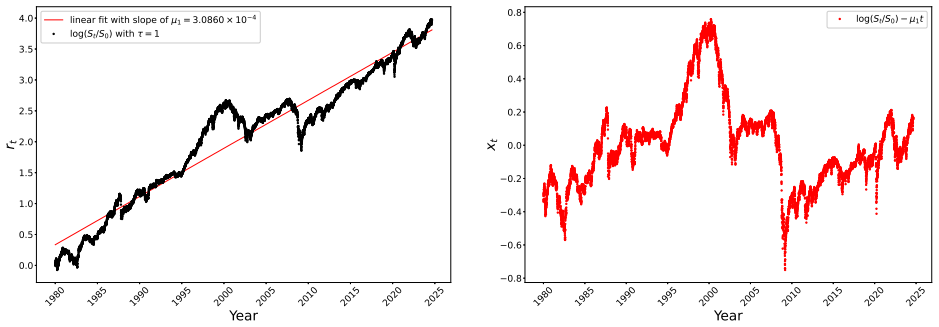
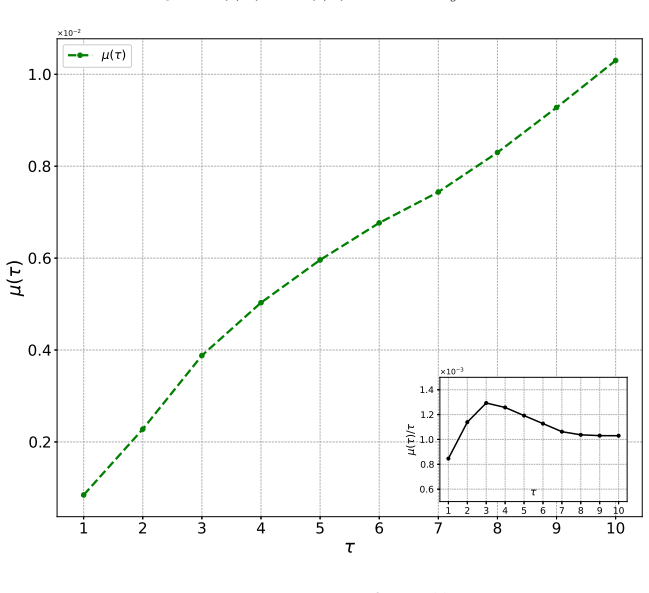
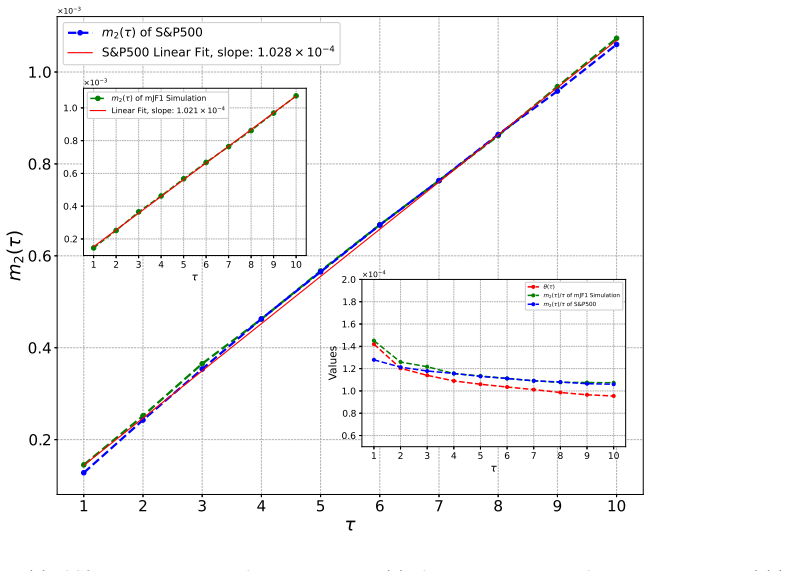
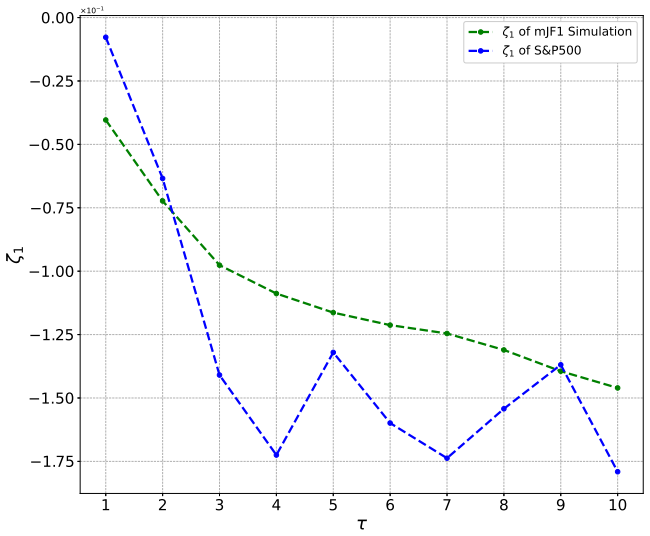
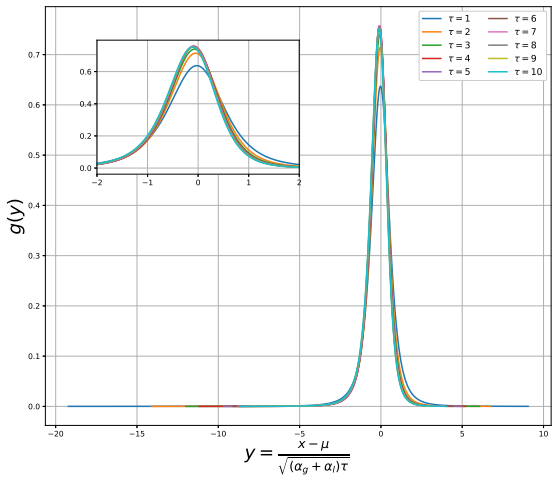
Analysis of historic S&P500 multi-day returns reveals that despite symmetry breaking between gains and losses producing a positive mean and negative skew in the return distribution, the realized variance maintains a remarkably good linear dependence on the accumulation period. The mean itself exhibits near-perfect linear scaling with time. These properties are established both analytically and numerically through the use of a modified Jones-Faddy skew t-distribution.
What carries the argument
The modified Jones-Faddy skew t-distribution, which incorporates skewness and heavy tails to model the asymmetric return distribution while preserving the linear scaling of moments.
If this is right
- Multi-period volatility can be obtained by simple multiplication of daily variance.
- Long-term expected returns can be reliably scaled from short-term observations.
- Risk assessment models need not adjust for asymmetry when computing accumulated variance.
- The scaling persists across different accumulation lengths up to at least ten days.
Where Pith is reading between the lines
- This scaling may indicate a conservation-like principle in return processes that survives asymmetry.
- It could be tested by applying the same analysis to individual stocks or other indices.
- The result might allow simpler forecasting of long-horizon portfolio risks without full distributional simulation.
- Extensions to higher moments or intraday data could reveal if the linearity breaks at other scales.
Load-bearing premise
That the modified Jones-Faddy skew t-distribution fits the data well enough that the linear scaling of variance and mean is a genuine property rather than a result of how the parameters are chosen or the data is selected.
What would settle it
A clear deviation from linear scaling in variance when returns are accumulated over periods longer than ten days or in different market regimes would falsify the claim.
Figures


read the original abstract
We analyze historic S&P500 multi-day returns: from daily returns to those accumulated over up to ten days. Despite symmetry breaking between gains and losses in the distribution of returns, resulting in its positive mean and negative skew, realized variance (volatility squared) exhibits remarkably good linear dependence on the number of days of accumulation. Mean of the distribution also shows near perfect linear dependence as well. We analyze this phenomenon both analytically and numerically using a modified Jones-Faddy skew t-distribution.
Editorial analysis
A structured set of objections, weighed in public.
Referee Report
Summary. The paper analyzes historical S&P 500 returns accumulated over horizons from 1 to 10 days. It reports that, despite symmetry breaking between gains and losses (producing positive mean and negative skew), both realized variance and the mean exhibit remarkably good linear dependence on accumulation length. The phenomenon is examined analytically and numerically via a modified Jones-Faddy skew t-distribution.
Significance. If the linear scaling of variance and mean is shown to arise independently of per-horizon parameter re-optimization, the result would indicate a robust scaling property in equity returns that survives distributional asymmetry. The analytic use of the skew-t family could then supply closed-form moment expressions that explain why variance remains linear while higher moments reflect the skew. Credit is due for attempting both analytic derivation and numerical verification on real data.
major comments (3)
- [Abstract] Abstract: the claims of 'remarkably good' and 'near perfect' linear dependence supply no quantitative measures (R², slope standard errors, p-values, or data-exclusion rules). Without these, it is impossible to determine whether the reported linearity exceeds what any four-parameter family with finite second moment would produce under independent fits.
- [Analysis section] Analysis section (presumably §3–4): the manuscript does not state whether the four parameters of the modified Jones-Faddy skew t (location, scale, skewness, degrees of freedom) are optimized independently for each accumulation horizon or held fixed (or functionally dependent on n) across horizons. If the former, the linear scaling of variance is recovered by construction via the scale parameter and adds no explanatory power beyond the model choice.
- [Numerical results] Numerical results (presumably §5): no table or figure reports the fitted parameter values versus horizon, nor a direct comparison against a null model of independent daily fits rescaled by sqrt(n). Such a comparison is required to rule out that the observed linearity is an artifact of unconstrained re-fitting rather than a property of the returns.
minor comments (2)
- [Model definition] Notation for the modified Jones-Faddy density should be stated explicitly (including any re-parameterization of the original Jones-Faddy form) so that the analytic moment derivations can be reproduced.
- [Figures] Figure captions should include the exact sample period, number of observations, and any filtering applied to the S&P 500 series.
Simulated Author's Rebuttal
We thank the referee for the constructive and detailed comments. We address each major point below and indicate the revisions we will make to strengthen the manuscript.
read point-by-point responses
-
Referee: [Abstract] Abstract: the claims of 'remarkably good' and 'near perfect' linear dependence supply no quantitative measures (R², slope standard errors, p-values, or data-exclusion rules). Without these, it is impossible to determine whether the reported linearity exceeds what any four-parameter family with finite second moment would produce under independent fits.
Authors: We agree that quantitative support is needed to substantiate the descriptive claims. In the revised manuscript we will add R² values, slope coefficients with standard errors, and p-values for the linear regressions of both mean and variance on accumulation horizon. We will also state the precise data-exclusion rules applied (e.g., handling of non-trading days and any minimum observation thresholds). These additions will allow readers to judge whether the observed linearity is stronger than would be expected from the model family under independent per-horizon fits. revision: yes
-
Referee: [Analysis section] Analysis section (presumably §3–4): the manuscript does not state whether the four parameters of the modified Jones-Faddy skew t (location, scale, skewness, degrees of freedom) are optimized independently for each accumulation horizon or held fixed (or functionally dependent on n) across horizons. If the former, the linear scaling of variance is recovered by construction via the scale parameter and adds no explanatory power beyond the model choice.
Authors: We will explicitly state in the revised analysis section that the four parameters are optimized independently for each horizon. However, the linearity is not automatic for an arbitrary four-parameter family. The modified Jones-Faddy skew-t supplies closed-form moment expressions; our analytic derivation shows that the empirical scaling of the first two moments is preserved by the fitted parameters while the higher moments continue to reflect the observed asymmetry. This is a property of the return process captured by the model rather than an artifact of the fitting procedure itself. We will expand the text to distinguish the result from what would be obtained with a generic four-parameter distribution lacking the same moment structure. revision: partial
-
Referee: [Numerical results] Numerical results (presumably §5): no table or figure reports the fitted parameter values versus horizon, nor a direct comparison against a null model of independent daily fits rescaled by sqrt(n). Such a comparison is required to rule out that the observed linearity is an artifact of unconstrained re-fitting rather than a property of the returns.
Authors: We will add a table (or supplementary figure) reporting the four fitted parameters for each horizon from 1 to 10 days. We will also include a direct comparison to the null model in which daily parameters are held fixed and the scale is rescaled by sqrt(n) under an independence assumption. The revised numerical section will show that the actual multi-horizon fits produce variance that remains linear while the skew and kurtosis evolve differently from the rescaled null, thereby demonstrating that the linearity is not solely an artifact of unconstrained re-fitting. revision: yes
Circularity Check
No significant circularity; empirical scaling observed independently of model fits
full rationale
The paper reports an empirical observation that realized variance and mean of accumulated S&P 500 returns scale linearly with accumulation horizon (1-10 days) despite distributional asymmetry. It then applies a modified Jones-Faddy skew-t distribution to model and analyze this scaling both analytically and numerically. No equations or steps in the provided abstract reduce the claimed scaling to a fitted parameter by construction, nor does the text rename a fit as a prediction or rely on self-citation for a uniqueness theorem. The scaling is presented as a data feature that the model is used to interpret, not generated tautologically from the model's own parameters or prior author work.
Axiom & Free-Parameter Ledger
Reference graph
Works this paper leans on
-
[1]
Farahani, R
H. Farahani, R. A. Serota, Asymmetry in distributions of accumulated gains and losses in stock returns, Economies„ 13 (6) (176) (2025)
2025
-
[2]
Z. Liu, M. Dashti Moghaddam, R. A. Serota, Distributions of historic market data – stock returns, The European Physical Journal B 92 (60) (2019)
2019
-
[3]
Perello, J
J. Perello, J. Masoliver, Stochastic volatility and lev erage effect, Physical Review E 67 (037102) (2003)
2003
-
[4]
Dashti Moghaddam, Z
M. Dashti Moghaddam, Z. Liu, R. A. Serota, Distributions of historic market data: relaxation and correlations, The European Physical Journal B 94 (83) (2021 )
2021
-
[5]
A. A. Drˇ agulescu, V. M. Yakovenko, Probability distrib ution of returns in the heston model with stochastic volatility, Quantitative finance 2 (6) (2002) 44 3–453
2002
-
[6]
J. Cox, J. Ingersoll, S. Ross, A theory of the term structu re of interest rates, Econometrica 3 (385–408) (1985)
1985
-
[7]
S. L. Heston, A closed-form solution for options with sto chastic volatility with applications to bond and currency options, The review of financial studies 6 (2) (1 993) 327–343
-
[8]
P. D. Praetz, The distribution of share price changes, Jo urnal of Business (1972) 49–55
1972
-
[9]
Nelson, Arch models as diffusion approximations, Jour nal of Econometrics 45 (1990) 7
D. Nelson, Arch models as diffusion approximations, Jour nal of Econometrics 45 (1990) 7
1990
-
[10]
M. A. Fuentes, A. Gerig, J. Vicente, Universal behavior of extreme price movements in stock markets, PLoS ONE 4 (12) (2009) 1
2009
-
[11]
Dashti Moghaddam, R
M. Dashti Moghaddam, R. A. Serota, Combined mutiplicat ive-heston model for stochastic volatility, Physica A: Statistical Mechanics and its Applications 561 ( 2021) 125263
2021
-
[12]
T. Ma, R. Serota, A model for stock returns and volatilit y, Physica A: Statistical Mechanics and its Applications 398 (2014) 89–115
2014
-
[13]
S. Shao, A. Ghasemi, H. Farahani, R. A. Serota, Broken sy mmetry of stock returns – a modified jones-faddy skew t-distribution, Economies 14 (84) (3 2026 )
2026
-
[14]
M. C. Jones, Probability and Statistical Models with Ap plications, Chapman and Hall, London, 2001, Ch. 17, pp. 159–174
2001
-
[15]
M. C. Jones, M. J. Faddy, A skew extension of the t-distri bution, with applications, Journal of Royal Statistical Society B 65 (1) (2003) 159–174
2003
-
[16]
Nist digital library of mathematical functions, https ://dlmf.nist.gov/
-
[17]
Student t-distribution, https://reference.wolfram .com/language/ref/studenttdistribution.html
-
[18]
Janczura, R
J. Janczura, R. Weron, Black swans or dragon-kings? a si mple test for deviations from the power law, European Physical Journal Special Topics 205 (2012) 79–93
2012
-
[19]
V. F. Pisarenko, D. Sornette, Robust statistical tests of dragon-kings beyond power law distribution, The European Physical Journal Special Topics 205 (2012) 95– 115
2012
-
[20]
Sornette, G
D. Sornette, G. Ouillon, Dragon-kings: Mechanisms, st atistical methods and empirical evidence, The European Physical Journal Special Topics 205 (2012) 1–26
2012
-
[21]
J. Liu, M. Dashti Moghaddam, R. A. Serota, Are there drag on kings in the stock market?, Foundations 4 (1) (2024) 91–113. 14 Appendix A. Bayesian fitting with mJF1 Appendix A.1. Gains 10 −6 10 −5 10 −4 10 −3 10 −2 10 −1 10 −4 10 −3 10 −2 10 −1 10 0 CCDF τ = 1 Simulation of mJF1 S&P500 10 −6 10 −5 10 −4 10 −3 10 −2 10 −1 τ = 2 Simulation of mJF1 S&P500 10 −...
2024
discussion (0)
Sign in with ORCID, Apple, or X to comment. Anyone can read and Pith papers without signing in.