Recognition: unknown
Sparse regression, classification, and microbial network estimation in QIIME2 with q2-classo and q2-gglasso
Pith reviewed 2026-05-10 09:03 UTC · model grok-4.3
The pith
q2-classo and q2-gglasso implement sparse log-contrast regression, classification, and latent graphical models for compositional microbiome data inside QIIME 2.
A machine-rendered reading of the paper's core claim, the machinery that carries it, and where it could break.
Core claim
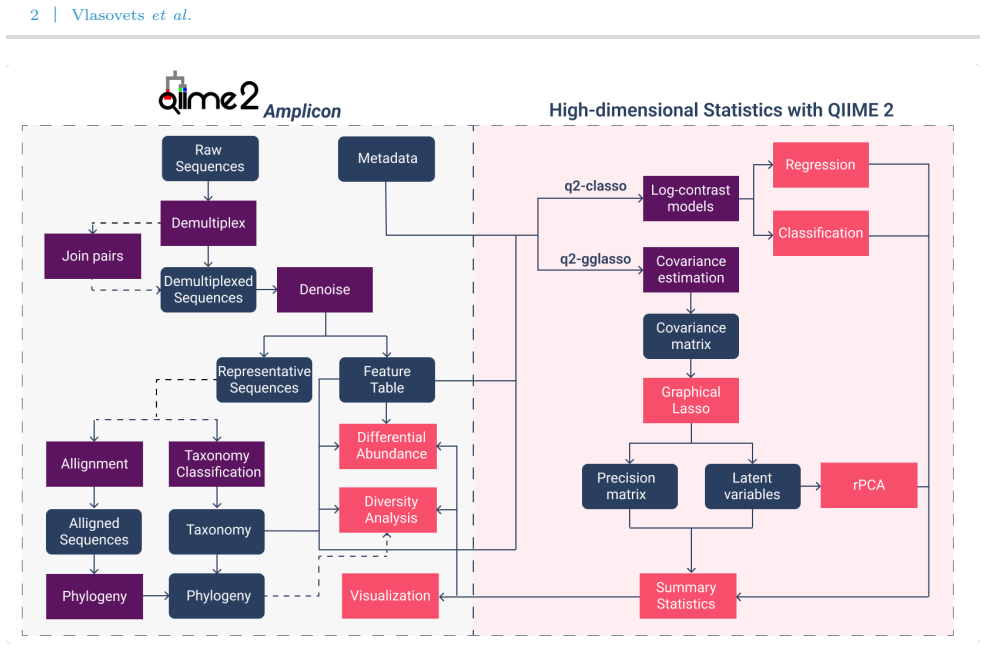
We present q2-classo and q2-gglasso, two novel QIIME 2 plugins that implement penalized regression, classification, and graphical modeling approaches for microbial compositional data. q2-classo enables the prediction of a continuous or binary outcome of interest using compositional microbiome data as predictors, with both sparse log-contrast regression and classification as well as tree-aggregated log-contrast models. q2-gglasso enables the estimation of taxon-taxon association networks through sparse graphical model estimation such as the SPIEC-EASI framework, as well as adaptive and latent graphical models; the latent model decomposes associations into a sparse direct interaction matrix.
What carries the argument
Sparse log-contrast models for regression and classification together with latent graphical models that factor taxon-taxon associations into a sparse direct-interaction matrix and a low-rank latent matrix.
If this is right
- Analysts can keep all steps of microbiome regression and network inference inside QIIME 2 without exporting data to external packages.
- Tree-aggregated log-contrast models let phylogenetic relationships regularize predictions of host or environmental outcomes.
- Latent graphical models allow researchers to embed samples via the low-rank component while still obtaining a sparse interpretable interaction graph.
- Model selection and cross-validation routines become reproducible artifacts stored alongside the original sequencing data.
Where Pith is reading between the lines
- Routine use of these plugins could reduce the practice of applying Euclidean or naive correlation methods to relative abundances, lowering the rate of spurious taxon associations reported in the literature.
- The latent-factor decomposition may prove useful for batch-effect correction in multi-study microbiome meta-analyses.
- Future extensions could couple the same log-contrast penalty with other QIIME 2 visualization or differential-abundance tools for end-to-end workflows.
Load-bearing premise
The penalized log-contrast and graphical methods correctly respect the compositional constraints of microbial count data and produce unbiased estimates inside the QIIME 2 pipeline.
What would settle it
Apply the plugins to simulated compositional count tables whose true regression coefficients or direct-interaction graph are known; the recovered coefficients or edges should match the ground truth at rates substantially above chance and without systematic sign flips or spurious dense subgraphs.
Figures
read the original abstract
Motivation: Statistical analysis of microbial count data derived from 16S rRNA or metagenomics sequencing poses unique challenges due to the sparse, compositional, and high-dimensional nature of the data. While QIIME 2 already provides many tools for data pre-processing and analysis, plugins for statistical regression, classification, and microbial network estimation tailored to compositional count data are relatively scarce. Results: We present q2-classo and q2-gglasso, two novel QIIME 2 plugins that implement penalized regression, classification, and graphical modeling approaches for microbial compositional data. q2-classo enables the prediction of a continuous or binary outcome of interest using compositional microbiome data as predictors. Both sparse log-contrast regression and classification, as well as tree-aggregated log-contrast models are available. q2-gglasso enables the estimation of taxon-taxon association networks through sparse graphical model estimation, such as, e.g., the SPIEC-EASI framework, as well as adaptive and latent graphical models. The latent model can decompose taxon-taxon associations into a sparse direct interaction matrix and a latent (low-rank) matrix which enables robust principal component embedding of a data set. Within the QIIME 2 ecosystem we demonstrate their application on the Atacama soil microbiome dataset, illustrating robust model selection, classification, and microbial network estimation with covariates and latent factors. Availability: The software is freely available under the BSD-3-Clause License. Source code is available at https://github.com/bio-datascience/q2-gglasso and https://github.com/bio-datascience/q2-classo-latest, with installation through QIIME 2 and Docker.
Editorial analysis
A structured set of objections, weighed in public.
Referee Report
Summary. The manuscript introduces two QIIME 2 plugins, q2-classo and q2-gglasso, that implement sparse log-contrast regression and classification (including tree-aggregated variants) as well as sparse graphical modeling approaches such as SPIEC-EASI, adaptive, and latent graphical models for compositional microbial count data. These are demonstrated via an application to the Atacama soil microbiome dataset illustrating model selection, classification, and network estimation with covariates and latent factors.
Significance. If the implementations are shown to be faithful, the plugins would address a gap in the QIIME 2 ecosystem by making established penalized regression and graphical modeling tools for compositional data more accessible and integrated with existing microbiome workflows, supporting reproducible analyses of associations and predictions in high-dimensional sparse count data.
major comments (2)
- [Results/Demonstration] The demonstration on the Atacama dataset (described in the abstract and results) provides only qualitative illustration of usage and does not include quantitative validation metrics, coefficient comparisons, selected taxa/edge sets, or performance benchmarks against the reference classo, gglasso, or SPIEC-EASI implementations on identical input tables and hyperparameters.
- No verification is presented that the plugins correctly replicate key compositional modeling steps such as CLR transformation, zero-handling, tree aggregation, or penalty scaling, which are load-bearing for the claim that the tools respect the sparse, compositional, and high-dimensional properties of 16S count data without introducing systematic biases.
minor comments (1)
- [Abstract] The abstract and availability section could specify the exact QIIME 2 version compatibility, required dependencies, and provide a minimal reproducible example workflow or command-line invocation.
Simulated Author's Rebuttal
We thank the referee for their constructive feedback and positive evaluation of the significance of our work. We address each of the major comments below and outline the revisions we will make to the manuscript.
read point-by-point responses
-
Referee: The demonstration on the Atacama dataset (described in the abstract and results) provides only qualitative illustration of usage and does not include quantitative validation metrics, coefficient comparisons, selected taxa/edge sets, or performance benchmarks against the reference classo, gglasso, or SPIEC-EASI implementations on identical input tables and hyperparameters.
Authors: We appreciate the referee's observation. The Atacama dataset application is presented primarily as an illustrative example of plugin usage and integration within QIIME 2 workflows for model selection, classification, and network estimation. We agree that quantitative elements would strengthen the manuscript. In the revised version, we will add direct comparisons of coefficient values, selected taxa/edge sets, and any relevant performance metrics by executing the original classo, gglasso, and SPIEC-EASI implementations on the identical Atacama input tables and hyperparameters, with results incorporated into the Results section. revision: yes
-
Referee: No verification is presented that the plugins correctly replicate key compositional modeling steps such as CLR transformation, zero-handling, tree aggregation, or penalty scaling, which are load-bearing for the claim that the tools respect the sparse, compositional, and high-dimensional properties of 16S count data without introducing systematic biases.
Authors: We acknowledge that the current manuscript does not include explicit verification of these steps. In the revision, we will add a dedicated verification analysis (as a new Results subsection or supplementary material) that compares outputs from q2-classo and q2-gglasso against the reference implementations for CLR transformation, zero-handling, tree aggregation, and penalty scaling. This will use the Atacama dataset or simulated compositional count data to confirm fidelity and absence of systematic biases. revision: yes
Circularity Check
No circularity: software wrapper paper with no new derivations
full rationale
The paper presents two QIIME 2 plugins that implement and expose pre-existing penalized regression, classification, and graphical modeling methods (sparse log-contrast models, SPIEC-EASI-style networks, latent graphical models) for compositional microbiome data. The abstract and description focus on availability, installation, and an illustrative application to the Atacama dataset; no original equations, uniqueness theorems, or predictions are derived. All core statistical components are imported from external frameworks (classo, gglasso, etc.), so no load-bearing step reduces by construction to a fitted parameter, self-definition, or self-citation chain. The derivation chain is empty by design.
Axiom & Free-Parameter Ledger
Reference graph
Works this paper leans on
-
[1]
Log contrast models for experiments with mixtures.Biometrika, 71(2):323–330, 1984
John Aitchison and John Bacon-Shone. Log contrast models for experiments with mixtures.Biometrika, 71(2):323–330, 1984
1984
-
[2]
Tree-aggregated predictive modeling of microbiome data.Scientific Reports, 11(1):14505, 2021
Jacob Bien, Xiaohan Yan, L´ eo Simpson, and Christian L M¨ uller. Tree-aggregated predictive modeling of microbiome data.Scientific Reports, 11(1):14505, 2021
2021
-
[3]
q2-sample-classifier: machine-learning tools for microbiome classification and regression.Journal of open research software, 3(30), 2018
Nicholas A Bokulich, Matthew R Dillon, Evan Bolyen, Benjamin D Kaehler, Gavin A Huttley, and J Gregory Caporaso. q2-sample-classifier: machine-learning tools for microbiome classification and regression.Journal of open research software, 3(30), 2018
2018
-
[4]
Reproducible, interactive, scalable and extensible microbiome data science using qiime 2.Nature biotechnology, 37(8):852–857, 2019
Evan Bolyen, Jai Ram Rideout, Matthew R Dillon, Nicholas A Bokulich, Christian C Abnet, Gabriel A Al- Ghalith, Harriet Alexander, Eric J Alm, Manimozhiyan Arumugam, Francesco Asnicar, et al. Reproducible, interactive, scalable and extensible microbiome data science using qiime 2.Nature biotechnology, 37(8):852–857, 2019
2019
-
[5]
Dada2: High-resolution sample inference from illumina amplicon data.Nature methods, 13(7):581–583, 2016
Benjamin J Callahan, Paul J McMurdie, Michael J Rosen, Andrew W Han, Amy Jo A Johnson, and Susan P Holmes. Dada2: High-resolution sample inference from illumina amplicon data.Nature methods, 13(7):581–583, 2016
2016
-
[6]
Latent variable graphical model selection via convex optimization
Venkat Chandrasekaran, Pablo A Parrilo, and Alan S Willsky. Latent variable graphical model selection via convex optimization. In2010 48th Annual Allerton Conference on Communication, Control, and Computing (Allerton), pages 1610–1613. IEEE, 2010
2010
-
[7]
Regression models for compositional data: General log-contrast formulations, proximal optimization, and microbiome data applications.Statistics in Biosciences, 13(2):217–242, 2021
Patrick L Combettes and Christian L M¨ uller. Regression models for compositional data: General log-contrast formulations, proximal optimization, and microbiome data applications.Statistics in Biosciences, 13(2):217–242, 2021
2021
-
[8]
The joint graphical lasso for inverse covariance estimation across multiple classes.Journal of the Royal Statistical Society Series B: Statistical Methodology, 76(2):373–397, 2014
Patrick Danaher, Pei Wang, and Daniela M Witten. The joint graphical lasso for inverse covariance estimation across multiple classes.Journal of the Royal Statistical Society Series B: Statistical Methodology, 76(2):373–397, 2014
2014
-
[9]
Covariance selection.Biometrics, pages 157–175, 1972
Arthur P Dempster. Covariance selection.Biometrics, pages 157–175, 1972
1972
-
[10]
gcoda: conditional dependence network inference for compositional data.Journal of Computational Biology, 24(7):699–708, 2017
Huaying Fang, Chengcheng Huang, Hongyu Zhao, and Minghua Deng. gcoda: conditional dependence network inference for compositional data.Journal of Computational Biology, 24(7):699–708, 2017
2017
-
[11]
Visualizing’omic feature rankings and log-ratios using qurro.NAR genomics and bioinformatics, 2(2):lqaa023, 2020
Marcus W Fedarko, Cameron Martino, James T Morton, Antonio Gonz´ alez, Gibraan Rahman, Clarisse A Marotz, Jeremiah J Minich, Eric E Allen, and Rob Knight. Visualizing’omic feature rankings and log-ratios using qurro.NAR genomics and bioinformatics, 2(2):lqaa023, 2020
2020
-
[12]
Anova-like differential expression (aldex) analysis for mixed population rna-seq
Andrew D Fernandes, Jean M Macklaim, Thomas G Linn, Gregor Reid, and Gregory B Gloor. Anova-like differential expression (aldex) analysis for mixed population rna-seq. PloS one, 8(7):e67019, 2013
2013
-
[13]
Sparse inverse covariance estimation with the graphical lasso.Biostatistics, 9(3):432–441, 2008
Jerome Friedman, Trevor Hastie, and Robert Tibshirani. Sparse inverse covariance estimation with the graphical lasso.Biostatistics, 9(3):432–441, 2008
2008
-
[14]
Inferring correlation networks from genomic survey data
Jonathan Friedman and Eric J Alm. Inferring correlation networks from genomic survey data. 2012
2012
-
[15]
Microbiome datasets are compositional: and this is not optional.Frontiers in microbiology, 8:2224, 2017
Gregory B Gloor, Jean M Macklaim, Vera Pawlowsky- Glahn, and Juan J Egozcue. Microbiome datasets are compositional: and this is not optional.Frontiers in microbiology, 8:2224, 2017
2017
-
[16]
Utilizing stability criteria in choosing feature selection methods yields reproducible results in microbiome data
Lingjing Jiang, Niina Haiminen, Anna-Paola Carrieri, Shi Huang, Yoshiki V´ azquez-Baeza, Laxmi Parida, Ho-Cheol Kim, Austin D Swafford, Rob Knight, and Loki Natarajan. Utilizing stability criteria in choosing feature selection methods yields reproducible results in microbiome data. Biometrics, 78(3):1155–1167, 2022
2022
-
[17]
Disentangling microbial associations from hidden environmental and technical factors via latent graphical models.bioRxiv, pages 2019–12, 2019
Zachary D Kurtz, Richard Bonneau, and Christian L M¨ uller. Disentangling microbial associations from hidden environmental and technical factors via latent graphical models.bioRxiv, pages 2019–12, 2019
2019
-
[18]
Sparse and compositionally robust inference of microbial ecological networks.PLoS computational biology, 11(5):e1004226, 2015
Zachary D Kurtz, Christian L M¨ uller, Emily R Miraldi, Dan R Littman, Martin J Blaser, and Richard A Bonneau. Sparse and compositionally robust inference of microbial ecological networks.PLoS computational biology, 11(5):e1004226, 2015
2015
-
[19]
Analysis of compositions of microbiomes with bias correction.Nature communications, 11(1):3514, 2020
Huang Lin and Shyamal Das Peddada. Analysis of compositions of microbiomes with bias correction.Nature communications, 11(1):3514, 2020
2020
-
[20]
Variable selection in regression with compositional covariates
Wei Lin, Pixu Shi, Rui Feng, and Hongzhe Li. Variable selection in regression with compositional covariates. Biometrika, 101(4):785–797, 2014
2014
-
[21]
Unifrac: an effective distance metric for microbial community comparison.The ISME journal, 5(2):169–172, 2011
Catherine Lozupone, Manuel E Lladser, Dan Knights, Jesse Stombaugh, and Rob Knight. Unifrac: an effective distance metric for microbial community comparison.The ISME journal, 5(2):169–172, 2011
2011
-
[22]
A novel sparse compositional technique reveals microbial perturbations.MSystems, 4(1):10–1128, 2019
Cameron Martino, James T Morton, Clarisse A Marotz, Luke R Thompson, Anupriya Tripathi, Rob Knight, and Karsten Zengler. A novel sparse compositional technique reveals microbial perturbations.MSystems, 4(1):10–1128, 2019
2019
-
[23]
Striped unifrac: enabling microbiome analysis at unprecedented scale.Nature methods, 15(11):847–848, 2018
Daniel McDonald, Yoshiki V´ azquez-Baeza, David Koslicki, Jason McClelland, Nicolai Reeve, Zhenjiang Xu, Antonio Gonzalez, and Rob Knight. Striped unifrac: enabling microbiome analysis at unprecedented scale.Nature methods, 15(11):847–848, 2018
2018
-
[24]
Stability selection.Journal of the Royal Statistical Society Series B: Statistical Methodology, 72(4):417–473, 2010
Nicolai Meinshausen and Peter B¨ uhlmann. Stability selection.Journal of the Royal Statistical Society Series B: Statistical Methodology, 72(4):417–473, 2010
2010
-
[25]
Robust regression with compositional covariates.Computational Statistics & Data Analysis, 165:107315, 2022
Aditya Mishra and Christian L M¨ uller. Robust regression with compositional covariates.Computational Statistics & Data Analysis, 165:107315, 2022
2022
-
[26]
Establishing microbial composition measurement standards with reference frames
James T Morton, Clarisse Marotz, Alex Washburne, Justin Silverman, Livia S Zaramela, Anna Edlund, Karsten Zengler, and Rob Knight. Establishing microbial composition measurement standards with reference frames. Nature communications, 10(1):2719, 2019
2019
-
[27]
Significant impacts of increasing aridity on the arid soil microbiome.MSystems, 2(3):e00195–16, 2017
Julia W Neilson, Katy Califf, Cesar Cardona, Audrey Copeland, Will Van Treuren, Karen L Josephson, Rob Knight, Jack A Gilbert, Jay Quade, J Gregory Caporaso, et al. Significant impacts of increasing aridity on the arid soil microbiome.MSystems, 2(3):e00195–16, 2017
2017
-
[28]
Netcomi: network construction and comparison for microbiome data in r.Briefings in bioinformatics, 22(4):bbaa290, 2021
Stefanie Peschel, Christian L M¨ uller, Erika Von Mutius, Anne-Laure Boulesteix, and Martin Depner. Netcomi: network construction and comparison for microbiome data in r.Briefings in bioinformatics, 22(4):bbaa290, 2021
2021
-
[29]
Facilitating bootstrapped and rarefaction-based microbiome diversity analysis with q2- boots.F1000Research, 14:87, 2025
Isaiah Raspet, Elizabeth Gehret, Chloe Herman, Jeff Meilander, Andrew Manley, Anthony Simard, Evan Bolyen, and J Gregory Caporaso. Facilitating bootstrapped and rarefaction-based microbiome diversity analysis with q2- boots.F1000Research, 14:87, 2025. Regression and network estimation in QIIME 2 5
2025
-
[30]
M¨ uller
Fabian Schaipp, Oleg Vlasovets, and Christian L. M¨ uller. Gglasso - a python package for general graphical lasso computation.Journal of Open Source Software, 6(68):3865, 2021
2021
-
[31]
Scnic: Sparse correlation network investigation for compositional data.Molecular Ecology Resources, 23(1):312–325, 2023
Michael Shaffer, Kumar Thurimella, John D Sterrett, and Catherine A Lozupone. Scnic: Sparse correlation network investigation for compositional data.Molecular Ecology Resources, 23(1):312–325, 2023
2023
-
[32]
Regression analysis for microbiome compositional data.The Annals of Applied Statistics, 10(2):1019 – 1040, 2016
Pixu Shi, Anru Zhang, and Hongzhe Li. Regression analysis for microbiome compositional data.The Annals of Applied Statistics, 10(2):1019 – 1040, 2016
2016
-
[33]
Combettes, and Christian L
L´ eo Simpson, Patrick L. Combettes, and Christian L. M¨ uller. c-lasso - a python package for constrained sparse and robust regression and classification.Journal of Open Source Software, 6(57):2844, 2021
2021
-
[34]
Microbial networks in spring-semi-parametric rank- based correlation and partial correlation estimation for quantitative microbiome data.Frontiers in genetics, 10:516, 2019
Grace Yoon, Irina Gaynanova, and Christian L M¨ uller. Microbial networks in spring-semi-parametric rank- based correlation and partial correlation estimation for quantitative microbiome data.Frontiers in genetics, 10:516, 2019
2019
discussion (0)
Sign in with ORCID, Apple, or X to comment. Anyone can read and Pith papers without signing in.