Recognition: unknown
Mobility Behaviour of Immigrants in Canada: Analyzing Mode Choice Using GPS Panel Data and Mixed Logit Models
Pith reviewed 2026-05-10 09:10 UTC · model grok-4.3
The pith
New immigrants in Canada show about 66 percent lower sensitivity to in-vehicle travel time than Canadian-born residents, with higher integration linked to greater car use.
A machine-rendered reading of the paper's core claim, the machinery that carries it, and where it could break.
Core claim
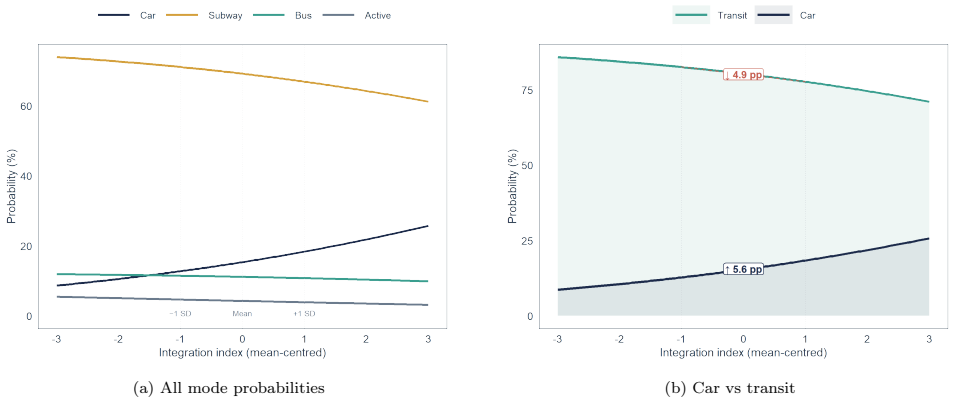
The joint revealed and stated preference mixed logit models applied to the panel data indicate that new immigrants exhibit lower sensitivity to in-vehicle travel time than Canadian-born respondents, producing a value of travel time for immigrants that is approximately 66 percent lower with a consistent ratio of 0.34 across specifications. Higher levels of integration, measured by a composite index of economic, social, civic, and health dimensions, are associated with reduced transit use, where a one standard deviation increase lowers the probability of choosing public transit by about five percentage points and increases car reliance. The framework also shows that unobserved e-mobility modes
What carries the argument
The composite integration index paired with mixed logit models in a joint revealed-stated preference setup, which captures preference heterogeneity and allows testing of unobserved alternatives on equal footing with observed modes.
If this is right
- Transit policies in immigrant-receiving cities should prioritize service quality improvements such as reduced access time, which the models show is about three times more effective than fare reductions at increasing transit use among immigrants.
- Emerging e-mobility options can compete directly with existing modes based on level-of-service attributes alone, without any built-in preference penalty.
- As integration levels rise, the shift toward car reliance suggests that land-use and transport planning must anticipate changing demand patterns in these populations.
- The high out-of-sample prediction accuracy of 80 to 82 percent supports using these models for scenario testing of new mobility services.
Where Pith is reading between the lines
- If the lower time sensitivity persists, cities could experience rising congestion and emissions as immigrant cohorts integrate over time unless transit alternatives improve substantially.
- Applying the same GPS panel approach in other immigrant-receiving countries would test whether the 0.34 ratio and integration-car link are specific to Canadian conditions or more general.
- The findings point to a potential feedback loop where economic integration enables car ownership, which in turn may slow further social integration if transit networks weaken.
Load-bearing premise
The 100-participant sample with over 80,000 trips is representative of broader immigrant and Canadian-born populations, and the composite integration index validly measures the intended dimensions without omitted factors.
What would settle it
Re-estimating the models on a larger, randomly selected GPS panel dataset from multiple Canadian cities and checking whether the immigrant-to-Canadian-born value of travel time ratio stays near 0.34 and the integration effect on transit probability remains around five percentage points.
Figures


read the original abstract
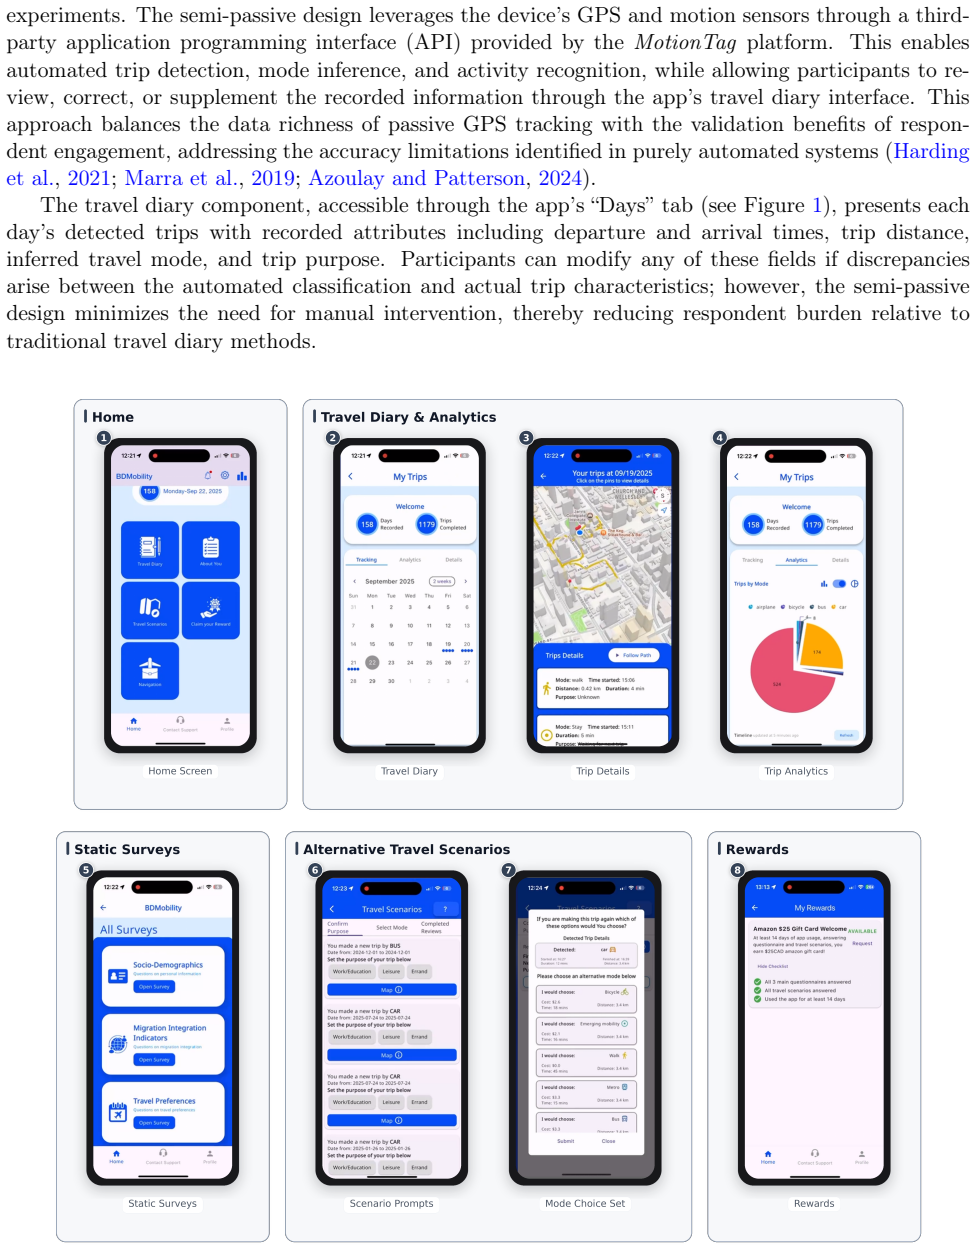
We examine these relationships using a panel dataset of more than 80,000 trip observations from 100 participants through a custom-built mobile application. A joint revealed preference (RP) and stated preference (SP) framework is used to estimate multinomial logit (MNL) and mixed logit (MXL) models. The level of integration is represented through a composite index capturing economic, social, civic, and health dimensions of integration. Results indicate two distinct patterns. First, the estimated models suggest that new immigrants in the sample exhibit lower sensitivity to in-vehicle travel time than Canadian-born respondents. The mixed logit specification suggests that the value of travel time for the sampled immigrants is approximately 66% lower than that of Canadian-born residents, with a immigrant-to-Canadian-born ratio of 0.34 that is consistent across both MXL specifications. Second, higher levels of integration are associated with reduced transit use and greater car reliance. A one standard deviation increase in the integration index decreases the probability of choosing public transit by approximately five percentage points. The joint RP-SP specification allows the inclusion of emerging e-mobility alternatives not yet observed in revealed behaviour; these face no inherent preference penalty, competing purely on their level-of-service attributes. Out-of-sample validation using five-fold cross-validation produces a mean prediction accuracy between 80% and 82% across model specifications. The findings suggest that transit policies in immigrant-receiving cities could prioritize service quality improvements, particularly reductions in access time, which are approximately three times more effective than fare reductions in shifting immigrants toward transit use.
Editorial analysis
A structured set of objections, weighed in public.
Referee Report
Summary. The manuscript analyzes mode choice behavior of immigrants versus Canadian-born residents in Canada using a GPS panel dataset of over 80,000 trips from 100 participants. It estimates multinomial logit and mixed logit models in a joint revealed preference (RP) and stated preference (SP) framework, incorporating a composite integration index across economic, social, civic, and health dimensions. Central claims are that the value of travel time (VTT) for sampled immigrants is approximately 66% lower than for Canadian-born residents (immigrant-to-Canadian-born ratio of 0.34, consistent across MXL specifications) and that a one standard deviation increase in the integration index reduces the probability of choosing public transit by approximately five percentage points. The joint RP-SP setup allows inclusion of e-mobility alternatives, and five-fold cross-validation yields 80-82% out-of-sample prediction accuracy.
Significance. If the results hold, the paper offers policy-relevant evidence on how immigrant integration shapes mobility preferences, suggesting that transit agencies in immigrant-receiving cities should prioritize service quality improvements (particularly access time reductions, claimed to be three times more effective than fare reductions) over price incentives. The use of high-frequency GPS panel data, joint RP-SP estimation, and explicit out-of-sample validation via cross-validation are strengths that enhance credibility and reproducibility compared to typical cross-sectional studies in this area.
major comments (3)
- [Mixed Logit Models and Results] Mixed logit results: The headline immigrant-to-Canadian-born VTT ratio of 0.34 is reported as consistent across two MXL specifications, but with random parameters identified from only 100 independent individuals (despite the large trip count), no standard errors, delta-method variances, or bootstrap intervals are provided for the derived ratio. This leaves open whether the ratio is statistically distinguishable from 1 or sensitive to the assumed mixing distribution (normal/lognormal) and simulation draws.
- [Integration Index and Choice Probabilities] Integration index and marginal effects: The claim that a one-SD increase in the composite integration index decreases transit choice probability by five percentage points rests on the index construction, but no details are given on variable selection, weighting scheme, or robustness to alternative aggregations. This is load-bearing for the second main finding and could be affected by omitted variable bias in the dimensions captured.
- [Data Description and Estimation] Sample and identification: The effective sample for between-person heterogeneity in the mixed logit is N=100; the paper does not report sensitivity analyses (e.g., alternative distributional assumptions, leave-one-out cross-validation for parameters, or checks on the stability of the 0.34 ratio) to address potential imprecision in the mixing distribution.
minor comments (3)
- [Model Specification] The full model equations for the mixed logit (including how random parameters are specified for time and cost, and how RP and SP data are jointly estimated) are not presented; explicit equations would aid replication.
- [Value of Travel Time Calculation] Clarify whether the 66% lower VTT (and the 0.34 ratio) is computed from means or medians of the random parameter distributions, as this affects interpretation given the panel structure.
- [Policy Implications] The policy statement that access time reductions are approximately three times more effective than fare reductions should be tied directly to specific marginal effects or elasticities from the estimated models.
Simulated Author's Rebuttal
We thank the referee for the detailed and constructive comments, which highlight important areas for strengthening the manuscript's transparency and robustness. We address each major comment below and will revise the paper accordingly to incorporate additional analyses and details.
read point-by-point responses
-
Referee: Mixed logit results: The headline immigrant-to-Canadian-born VTT ratio of 0.34 is reported as consistent across two MXL specifications, but with random parameters identified from only 100 independent individuals (despite the large trip count), no standard errors, delta-method variances, or bootstrap intervals are provided for the derived ratio. This leaves open whether the ratio is statistically distinguishable from 1 or sensitive to the assumed mixing distribution (normal/lognormal) and simulation draws.
Authors: We agree that uncertainty measures for the derived VTT ratio are essential for assessing its reliability. In the revised manuscript, we will compute and report standard errors for the 0.34 ratio using the delta method, supplemented by bootstrap confidence intervals. We will also present results under alternative mixing distributions (e.g., lognormal for time parameters) and varying simulation draws to evaluate sensitivity, while noting that the panel structure with over 80,000 trips supports identification despite the 100 individuals. revision: yes
-
Referee: Integration index and marginal effects: The claim that a one-SD increase in the composite integration index decreases transit choice probability by five percentage points rests on the index construction, but no details are given on variable selection, weighting scheme, or robustness to alternative aggregations. This is load-bearing for the second main finding and could be affected by omitted variable bias in the dimensions captured.
Authors: The referee is correct that greater transparency on the integration index is required. We will add a dedicated subsection (and appendix) detailing the variable selection for each dimension (economic, social, civic, health), the weighting scheme (e.g., equal weights or principal components), and robustness checks using alternative aggregations or subsets of dimensions. This will directly address potential biases and strengthen the marginal effects interpretation. revision: yes
-
Referee: Sample and identification: The effective sample for between-person heterogeneity in the mixed logit is N=100; the paper does not report sensitivity analyses (e.g., alternative distributional assumptions, leave-one-out cross-validation for parameters, or checks on the stability of the 0.34 ratio) to address potential imprecision in the mixing distribution.
Authors: We acknowledge the concern regarding the sample size for heterogeneity. In the revision, we will include sensitivity analyses such as alternative distributional assumptions for random parameters, stability checks on the VTT ratio across specifications, and where computationally feasible, leave-one-out or k-fold validation for key parameters. These will be reported alongside the main results to demonstrate robustness. revision: yes
Circularity Check
No circularity: results are direct statistical estimates from choice data
full rationale
The paper estimates MNL and MXL models on RP/SP panel data to obtain coefficients for in-vehicle time, cost, and the integration index. The reported VTT ratio (0.34) is the ratio of those estimated coefficients, which is the standard definition of value of travel time in discrete choice models and does not reduce to any input by the paper's own equations. The integration effect on transit probability is likewise a direct marginal effect from the fitted model. No self-definitional loops, fitted parameters renamed as predictions, or load-bearing self-citations appear in the derivation chain. Out-of-sample cross-validation is performed on held-out data, confirming the results are not tautological with the estimation sample. This is a conventional applied econometrics workflow whose central claims remain independent of the paper's inputs.
Axiom & Free-Parameter Ledger
free parameters (2)
- Random parameters in mixed logit
- Integration index construction weights
axioms (2)
- domain assumption Individuals maximize random utility when choosing travel mode
- domain assumption Stated preference responses are consistent with revealed preference behavior up to scale
Reference graph
Works this paper leans on
-
[1]
doi: 10.1016/j.trip.2023.100852. T. Alsaleh, I. Otchere, B. Farooq, Z. Patterson, and E. Cherchi. Do perceptions migrate with us? an investigation using automated travel scenarios generation from semi-passive travel diary recording. Transportation Research Procedia, 2025. In press. H.Asgari, N.Zaman, andX.Jin. Understandingimmigrants’modechoicebehaviorinF...
-
[2]
doi: 10.1016/j.trpro.2017.05.319. B. Azoulay and Z. Patterson. Towards the standardization of reporting in smartphone travel surveys: the development and application of the smartphone survey reporting guidelines (ssrgs).Transporta- tion research procedia, 76:574–585, 2024. M. Ben-Akiva and T. Morikawa. Estimation of switching models from revealed preferen...
-
[3]
URLhttps://assets.metrolinx.com/image/upload/v1663237565/Documents/Metrolinx/ Metrolinx-Business-Case-Guidance-Volume-2.pdf. M. M. Monteiro, J. de Abreu e Silva, S. Haustein, and J. Pinho de Sousa. Urban travel behaviour adaptation of temporary transnational residents.Journal of Transport Geography, 90:102935, 2021. doi: 10.1016/j.jtrangeo.2020.102935. I....
discussion (0)
Sign in with ORCID, Apple, or X to comment. Anyone can read and Pith papers without signing in.