The Impact of the Bar on Dense Gas and Star Formation in M83
Pith reviewed 2026-05-10 08:34 UTC · model grok-4.3
The pith
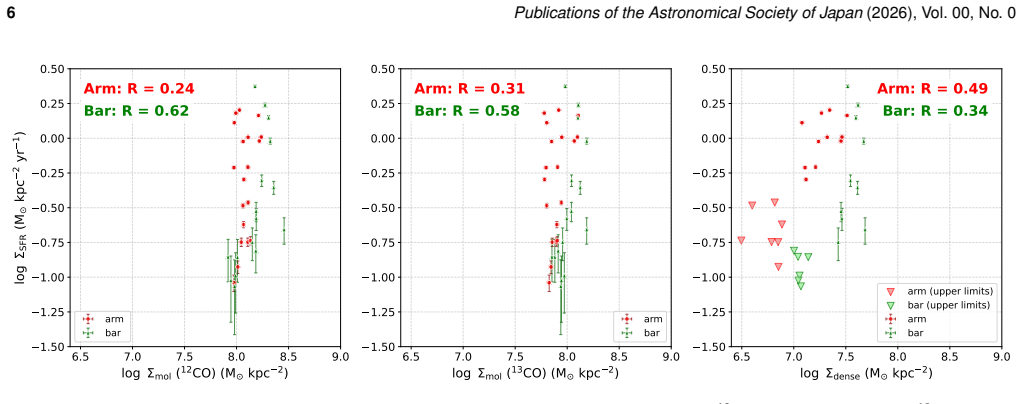
Star formation efficiency drops by a factor of two in M83's bar compared to its spiral arms.
A machine-rendered reading of the paper's core claim, the machinery that carries it, and where it could break.
Core claim
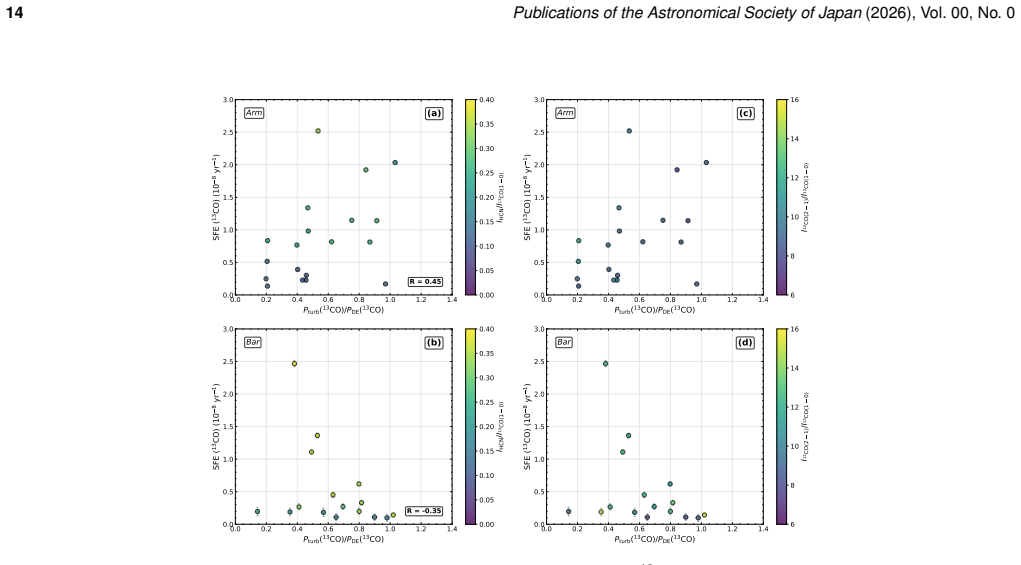
The SFEs in the bar region are roughly a factor of two lower than those in the spiral arm. The SFEs of dense gas are lower in the bar than in the arm by a factor of about 0.35. CO line widths are systematically larger in the bar region and exhibit a negative correlation with both the SFE and the dense-gas SFE. These results suggest that not only the efficiency of converting bulk molecular gas into stars is reduced in the bar, but the efficiency of star formation from dense gas is also lower, consistent with enhanced turbulent motions hindering star formation due to large-scale dynamical effects such as strong shocks induced by cloud-cloud collisions and/or shear, both driven by non-circular,
What carries the argument
Star formation efficiency (SFE) and dense-gas SFE derived from 12CO(2-1), 13CO(1-0), and HCN(1-0) intensities together with extinction-corrected H-alpha surface densities, plus analysis of CO line widths as a turbulence tracer.
If this is right
- Both bulk molecular gas and dense gas convert to stars less efficiently inside the bar.
- Wider CO lines track the drop in efficiency, pointing to turbulence as the direct suppressant.
- Large-scale bar dynamics such as shocks from cloud collisions and shear from non-circular flows drive the extra turbulence.
- The suppression is a structural effect of the bar rather than a local gas-density effect alone.
Where Pith is reading between the lines
- The same dynamical suppression could appear in other barred galaxies when similar multi-tracer maps become available.
- Bars might lower a galaxy's overall star formation rate more than expected from gas content alone.
- Higher-resolution data could separate whether shocks or shear dominate the turbulence increase.
- Alternative tracers for gas mass or star formation could test whether the measured factor-of-two difference persists.
Load-bearing premise
The CO-to-H2 and HCN-to-dense-gas conversion factors, the H-alpha extinction correction, and the 200-pc beam sampling hold equally in bar and arm environments, and the sampled regions represent the full structures.
What would settle it
Independent measurements of gas masses or star formation rates at higher resolution that erase the factor-of-two SFE difference or the line-width correlation would falsify the claimed suppression and its turbulent origin.
Figures


read the original abstract
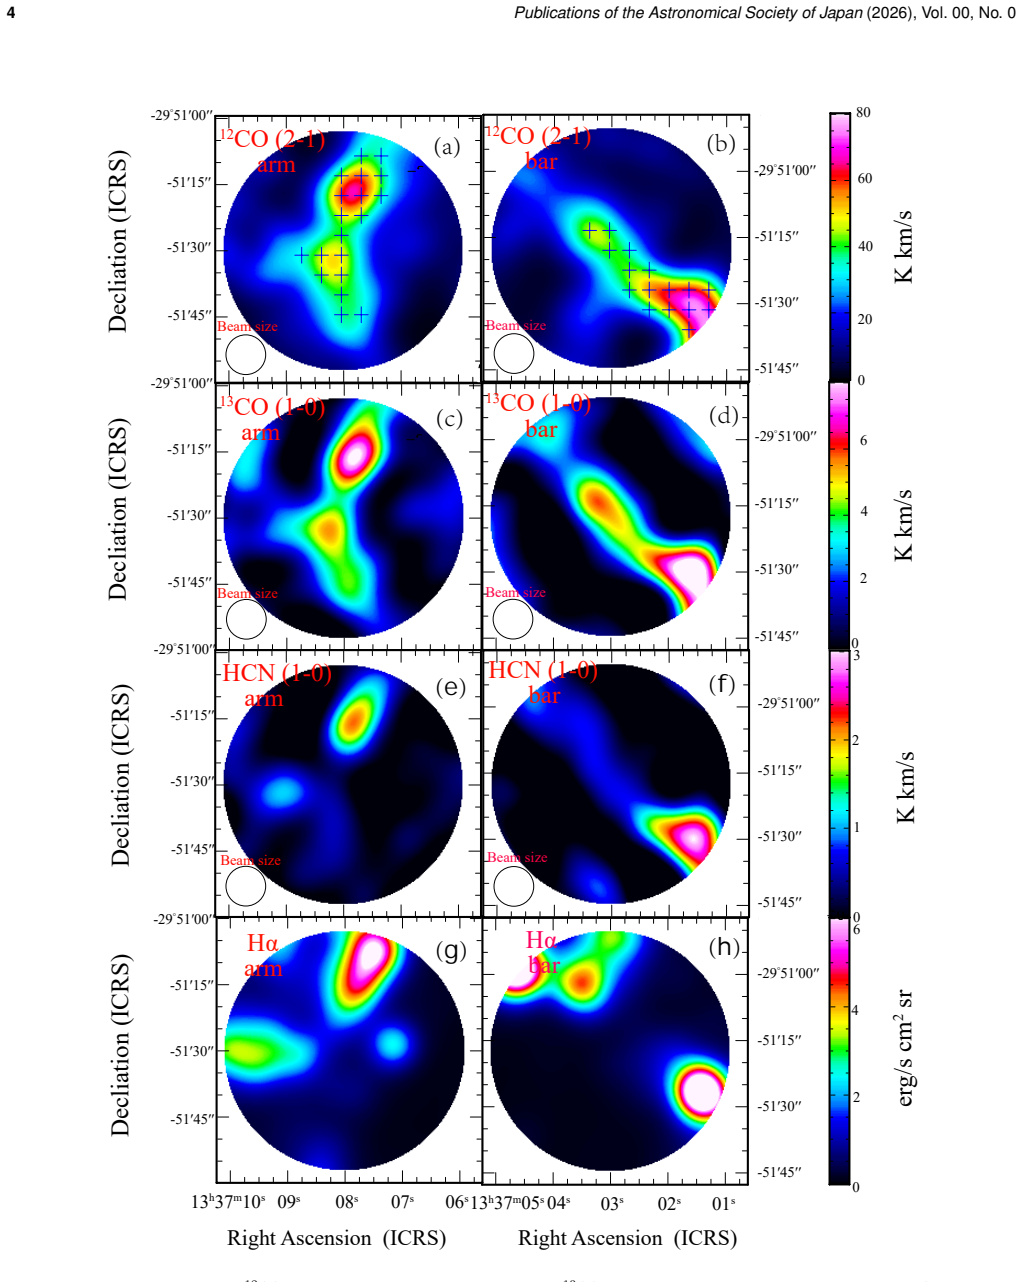
Although the relationship between molecular gas content and the star formation rate (SFR) has been extensively studied in nearby galaxies, it remains controversial whether the star formation efficiency (SFE) depends on galactic structure. In particular, whether the SFE is suppressed in the bar region compared with other structures, and the physical origin of this suppression, remain poorly understood. In this study, we investigate variations in the SFE and its physical drivers in the bar region of the nearby spiral galaxy M83, using multi-wavelength observations toward the bar and spiral arm regions on a scale of 200 pc observed with ALMA. From the molecular gas surface density derived from $^{12}$CO($J=2-1$) and $^{13}$CO($J=1-0$), the dense molecular gas surface density derived from HCN ($J = 1-0$), and the star formation rate surface density determined from extinction-corrected H$\alpha$, we find that the SFEs in the bar region are roughly a factor of two lower than those in the spiral arm, indicating that the SFE is systematically suppressed in the bar. Moreover, we find that the SFEs of dense gas are lower in the bar than in the arm by a factor of about 0.35. These results suggest that not only the efficiency of converting bulk molecular gas into stars reduced in the bar, but the efficiency of star formation from dense gas is also lower. In addition, the CO line widths are systematically larger in the bar region and exhibit a negative correlation with both the SFE and the dense-gas SFE, consistent with the interpretation that enhanced turbulent motions hinder star formation. Although the analysis is limited to small regions of M83, our results suggest that the suppression of the SFE is related to large-scale dynamical effects on the molecular gas, such as strong shocks induced by cloud-cloud collisions and/or shear, both driven by non-circular motions in the bar.
Editorial analysis
A structured set of objections, weighed in public.
Referee Report
Summary. The paper uses multi-tracer ALMA observations (12CO, 13CO, HCN) at ~200 pc resolution in M83 to compare molecular gas surface density, dense-gas surface density, and extinction-corrected Hα-derived SFR surface density between selected bar and spiral-arm regions. It reports that the star-formation efficiency (SFE = Σ_SFR / Σ_H2) is lower by a factor of ~2 in the bar, the dense-gas SFE is lower by a factor of ~0.35, and CO line widths are systematically larger in the bar with a negative correlation to both SFEs, which the authors attribute to turbulence driven by bar-induced shocks and shear.
Significance. If the quantitative differences survive scrutiny of the conversion factors and region selection, the result supplies direct multi-tracer evidence that galactic bars suppress both bulk and dense-gas star-formation efficiency on 200-pc scales via enhanced turbulence. This strengthens the observational case for environment-dependent SFE and supplies a concrete benchmark for simulations of bar-driven gas dynamics.
major comments (2)
- [Section 3 (surface-density derivation) and Section 4 (SFE comparison)] The factor-of-two SFE suppression and factor-of-0.35 dense-gas SFE suppression are obtained by dividing extinction-corrected Hα Σ_SFR by Σ_H2 (from 12CO/13CO) and Σ_dense (from HCN) using standard Galactic conversion factors. No sensitivity tests are presented for plausible environment-dependent shifts in X_CO or X_HCN arising from the larger line widths and shear reported in the bar (see line-width results). A 30-50% differential bias in either factor would erase or reverse the claimed suppression.
- [Section 2 (observations and region selection) and Section 4 (discussion of limitations)] The analysis is restricted to a few small regions whose selection criteria and representativeness of the full bar and arm structures are not quantified. The 200-pc beam mixes arm and bar gas differently in the two environments, which could introduce a differential bias not addressed by the current sampling.
minor comments (2)
- [Section 3] The notation for the two SFEs (bulk vs. dense-gas) should be defined once in the text and used consistently in all figures and tables.
- [Figures 3-5] Figure captions should explicitly state the beam size, the exact conversion factors adopted, and whether the plotted points are independent or beam-overlapping.
Simulated Author's Rebuttal
We thank the referee for their thorough and constructive review. The comments highlight important issues regarding systematic uncertainties and sampling that we address below. We will revise the manuscript to incorporate additional tests and clarifications.
read point-by-point responses
-
Referee: [Section 3 (surface-density derivation) and Section 4 (SFE comparison)] The factor-of-two SFE suppression and factor-of-0.35 dense-gas SFE suppression are obtained by dividing extinction-corrected Hα Σ_SFR by Σ_H2 (from 12CO/13CO) and Σ_dense (from HCN) using standard Galactic conversion factors. No sensitivity tests are presented for plausible environment-dependent shifts in X_CO or X_HCN arising from the larger line widths and shear reported in the bar (see line-width results). A 30-50% differential bias in either factor would erase or reverse the claimed suppression.
Authors: We agree that sensitivity tests are warranted given the environmental differences. The manuscript uses standard Galactic X_CO and X_HCN, appropriate for M83's near-solar metallicity, but we acknowledge the lack of explicit tests. In revision we will add an appendix with sensitivity analyses: we vary X_CO by ±30% and X_HCN by ±40% (motivated by the observed ~1.5× larger line widths and literature relations such as Bolatto et al. 2013). Even under the most conservative assumptions that would minimize the differences, the SFE suppression remains ≥1.4 and the dense-gas SFE suppression ≥0.28. We will also discuss why shear-induced biases are unlikely to reverse the trend, as they are already reflected in the line-width–SFE correlation. These additions will be incorporated. revision: yes
-
Referee: [Section 2 (observations and region selection) and Section 4 (discussion of limitations)] The analysis is restricted to a few small regions whose selection criteria and representativeness of the full bar and arm structures are not quantified. The 200-pc beam mixes arm and bar gas differently in the two environments, which could introduce a differential bias not addressed by the current sampling.
Authors: The regions were chosen from the CO maps to sample representative bar and arm gas while avoiding the nucleus and bar ends (as noted in Section 2 and the abstract's limitation statement). We accept that the selection criteria and statistical representativeness are not quantified in detail. In revision we will expand Section 2 with explicit region boundaries, beam counts, and a quantitative comparison of mean properties to the full bar and arm areas using the existing maps. For beam mixing we will add a discussion estimating contamination fractions and argue that any differential mixing would dilute rather than inflate the observed SFE differences, making the reported suppression a conservative lower limit. This constitutes a partial revision focused on improved documentation and discussion. revision: partial
Circularity Check
No circularity: purely observational comparison of independent measurements
full rationale
The paper reports empirical ratios of star formation efficiency (SFE) and dense-gas SFE between bar and arm regions, computed directly from measured surface densities: Σ_SFR from extinction-corrected Hα, Σ_H2 from 12CO/13CO, and Σ_dense from HCN, all at 200 pc scales. No equations derive one quantity from another by construction, no parameters are fitted to a subset and then relabeled as predictions, and no self-citations supply load-bearing uniqueness theorems or ansatzes. The central claims are simple quotients of observed quantities whose validity rests on external calibration of conversion factors rather than on any internal reduction to the paper's own inputs. The analysis is therefore self-contained and non-circular.
Axiom & Free-Parameter Ledger
axioms (2)
- domain assumption Standard CO-to-H2 and HCN-to-dense-gas conversion factors apply equally in bar and arm environments
- domain assumption Extinction-corrected H-alpha traces the star formation rate surface density without significant contamination or bias between regions
Reference graph
Works this paper leans on
-
[1]
Athanassoula, E.\ 1992, MNRAS, 259, 345A
1992
-
[2]
Bigiel, F., et al.\ 2015, ApJ, 815, 103
2015
-
[3]
Bigiel, F., et al.\ 2016, ApJ, 822, L26
2016
-
[4]
Blitz, L., & Rosolowsky, E.\ 2004, ApJ, 612, L29
2004
-
[5]
Blitz, L., & Rosolowsky, E.\ 2006, ApJ, 650, 933
2006
-
[6]
Bresolin, F., et al.\ 2016, ApJ, 830, 64
2016
-
[7]
D, et al.\ 2022, A&A, 666, A29
Bruna, L. D, et al.\ 2022, A&A, 666, A29
2022
-
[8]
CASA, the Common Astronomy Software Applications for Radio Astronomy
CASA Team, Bean, B., Bhatnagar, S., et al.\ 2022, , 134, 1041, 114501. doi:10.1088/1538-3873/ac9642
work page internal anchor Pith review doi:10.1088/1538-3873/ac9642 2022
-
[9]
Chen, H., et al.\ 2017, ApJ, 836, 101
2017
-
[10]
Comte, G.\ 1981, A&AS, 44, 441
1981
-
[11]
A.\ 2014, MNRAS, 445, 2378–2384
Davis, T. A.\ 2014, MNRAS, 445, 2378–2384
2014
-
[12]
de Vaucouleurs, G., et al.\ 1991, Third Reference Catalogue of Bright Galaxies (New York: Springer)
1991
-
[13]
Diaz-Garcia, S., et al.\ 2021, A&A, 654, 135
2021
-
[14]
A., et al.\ 2010, Ap&SS, 327, 245
Dopita, M. A., et al.\ 2010, Ap&SS, 327, 245
2010
-
[15]
Fujimoto, Y., et al.\ 2014, MNRAS, 439, 936
2014
-
[16]
Fujimoto, Y., et al.\ 2014, MNRAS, 445, L65
2014
-
[17]
Fujimoto, Y., et al.\ 2020, MNRAS, 494, 2131
2020
-
[18]
M.\ 2004, ApJ, 606, 271
Gao, Y., & Solomon, P. M.\ 2004, ApJ, 606, 271
2004
-
[19]
P., et al.\ 1991, ApJ, 366, 474
Garden, R. P., et al.\ 1991, ApJ, 366, 474
1991
-
[20]
F., et al.\ 1997, ApJ, 491, 615
Goldsmith, P. F., et al.\ 1997, ApJ, 491, 615
1997
-
[21]
Handa, T., Sofue, Y., & Nakai, N.\ 1991, AUS, 146, 156
1991
-
[22]
Heald, G., et al.\ 2016, MNRAS, 462, 1238
2016
-
[23]
Hirota, A., et al.\ 2024, ApJ, 976, 198
2024
-
[24]
H., et al.\ 2013, AJ, 145, 6
Jarrett, T. H., et al.\ 2013, AJ, 145, 6
2013
-
[25]
Jiménez-Donaire., et al.\ 2019, ApJ, 880, 127
2019
-
[26]
C., & Evans, N
Kennicutt, R. C., & Evans, N. J.\ 2012, ARA&A, 50, 531
2012
-
[27]
Koda, J., et al.\ 2020, ApJL, 890, L10
2020
-
[28]
Koda, J., et al.\ 2025, ApJ, 986, 29
2025
-
[29]
S., et al.\ 2018, MNRAS, 478, 1611
Koribalski, B. S., et al.\ 2018, MNRAS, 478, 1611
2018
-
[30]
Kregel, M., et al.\ 2002, MNRAS, 334, 646
2002
-
[31]
Kuno, N., et al.\ 2007, PASJ, 59, 117
2007
-
[32]
D., & Penzias, A
Langer, W. D., & Penzias, A. A.\ 1990, ApJ, 357, 477
1990
-
[33]
B.\ 1981, MNRAS, 194, 809
Larson, R. B.\ 1981, MNRAS, 194, 809
1981
-
[34]
M., et al.\ 2024, ApJ, 968, 97
Lee, A. M., et al.\ 2024, ApJ, 968, 97
2024
-
[35]
K., et al.\ 2008, AJ, 136, 2782
Leroy, A. K., et al.\ 2008, AJ, 136, 2782
2008
-
[36]
K., et al.\ 2013, AJ, 146, 19
Leroy, A. K., et al.\ 2013, AJ, 146, 19
2013
-
[37]
K., et al.\ 2016, ApJ, 831, 16
Leroy, A. K., et al.\ 2016, ApJ, 831, 16
2016
-
[38]
K., et al.\ 2021, ApJS, 255, 19
Leroy, A. K., et al.\ 2021, ApJS, 255, 19
2021
-
[39]
K., et al.\ 2022, ApJ, 927, 149
Leroy, A. K., et al.\ 2022, ApJ, 927, 149
2022
-
[40]
Maeda, F., et al.\ 2018, PASJ, 70, 37
2018
-
[41]
Maeda, F., et al.\ 2021, MNRAS, 502, 2238
2021
-
[42]
Maeda, F., et al.\ 2023, ApJ, 949, 7
2023
-
[43]
S., & Schombert, J
McGaugh, S. S., & Schombert, J. M.\ 2014, AJ, 148, 77
2014
-
[44]
R., et al.\ 2006, ApJS, 165, 307
Meurer, G. R., et al.\ 2006, ApJS, 165, 307
2006
-
[45]
Muraoka, K., et al.\ 2016, PASJ, 68, 89
2016
-
[46]
P., et al.\ 2001, A&A, 370, 49
Muller, H. P., et al.\ 2001, A&A, 370, 49
2001
-
[47]
Neumann, L., et al.\ 2024, A&A, 691, A121
2024
-
[48]
Neumann, L., et al.\ 2025, A&A, 693, L13
2025
-
[49]
Onodera, S., et al.\ 2010, ApJ, 722, L127
2010
-
[50]
E., et al.\ 2008, ApJ, 679, 481
Pineda, J. E., et al.\ 2008, ApJ, 679, 481
2008
-
[51]
Querejeta, M., et al.\ 2021, A&A, 645, A97
2021
-
[52]
Renaud, F., et al.\ 2015, MNRAS, 454, 3299
2015
-
[53]
Rosolowsky, E., et al.\ 2011, MNRAS, 415, 1977
2011
-
[54]
Saintonge, A., et al.\ 2017, ApJS, 233, 22
2017
-
[55]
J., Finkbeiner, D
Schlegel, D. J., Finkbeiner, D. P., & Davis, M.\ 1998, ApJ, 500, 525
1998
-
[56]
Schruba, A., et al.\ 2010, ApJ, 722, 1699
2010
-
[57]
Z., & Sanders, D
Scoville, N. Z., & Sanders, D. B.\ 1987, in Interstellar Processes, ed. D. J. Hollenbach & H. A. Thronson (Dordrecht: Reidel), 21
1987
-
[58]
Sheth, K., et al.\ 2000, ApJ, 533, 221
2000
-
[59]
Sheth, K., et al.\ 2010, PASP, 122, 1397
2010
-
[60]
M., Rivolo, A
Solomon, P. M., Rivolo, A. R., Barrett, J., & Yahil, A.\ 1987, ApJ, 319, 730
1987
-
[61]
Sorai, K., et al.\ 2012, PASJ, 64, 51
2012
-
[62]
Sun, J., et al.\ 2018, ApJ, 860, 172
2018
-
[63]
Sun, J., et al.\ 2020, ApJ, 892, 148
2020
-
[64]
Takahira, K., et al.\ 2014, ApJ, 792, 63
2014
-
[65]
Takahira, K., et al.\ 2018, PASJ, 70, S58
2018
-
[66]
H., et al.\ 2023, ApJ, 950, 119
Teng, T. H., et al.\ 2023, ApJ, 950, 119
2023
-
[67]
Thatte, N., et al.\ 2000, A&AS, 364, L47
2000
-
[68]
Thim, F., et al.\ 2003, ApJ, 590, 256
2003
-
[69]
D.\ 1982, ApJ, 255, 458
Tubbs, A. D.\ 1982, ApJ, 255, 458
1982
-
[70]
Usero, A., et al.\ 2015, AJ, 150, 115
2015
-
[71]
van Dishoeck E. F. & Black J. H.\ 1988, ApJ, 334, 771
1988
-
[72]
Watanabe, Y., et al.\ 2011, MNRAS, 411, 1409
2011
-
[73]
L.\ 1999, RPPh, 62, 143
Wilson, T. L.\ 1999, RPPh, 62, 143
1999
-
[74]
Wu, J., et al.\ 2010, ApJs, 188, 313
2010
-
[75]
Yajima, Y., et al.\ 2019, PASJ, 71, 13
2019
-
[76]
\@bibitem \@bib@author\@prev@author \@set@biblabel \@lbibitem[#1] \@bib@parse#1()\@nil \@set@biblabel \@bib@parse#1(#2)#3\@nil \@bib@author #1 @edef\@bib@year @space#2 \@empty \@set@biblabel#1 \@bib@author\@empty \@latex@warning Author name should be given for reference entry ``#1'' \@bib@year\@empty \@latex@warning Publication year should be given for re...
discussion (0)
Sign in with ORCID, Apple, or X to comment. Anyone can read and Pith papers without signing in.