Recognition: unknown
Dense Ionized Outflow with Five Narrow Components in a Dust-obscured Galaxy
Pith reviewed 2026-05-10 07:14 UTC · model grok-4.3
The pith
Five narrow ionized outflow components in a dust-obscured galaxy show hydrogen densities of at least 10^5 cm^{-3}.
A machine-rendered reading of the paper's core claim, the machinery that carries it, and where it could break.
Core claim
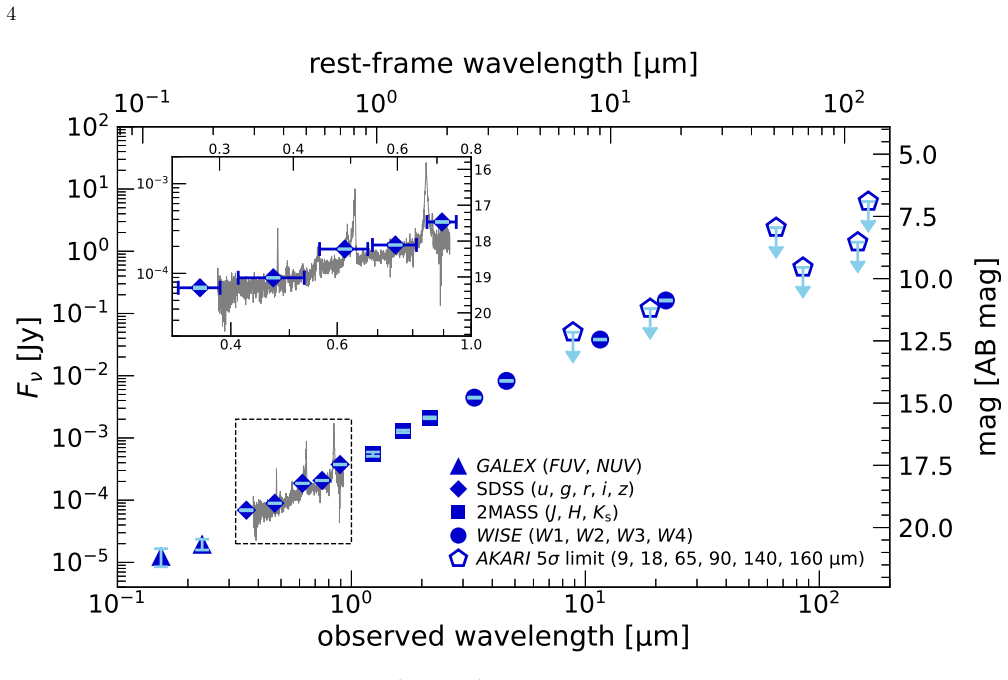
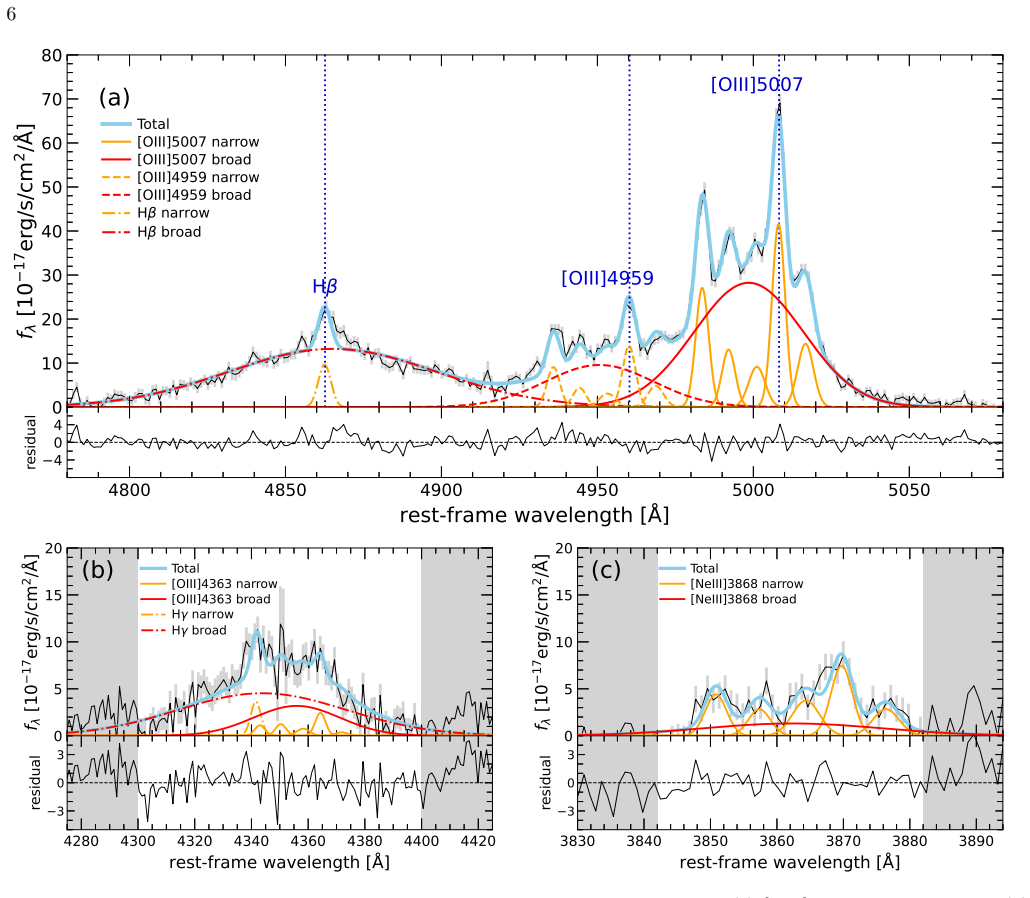
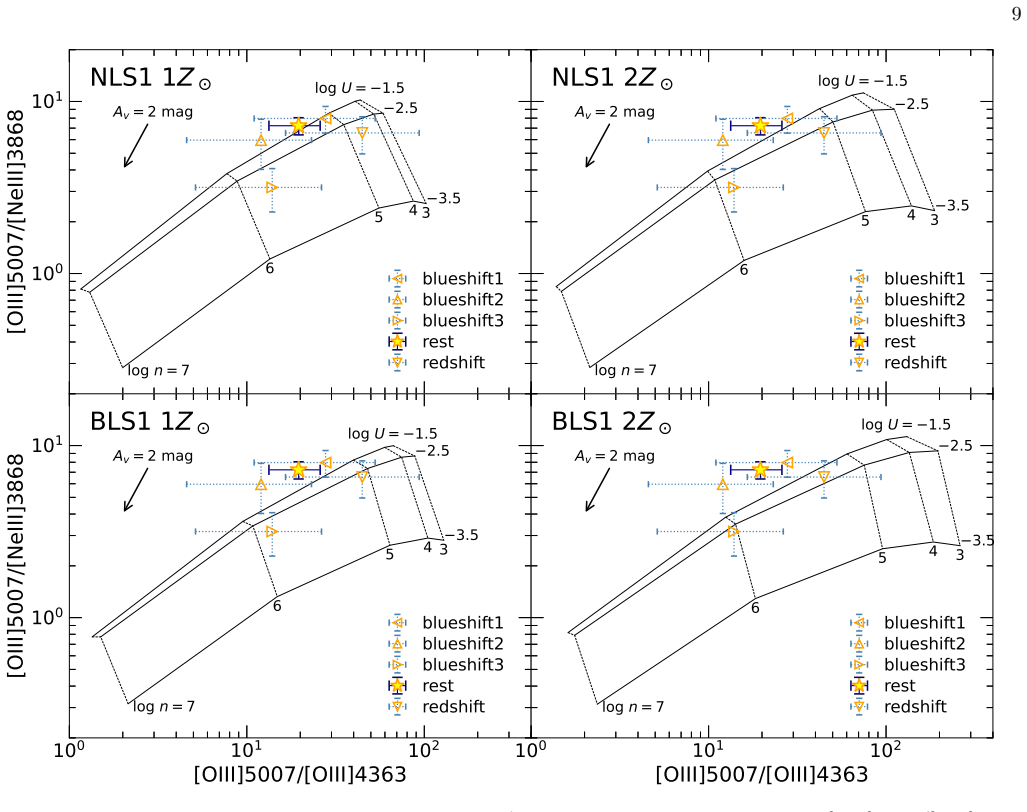
The SDSS optical spectrum of the dust-obscured galaxy J1010+3725 at z = 0.282 shows five narrow components with one broad component in [O III] λ5007. Spectrum fitting reveals velocity shifts for the narrow components from −1475 to +507 km s^{-1}. Possible multiple peaks are observed in [O III] λ4363 and [Ne III] λ3868. Comparison of the measured emission-line flux ratios with photoionization models suggests that the five outflowing components are characterized by high hydrogen densities (≳ 10^5 cm^{-3}). Our results imply that the five highly dense gas components may be outflowing with multiple bulk velocities at the innermost part of the narrow-line region in J1010+3725.
What carries the argument
Emission-line flux ratios from [O III] and [Ne III] lines compared against photoionization models to derive hydrogen density for each velocity component.
If this is right
- The ionized outflow in this dusty galaxy is more complex than the structures usually reported for similar objects.
- All five narrow components share high densities and therefore occupy the inner narrow-line region.
- The gas moves outward at five distinct bulk velocities rather than in a single smooth flow.
- Such multi-component dense outflows can be identified when multiple lines are decomposed simultaneously.
Where Pith is reading between the lines
- Similar multi-velocity dense outflows may exist in other dust-obscured galaxies but remain hidden without careful line decomposition.
- High densities could shorten the cooling time of the gas and alter how much momentum the outflow carries into the host galaxy.
- Repeated observations over years might test whether the different velocity components change independently, revealing separate ejection episodes.
Load-bearing premise
The measured emission-line flux ratios arise purely from photoionization in the outflowing gas and the chosen models match the actual physical conditions without major contributions from shocks, varying dust, or geometry effects.
What would settle it
Higher-resolution spectra or independent density diagnostics that return values well below 10^5 cm^{-3} for the same components would show the high-density interpretation is incorrect.
Figures


read the original abstract
We present our discovery of a complex ionized outflow in SDSS J101034.28+372514.7 (J1010+3725), a dust-obscured galaxy (DOG) at $z=0.282$. The SDSS optical spectrum of J1010+3725 shows five narrow components with one broad component in [O{\,\sc iii}]$\lambda$5007, which represents one of the most complex outflow structures observed among dusty active galactic nuclei. Spectrum fitting shows that the five narrow components have a wide range of velocity shifts (from $-1475$ to $+507$ km s$^{-1}$). The possible multiple peaks are also observed in [O{\,\sc iii}]$\lambda$4363 and [Ne{\,\sc iii}]$\lambda$3868, which allows us to investigate the physical condition of the outflowing gas by comparing the measured emission-line flux ratios with photoionization models. The comparison suggests that the five outflowing components are characterized by high hydrogen densities ($\gtrsim 10^5$ cm$^{-3}$). Our results imply that the five highly dense gas components may be outflowing with multiple bulk velocities at the innermost part of the narrow-line region in J1010+3725.
Editorial analysis
A structured set of objections, weighed in public.
Referee Report
Summary. The paper reports the discovery of a complex ionized outflow in the dust-obscured galaxy SDSS J101034.28+372514.7 (J1010+3725) at z=0.282. Using SDSS optical spectra, the [O III] λ5007 line is decomposed into five narrow components (velocity shifts -1475 to +507 km s^{-1}) plus one broad component. Possible multiple peaks in the weaker [O III] λ4363 and [Ne III] λ3868 lines enable measurement of per-component flux ratios, which are compared to photoionization model grids to infer high hydrogen densities (≳10^5 cm^{-3}) for each of the five outflow components, implying dense gas outflowing at multiple velocities in the innermost narrow-line region.
Significance. If the per-component density constraints hold, the result would be significant for AGN feedback studies in dust-obscured galaxies, documenting one of the most kinematically complex narrow-line outflows observed and providing direct evidence for unusually dense ionized gas. The analysis relies on public SDSS spectra and standard external photoionization grids, making the measurement reproducible and the predictions falsifiable with higher-S/N data.
major comments (2)
- [Abstract and spectrum-fitting section] Abstract and spectrum-fitting section: No quantitative fit statistics (χ², BIC, or posterior uncertainties), error budgets, or robustness tests are provided for the five-component decomposition of the diagnostic lines [O III] λ4363 and [Ne III] λ3868. The abstract refers only to 'possible multiple peaks', while the strong [O III] λ5007 decomposition is secure; without secure, statistically justified decomposition of the weak lines into the same five velocity components, the assigned fluxes and resulting density inferences are unreliable.
- [Photoionization comparison section] Photoionization comparison section: The high-density conclusion (≳10^5 cm^{-3}) rests on the assumption that the measured line ratios arise purely from photoionization in the outflowing gas. No tests are presented against alternative ionization mechanisms (e.g., shocks), geometry effects, or dust attenuation variations, which directly affects the load-bearing claim that each of the five components has high density.
minor comments (1)
- [Abstract and figures] The velocity range and component labeling in the abstract and figures would benefit from explicit tabulation of all five velocities with uncertainties for easy reference.
Simulated Author's Rebuttal
We thank the referee for their constructive and detailed review of our manuscript. We address each major comment below and indicate the revisions we will make to strengthen the paper.
read point-by-point responses
-
Referee: [Abstract and spectrum-fitting section] Abstract and spectrum-fitting section: No quantitative fit statistics (χ², BIC, or posterior uncertainties), error budgets, or robustness tests are provided for the five-component decomposition of the diagnostic lines [O III] λ4363 and [Ne III] λ3868. The abstract refers only to 'possible multiple peaks', while the strong [O III] λ5007 decomposition is secure; without secure, statistically justified decomposition of the weak lines into the same five velocity components, the assigned fluxes and resulting density inferences are unreliable.
Authors: We appreciate the referee highlighting the need for more rigorous statistical support for the decompositions of the weaker lines. The five narrow components plus broad component are securely required by the high-S/N [O III] λ5007 profile, and the weaker [O III] λ4363 and [Ne III] λ3868 lines show velocity features consistent with these components (hence our cautious use of 'possible multiple peaks' in the abstract). To address this, we will add quantitative fit statistics (χ², reduced χ², and BIC comparisons for different component numbers) for all lines in the revised spectrum-fitting section. We will also report flux uncertainties for each component and include robustness tests (e.g., refitting with four or six components and checking velocity stability). These additions will better justify assigning the same velocity components to the diagnostic lines for the density analysis. revision: yes
-
Referee: [Photoionization comparison section] Photoionization comparison section: The high-density conclusion (≳10^5 cm^{-3}) rests on the assumption that the measured line ratios arise purely from photoionization in the outflowing gas. No tests are presented against alternative ionization mechanisms (e.g., shocks), geometry effects, or dust attenuation variations, which directly affects the load-bearing claim that each of the five components has high density.
Authors: We agree that the density inferences depend on the photoionization assumption, which is standard for high-ionization lines in AGN narrow-line regions. The observed [O III] and [Ne III] ratios align with the photoionization grids at high densities without requiring additional mechanisms. Shocks are disfavored because they would typically boost low-ionization lines (not prominent here) and produce broader profiles inconsistent with our narrow components. Geometry and dust effects are handled through the standard NLR model assumptions and use of reddening-insensitive ratios. To strengthen the manuscript, we will add a dedicated paragraph in the photoionization section discussing these assumptions, why shocks are unlikely, and the limitations of not fully exploring alternative geometries or variable dust. We will also note that future higher-S/N data could test these alternatives more rigorously. revision: partial
Circularity Check
No circularity: densities derived from external model comparison on observed line ratios
full rationale
The derivation begins with direct fitting of public SDSS spectra to decompose [O III] λ5007 into five narrow components plus one broad, notes possible peaks in [O III] λ4363 and [Ne III] λ3868, extracts per-component flux ratios, and compares those ratios to standard external photoionization grids. This produces the density estimate ≳10^5 cm^{-3} without any parameter being fitted to the target result and then relabeled as a prediction, without self-definitional loops, and without load-bearing self-citations that substitute for independent verification. The chain is self-contained against external benchmarks and does not reduce to its inputs by construction.
Axiom & Free-Parameter Ledger
free parameters (1)
- component velocity shifts
axioms (1)
- domain assumption Photoionization models accurately predict the observed line ratios for given density, ionization parameter, and velocity
Reference graph
Works this paper leans on
-
[1]
Baldwin, J. A., Ferland, G. J., Martin, P. G., et al. 1991, ApJ, 374, 580, doi: 10.1086/170146
-
[2]
Barnes, J. E., & Hernquist, L. E. 1991, ApJL, 370, L65, doi: 10.1086/185978
-
[3]
Becker, R. H., White, R. L., & Helfand, D. J. 1995, ApJ, 450, 559, doi: 10.1086/176166
-
[4]
S., & Storchi-Bergmann, T
Binette, L., Wilson, A. S., & Storchi-Bergmann, T. 1996, A&A, 312, 365
1996
-
[5]
Bussmann, R. S., Dey, A., Borys, C., et al. 2009, ApJ, 705, 184, doi: 10.1088/0004-637X/705/1/184
-
[6]
Cardelli, J. A., Clayton, G. C., & Mathis, J. S. 1989, ApJ, 345, 245, doi: 10.1086/167900
-
[7]
Chatzikos, M., Bianchi, S., Camilloni, F., et al. 2023, RMxAA, 59, 327, doi: 10.22201/ia.01851101p.2023.59.02.12
-
[8]
M., Wright, E
Cutri, R. M., Wright, E. L., Conrow, T., et al. 2021, VizieR Online Data Catalog: AllWISE Data Release (Cutri+ 2013), VizieR On-line Data Catalog: II/328. Originally published in: IPAC/Caltech (2013)
2021
-
[9]
Desai, V., Soifer, B. T., Dey, A., et al. 2009, ApJ, 700, 1190, doi: 10.1088/0004-637X/700/2/1190
-
[10]
Dey, A., Soifer, B. T., Desai, V., et al. 2008, ApJ, 677, 943, doi: 10.1086/529516
-
[11]
Dopita, M. A., & Sutherland, R. S. 1996, ApJS, 102, 161, doi: 10.1086/192255
-
[12]
2016, ApJ, 819, 115, doi: 10.3847/0004-637X/819/2/115
Dorodnitsyn, A., Kallman, T., & Proga, D. 2016, ApJ, 819, 115, doi: 10.3847/0004-637X/819/2/115
-
[13]
Eisenhardt, P. R. M., Wu, J., Tsai, C.-W., et al. 2012, ApJ, 755, 173, doi: 10.1088/0004-637X/755/2/173 11
-
[14]
Fan, L., Jones, S. F., Han, Y., & Knudsen, K. K. 2017, PASP, 129, 124101, doi: 10.1088/1538-3873/aa8e91
-
[15]
Finnerty, L., Larson, K., Soifer, B. T., et al. 2020, ApJ, 905, 16, doi: 10.3847/1538-4357/abc3bf
-
[16]
and Lang, Dustin and Goodman, Jonathan , title =
Foreman-Mackey, D., Hogg, D. W., Lang, D., & Goodman, J. 2013, PASP, 125, 306, doi: 10.1086/670067
-
[17]
Ferland, G. J. 2023, Research Notes of the American Astronomical Society, 7, 246, doi: 10.3847/2515-5172/ad0e75
-
[18]
Hopkins, P. F., Hernquist, L., Cox, T. J., & Kereš, D. 2008, ApJS, 175, 356, doi: 10.1086/524362
work page internal anchor Pith review doi:10.1086/524362 2008
-
[19]
Hummer, D. G., & Storey, P. J. 1987, MNRAS, 224, 801, doi: 10.1093/mnras/224.3.801
-
[20]
Jun, H. D., Assef, R. J., Bauer, F. E., et al. 2020, ApJ, 888, 110, doi: 10.3847/1538-4357/ab5e7b
-
[21]
Kormendy, J., & Ho, L. C. 2013, ARA&A, 51, 511, doi: 10.1146/annurev-astro-082708-101811
work page internal anchor Pith review doi:10.1146/annurev-astro-082708-101811 2013
-
[22]
2023, ApJ, 950, 72, doi: 10.3847/1538-4357/accc2b
Kudoh, Y., Wada, K., Kawakatu, N., & Nomura, M. 2023, ApJ, 950, 72, doi: 10.3847/1538-4357/accc2b
-
[23]
Le, H. A. N., Xue, Y., Lin, X., & Wang, Y. 2023, ApJ, 945, 59, doi: 10.3847/1538-4357/acb770
-
[24]
Leung, G. C. K., Coil, A. L., Rupke, D. S. N., & Perrotta, S. 2021, ApJ, 914, 17, doi: 10.3847/1538-4357/abf4da
-
[25]
Li, G., Assef, R. J., Tsai, C.-W., et al. 2024, ApJ, 971, 40, doi: 10.3847/1538-4357/ad5317
-
[26]
Liu, X., Shen, Y., Strauss, M. A., & Greene, J. E. 2010, ApJ, 708, 427, doi: 10.1088/0004-637X/708/1/427
-
[27]
Magorrian, J., Tremaine, S., Richstone, D., et al. 1998, AJ, 115, 2285, doi: 10.1086/300353
-
[28]
Marconi, A., & Hunt, L. K. 2003, ApJL, 589, L21, doi: 10.1086/375804
-
[29]
Martin, D. C., Fanson, J., Schiminovich, D., et al. 2005, ApJL, 619, L1, doi: 10.1086/426387
-
[30]
Melbourne, J., Soifer, B. T., Desai, V., et al. 2012, AJ, 143, 125, doi: 10.1088/0004-6256/143/5/125
-
[31]
Morse, J. A., Raymond, J. C., & Wilson, A. S. 1996, PASP, 108, 426, doi: 10.1086/133744
-
[32]
Moshir, M., Kopman, G., & Conrow, T. A. O. 1992, IRAS Faint Source Survey, Explanatory supplement version 2
1992
-
[33]
2007, PASJ, 59, S369, doi: 10.1093/pasj/59.sp2.S369
Murakami, H., Baba, H., Barthel, P., et al. 2007, PASJ, 59, S369, doi: 10.1093/pasj/59.sp2.S369
-
[34]
2001a, ApJ, 546, 744, doi: 10.1086/318300 —
Nagao, T., Murayama, T., & Taniguchi, Y. 2001a, ApJ, 546, 744, doi: 10.1086/318300 —. 2001b, PASJ, 53, 629, doi: 10.1093/pasj/53.4.629 —. 2001c, ApJ, 549, 155, doi: 10.1086/319062
-
[35]
The Merger Rates and Mass Assembly Histories of Dark Matter Haloes in the Two
Narayanan, D., Dey, A., Hayward, C. C., et al. 2010, MNRAS, 407, 1701, doi: 10.1111/j.1365-2966.2010.16997.x
-
[36]
M., Ivezi´ c,ˇZ., & Elitzur, M
Nenkova, M., Sirocky, M. M., Ivezić, Ž., & Elitzur, M. 2008a, ApJ, 685, 147, doi: 10.1086/590482
-
[37]
2008b, ApJ, 685, 160, doi: 10.1086/590483
Elitzur, M. 2008b, ApJ, 685, 160, doi: 10.1086/590483
-
[38]
Noboriguchi, A., Nagao, T., Toba, Y., et al. 2019, ApJ, 876, 132, doi: 10.3847/1538-4357/ab1754
-
[39]
Perrotta, S., Hamann, F., Zakamska, N. L., et al. 2019, MNRAS, 488, 4126, doi: 10.1093/mnras/stz1993
-
[40]
Pilbratt, G. L., Riedinger, J. R., Passvogel, T., et al. 2010, A&A, 518, L1, doi: 10.1051/0004-6361/201014759 Ramos Almeida, C., García-Bernete, I., Pereira-Santaella, M., et al. 2025, A&A, 698, A194, doi: 10.1051/0004-6361/202453549 Rodríguez Zaurín, J., Tadhunter, C. N., Rose, M., & Holt, J. 2013, MNRAS, 432, 138, doi: 10.1093/mnras/stt423
-
[41]
2018, MNRAS, 474, 128, doi: 10.1093/mnras/stx2590
Rose, M., Tadhunter, C., Ramos Almeida, C., et al. 2018, MNRAS, 474, 128, doi: 10.1093/mnras/stx2590
-
[42]
Ross, N. P., Hamann, F., Zakamska, N. L., et al. 2015, MNRAS, 453, 3932, doi: 10.1093/mnras/stv1710
-
[43]
Sanders, D. B., Soifer, B. T., Elias, J. H., et al. 1988, ApJ, 325, 74, doi: 10.1086/165983
-
[44]
Skrutskie, M. F., Cutri, R. M., Stiening, R., et al. 2006, AJ, 131, 1163, doi: 10.1086/498708
-
[45]
Spence, R. A. W., Tadhunter, C. N., Rose, M., & Rodríguez Zaurín, J. 2018, MNRAS, 478, 2438, doi: 10.1093/mnras/sty1046
-
[46]
Storey, P. J., & Zeippen, C. J. 2000, MNRAS, 312, 813, doi: 10.1046/j.1365-8711.2000.03184.x STScI. 2013, GALEX/MCAT, STScI/MAST, doi: 10.17909/T9H59D
-
[47]
2022, PASJ, 74, 1157, doi: 10.1093/pasj/psac061
Suleiman, N., Noboriguchi, A., Toba, Y., et al. 2022, PASJ, 74, 1157, doi: 10.1093/pasj/psac061
-
[48]
2019, MNRAS, 488, 1813, doi: 10.1093/mnras/stz1755
Batcheldor, D. 2019, MNRAS, 488, 1813, doi: 10.1093/mnras/stz1755
-
[49]
2018, MNRAS, 478, 1558, doi: 10.1093/mnras/sty1064
Tadhunter, C., Rodríguez Zaurín, J., Rose, M., et al. 2018, MNRAS, 478, 1558, doi: 10.1093/mnras/sty1064
-
[50]
2019, The Astrophysical Journal, 877, 95, doi: 10.3847/1538-4357/ab1b20
Tanimoto, A., Ueda, Y., Odaka, H., et al. 2019, ApJ, 877, 95, doi: 10.3847/1538-4357/ab1b20
-
[51]
2017, ApJ, 850, 140, doi: 10.3847/1538-4357/aa918a
Toba, Y., Bae, H.-J., Nagao, T., et al. 2017, ApJ, 850, 140, doi: 10.3847/1538-4357/aa918a
-
[52]
2016, ApJ, 820, 46, doi: 10.3847/0004-637X/820/1/46
Toba, Y., & Nagao, T. 2016, ApJ, 820, 46, doi: 10.3847/0004-637X/820/1/46
-
[53]
2018, ApJ, 857, 31, doi: 10.3847/1538-4357/aab3cf
Toba, Y., Ueda, J., Lim, C.-F., et al. 2018, ApJ, 857, 31, doi: 10.3847/1538-4357/aab3cf
-
[54]
Toba, Y., Nagao, T., Strauss, M. A., et al. 2015, PASJ, 67, 86, doi: 10.1093/pasj/psv057
-
[55]
2020, ApJ, 888, 8, doi: 10.3847/1538-4357/ab5718 12
Toba, Y., Yamada, S., Ueda, Y., et al. 2020, ApJ, 888, 8, doi: 10.3847/1538-4357/ab5718 12
-
[56]
2022, A&A, 661, A15, doi: 10.1051/0004-6361/202141547
Toba, Y., Liu, T., Urrutia, T., et al. 2022, A&A, 661, A15, doi: 10.1051/0004-6361/202141547
-
[57]
2024, ApJ, 967, 65, doi: 10.3847/1538-4357/ad32c6
Toba, Y., Hashiguchi, A., Ota, N., et al. 2024, ApJ, 967, 65, doi: 10.3847/1538-4357/ad32c6
-
[58]
Tsai, C.-W., Eisenhardt, P. R. M., Wu, J., et al. 2015, ApJ, 805, 90, doi: 10.1088/0004-637X/805/2/90
-
[59]
doi:10.1088/0004-637X/758/1/66
Wada, K. 2012, ApJ, 758, 66, doi: 10.1088/0004-637X/758/1/66
-
[60]
doi:10.3847/2041-8205/828/2/L19
Wada, K., Schartmann, M., & Meijerink, R. 2016, ApJL, 828, L19, doi: 10.3847/2041-8205/828/2/L19
-
[61]
2009, ApJL, 705, L76, doi: 10.1088/0004-637X/705/1/L76
Wang, J.-M., Chen, Y.-M., Hu, C., et al. 2009, ApJL, 705, L76, doi: 10.1088/0004-637X/705/1/L76
-
[62]
Wright, E. L., Eisenhardt, P. R. M., Mainzer, A. K., et al. 2010, AJ, 140, 1868, doi: 10.1088/0004-6256/140/6/1868 —. 2019, AllWISE Source Catalog, NASA IPAC DataSet, IRSA1, doi: 10.26131/IRSA1
work page internal anchor Pith review doi:10.1088/0004-6256/140/6/1868 2010
-
[63]
Wu, J., Tsai, C.-W., Sayers, J., et al. 2012, ApJ, 756, 96, doi: 10.1088/0004-637X/756/1/96
-
[64]
G., Adelman, J., Anderson, Jr., J
York, D. G., Adelman, J., Anderson, Jr., J. E., et al. 2000, AJ, 120, 1579, doi: 10.1086/301513
-
[65]
2025, ApJ, 987, 141, doi: 10.3847/1538-4357/add930
Yoshida, T., Nagao, T., Toba, Y., et al. 2025, ApJ, 987, 141, doi: 10.3847/1538-4357/add930
-
[66]
Yu, Z., Brandt, W. N., Zou, F., et al. 2024, ApJ, 977, 210, doi: 10.3847/1538-4357/ad8bc0
-
[67]
2022, ApJ, 936, 118, doi: 10.3847/1538-4357/ac87a2
Yutani, N., Toba, Y., Baba, S., & Wada, K. 2022, ApJ, 936, 118, doi: 10.3847/1538-4357/ac87a2
-
[68]
2024, ApJ, 961, 68, doi: 10.3847/1538-4357/ad0dfc
Yutani, N., Toba, Y., & Wada, K. 2024, ApJ, 961, 68, doi: 10.3847/1538-4357/ad0dfc
-
[69]
Zakamska, N. L., Hamann, F., Pâris, I., et al. 2016, MNRAS, 459, 3144, doi: 10.1093/mnras/stw718
-
[70]
Zou, F., Brandt, W. N., Vito, F., et al. 2020, MNRAS, 499, 1823, doi: 10.1093/mnras/staa2930
discussion (0)
Sign in with ORCID, Apple, or X to comment. Anyone can read and Pith papers without signing in.