Recognition: unknown
The Community Census and Spatial Visualization Index (CCSVI)
Pith reviewed 2026-05-10 04:53 UTC · model grok-4.3
The pith
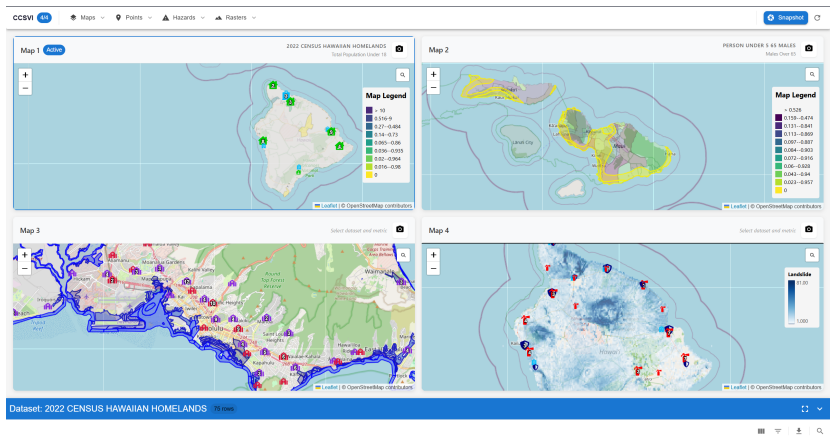
The CCSVI platform integrates climate hazard data with socioeconomic datasets to visualize vulnerabilities in Hawaii.
A machine-rendered reading of the paper's core claim, the machinery that carries it, and where it could break.
Core claim
The central claim is that the CCSVI creates a single interactive mapping system that merges climate hazard data with socioeconomic and infrastructural datasets, allowing direct exploration of correlations between environmental risks and social vulnerabilities across Hawaii and thereby supporting identification of at-risk populations along with improved disaster preparedness and climate adaptation strategies.
What carries the argument
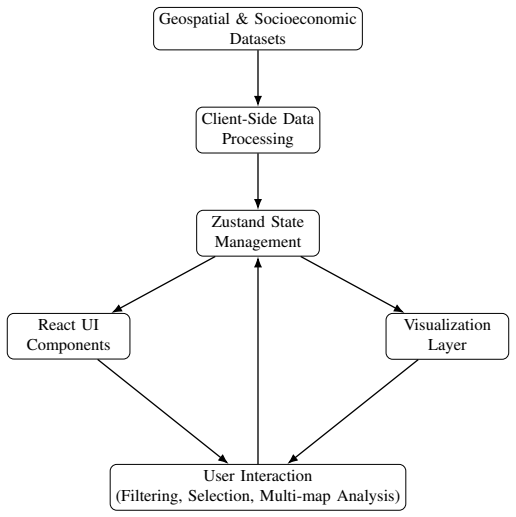
The CCSVI interactive layered mapping interface that unifies previously disjoint climate, socioeconomic, and infrastructure datasets into one accessible view.
If this is right
- Users can more readily identify populations most exposed to climate hazards.
- Decision-makers gain a tool for prioritizing resources in disaster planning.
- Community members receive clearer information on local risks to inform their responses.
- The system supports development of targeted climate adaptation strategies.
Where Pith is reading between the lines
- The same integration method could be applied to other regions where climate and social data remain fragmented.
- Adding user feedback mechanisms might strengthen the platform's effectiveness beyond initial deployment.
- Visual patterns uncovered could highlight specific policy needs in resource allocation for resilience.
Load-bearing premise
That non-expert users will understand the correlations between climate hazards and social vulnerabilities and improve disaster preparedness simply by accessing the combined interactive visualizations.
What would settle it
A controlled comparison in which participants using the CCSVI platform are tested against those using separate data sources on their ability to correctly identify vulnerable areas and suggest relevant preparedness actions.
Figures


read the original abstract
Climate hazards in Hawai'i are increasing in both frequency and severity, with varying impacts over vulnerable communities. This paper presents the Community Census and Spatial Visualization Index (CCSVI), a web-based geospatial visualization platform that integrates climate hazard data with socioeconomic and infrastructural datasets. This system enables users to explore the correlation between environmental risks and social vulnerability through interactive mapping and layered data visualizations. Social vulnerability and climate hazard data are commonly collected individually, this causes the data to be disjointed making it difficult to combine and analyze directly. With data being unrelated when collected, finding direct comparisons and combining the data is difficult resulting in many non-expert users to not understand the data. Additionally, many existing tools focus on only one of these types of data, limiting their interactivity and failing to make any improvements. CCSVI aims to handle the lack of accessible, unified, and interactive systems analyzing the relationship between climate hazards and social vulnerabilities across the state of Hawai'i. This support favors assisting decision-makers, researchers, and community members in identifying at-risk populations, improving disaster preparedness, and creating informed climate adaptation strategies.
Editorial analysis
A structured set of objections, weighed in public.
Referee Report
Summary. The paper presents the Community Census and Spatial Visualization Index (CCSVI), a web-based geospatial visualization platform that integrates climate hazard data with socioeconomic and infrastructural datasets across Hawai'i. It claims this unified interactive system addresses the problem of disjointed data collection, enabling non-expert users to explore correlations between environmental risks and social vulnerabilities in order to identify at-risk populations and improve disaster preparedness and climate adaptation strategies.
Significance. A well-implemented and validated unified visualization tool could meaningfully aid decision-makers and communities in climate-vulnerable regions by reducing the friction of combining separate datasets. However, because the manuscript supplies no implementation details, performance metrics, or user studies, the work remains a high-level description whose practical significance cannot yet be assessed.
major comments (2)
- [Abstract] Abstract: the central claim that CCSVI 'enables users to explore the correlation between environmental risks and social vulnerability' and thereby 'improves disaster preparedness' is unsupported; no user-study protocol, comprehension metrics, behavioral-change measures, or comparison against existing separate tools is described anywhere in the manuscript.
- [Full text] Full text: the manuscript contains no Methods or Implementation section detailing data sources, integration procedures, technical architecture, or how the interactive layering is realized, rendering the feasibility and novelty of the described platform impossible to evaluate.
minor comments (1)
- [Abstract] The abstract contains several run-on sentences that reduce clarity; breaking them into shorter statements would improve readability.
Simulated Author's Rebuttal
We thank the referee for the constructive feedback on our manuscript describing the Community Census and Spatial Visualization Index (CCSVI). We address each major comment below and outline the revisions we will make to improve clarity and completeness.
read point-by-point responses
-
Referee: [Abstract] Abstract: the central claim that CCSVI 'enables users to explore the correlation between environmental risks and social vulnerability' and thereby 'improves disaster preparedness' is unsupported; no user-study protocol, comprehension metrics, behavioral-change measures, or comparison against existing separate tools is described anywhere in the manuscript.
Authors: We agree that the manuscript provides no empirical user studies, metrics, or comparisons to support the stated outcomes. The claims in the abstract reflect the tool's design intent and the problem it aims to address rather than demonstrated results. In the revised manuscript we will rephrase the abstract to describe these as intended capabilities and potential benefits, and we will add a brief forward-looking section on planned user evaluations. revision: yes
-
Referee: [Full text] Full text: the manuscript contains no Methods or Implementation section detailing data sources, integration procedures, technical architecture, or how the interactive layering is realized, rendering the feasibility and novelty of the described platform impossible to evaluate.
Authors: The current manuscript text is indeed high-level and lacks a dedicated Methods or Implementation section. We will expand the paper to include a Methods section that specifies the climate hazard and socioeconomic datasets employed, the data integration workflow, the web platform's technical architecture (including mapping libraries and layering mechanisms), and implementation choices. These additions will allow readers to assess feasibility and novelty directly. revision: yes
Circularity Check
No circularity; purely descriptive tool paper with no derivations or equations
full rationale
The manuscript presents CCSVI as a web-based platform that layers existing climate hazard, socioeconomic, and infrastructural datasets into an interactive map. No equations, fitted parameters, predictions, or derivation steps appear anywhere in the text. The central claim—that integration solves disjointed-data problems for non-experts—is advanced as a design rationale rather than derived from prior results or self-citations. No self-citation load-bearing, ansatz smuggling, or renaming of known results occurs. The paper is therefore self-contained as a descriptive account and exhibits no circularity.
Axiom & Free-Parameter Ledger
invented entities (1)
-
CCSVI platform
no independent evidence
Reference graph
Works this paper leans on
-
[1]
The long-term impact of hawaii’s floods, April 2026
Aiyanna Durepo. The long-term impact of hawaii’s floods, April 2026. Earth.Org
2026
-
[2]
Social vul- nerability to climate change in hawai ‘i: Data, indicators, and ”gap” assessment
Makena Coffman, Suwan Shen, and Maja Schjervheim. Social vul- nerability to climate change in hawai ‘i: Data, indicators, and ”gap” assessment. Report to the hawai ‘i climate change mitigation and adaptation commission, University of Hawai ‘i at M ¯anoa, Institute for Sustainability and Resilience, Honolulu, HI, May 2022
2022
-
[3]
Equity data, 2024
City and County of Honolulu. Equity data, 2024. Resilient O ‘ahu, accessed April 2026
2024
-
[4]
Sea level rise: Hawai‘i shoreline viewer, 2026
Pacific Islands Ocean Observing System (PacIOOS). Sea level rise: Hawai‘i shoreline viewer, 2026. University of Hawai ‘i, accessed April 2026
2026
-
[5]
About Us
Hawaii Statewide GIS Portal, 2017. About Us
2017
-
[6]
United States Census Bureau. U.s. census bureau, 2026. Accessed April 2026
2026
-
[7]
Research guide, March 2026
Temple University Libraries. Research guide, March 2026. Accessed April 2026
2026
-
[8]
What is a tiff file?, 2026
Adobe Inc. What is a tiff file?, 2026. Accessed April 2026
2026
-
[9]
What is a csv file?, 2026
Adobe Inc. What is a csv file?, 2026. Accessed April 2026
2026
-
[10]
Whawaii climate data portal, 2026
University of Hawaii. Whawaii climate data portal, 2026. Accessed April 2026. 1lesteven@hawaii.edu 2jmv9@hawaii.edu
2026
discussion (0)
Sign in with ORCID, Apple, or X to comment. Anyone can read and Pith papers without signing in.