Recognition: unknown
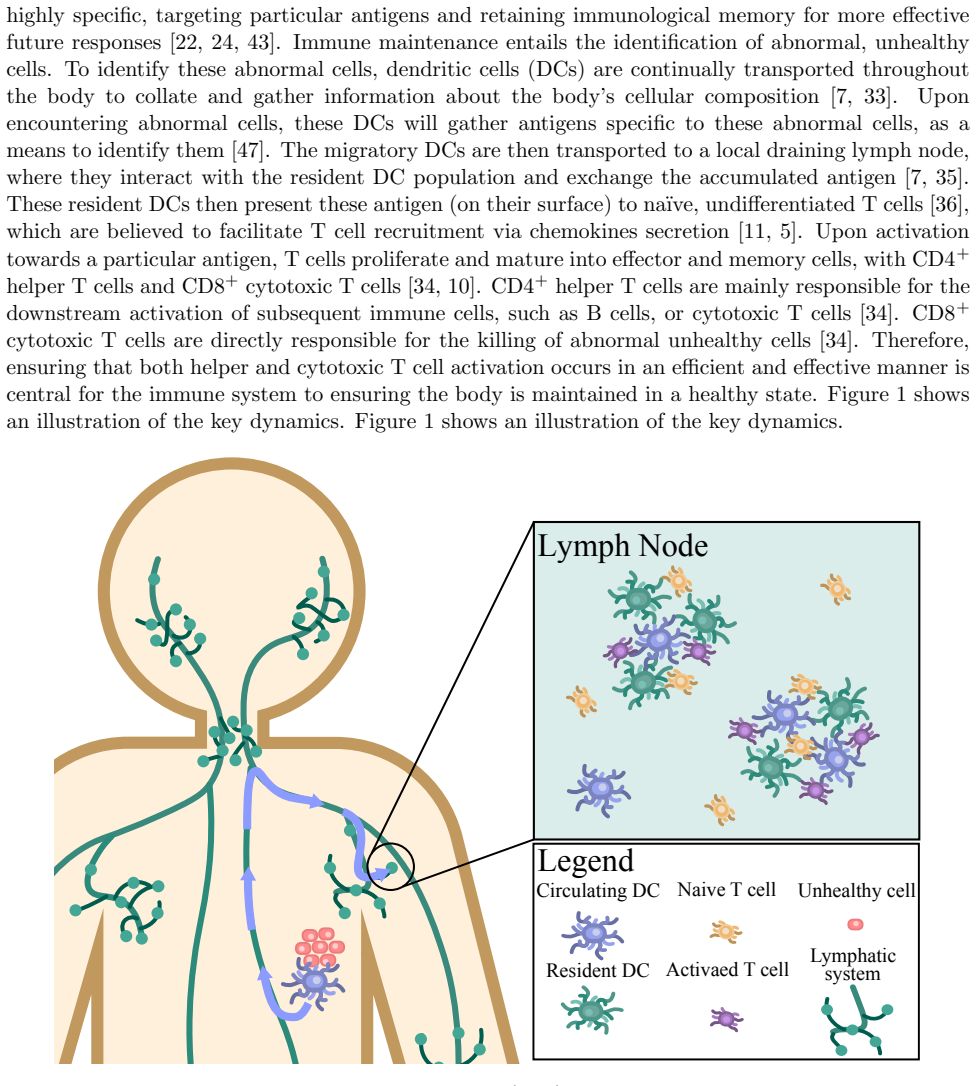
Spatial dynamic modelling to understand how dendritic cell clustering affects T cell activation
Pith reviewed 2026-05-10 03:46 UTC · model grok-4.3
The pith
T cells with intermediate stimulation uptake gain most from dendritic cell clustering in lymph nodes.
A machine-rendered reading of the paper's core claim, the machinery that carries it, and where it could break.
Core claim
The central claim is that T cells with an intermediate level of stimulation uptake benefit most from higher levels of dendritic cell clustering. These cells activate with a comparable or greater abundance and greater heterogeneity in their stimulation distribution, compared with T cells of similar characteristics exposed to lower levels of dendritic cell clustering. The approximations derived from the phenotypically structured PDE also allow identification of T cell characteristics that produce rapid activation and robust heterogeneous activation.
What carries the argument
Analytic approximations of the expected T cell stimulation distribution, derived from the topology and level of dendritic cell clustering via a phenotypically structured partial differential equation obtained from a probabilistic agent-based model.
If this is right
- Dendritic cell spatial organization in lymph nodes can selectively enhance T cell activation for cells with intermediate stimulation uptake.
- Clustered dendritic cells produce greater heterogeneity in T cell stimulation levels for the intermediate-uptake population.
- T cell traits identified by sensitivity analysis control rapid activation and heterogeneous activation even without changes in clustering.
- The overall strength and diversity of immune responses depend on the spatial arrangement of dendritic cells.
Where Pith is reading between the lines
- The intermediate-uptake benefit may explain differences in immune effectiveness across lymph nodes with varying architectures in cancer or infection.
- Interventions that promote dendritic cell clustering could be tested to improve anti-tumor T cell responses in patients whose T cells show suboptimal uptake rates.
- The analytic approximations could be applied to predict activation patterns in other spatially structured immune settings such as infected tissues.
- Controlled experiments measuring T cell stimulation uptake in clustered versus dispersed dendritic cell setups would directly test the predicted advantage.
Load-bearing premise
The analytic approximations derived from the phenotypically structured PDE accurately capture the stochastic spatial dynamics of the underlying agent-based model for arbitrary dendritic cell clustering topologies without material loss of accuracy.
What would settle it
Agent-based model simulations with high versus low dendritic cell clustering that show no increase in activation abundance or heterogeneity for intermediate-uptake T cells relative to low-uptake T cells.
Figures


read the original abstract
The coordination of the immune system and its components is essential for the body to maintain a healthy status. Recent clinical studies show that breast cancer patients with high Dendritic cell clustering in tumour draining lymph nodes have improved survival outcomes, compared to those with a lower degree of clustering. These results suggest that a specific form of Dendritic cell clustering promotes T cell activation. However, the mechanistic effects of this spatial organisation is unclear. We develop a spatially dynamic model of T cells interacting with Dendritic cells within the lymph node. We present a novel probabilistic agent-based model (ABM) of T cells, and use it to derive the deterministic, phenotypically structured partial differential equation (PS-PDE) of T cell activation and motion. Using the PS-PDE, we derive analytic approximations of the expected T cell stimulation distribution, based on the topology and level of clustering of a given Dendritic cell population. Our analytic approximation enables us to identify T cell characteristics that benefit most from Dendritic cell clustering, to result in an enhanced stimulation distribution. We also perform a sensitivity analysis with our models to identify T cell characteristics that result in desirable T cell activation characteristics, such as rapid T cell activation, and robust heterogeneous T cell activation. Our key findings show that T cells with an intermediate level of stimulation uptake benefit most from higher levels of Dendritic cell clustering, activating with a comparable or greater abundance, and greater heterogeneity, when compared to T cells of a similar characteristic but with a lower level of Dendritic cell clustering.
Editorial analysis
A structured set of objections, weighed in public.
Referee Report
Summary. The manuscript develops a probabilistic agent-based model (ABM) of T-cell interactions with dendritic cells (DCs) in lymph nodes, derives a deterministic phenotypically structured PDE (PS-PDE) as its continuum limit, and obtains closed-form analytic approximations for the expected T-cell stimulation distribution as a function of DC clustering topology and level. The central claim is that T cells with an intermediate stimulation-uptake rate activate with comparable or greater abundance and greater heterogeneity under high DC clustering than under low clustering.
Significance. If the analytic approximations remain faithful to the underlying stochastic spatial dynamics, the work supplies a mechanistic account of why elevated DC clustering in tumor-draining lymph nodes correlates with improved clinical outcomes and identifies a specific T-cell phenotype that is preferentially advantaged by that spatial organization. The modeling pipeline (ABM → PS-PDE → analytic approximation) also offers a computationally inexpensive route to explore how lymph-node architecture modulates immune activation.
major comments (2)
- [§4] §4 (analytic approximation derivation): the closed-form expressions for the stimulation distribution are obtained from the deterministic PS-PDE under a mean-field closure that discards local density fluctuations and discrete encounter stochasticity; no quantitative error bounds or direct comparison to ABM histograms are supplied for the high-clustering topologies that are central to the clinical motivation.
- [Results] Results, stimulation-distribution figures: the identification of the 'intermediate' uptake regime as optimal rests entirely on the analytic approximations; without side-by-side ABM validation for the same clustering parameters, it is unclear whether the reported gains in abundance and heterogeneity survive the stochastic spatial correlations that the PS-PDE limit is expected to suppress.
minor comments (2)
- Notation for the stimulation-uptake parameter is introduced without an explicit symbol table; readers must infer its meaning from the surrounding text.
- Figure captions for the clustering topologies do not state the precise values of the clustering parameter used in the analytic versus ABM panels.
Simulated Author's Rebuttal
We thank the referee for the constructive and detailed feedback. The comments highlight important aspects of validation for the analytic approximations, which we address point by point below. We agree that additional direct comparisons will strengthen the manuscript and plan to incorporate them in the revision.
read point-by-point responses
-
Referee: [§4] §4 (analytic approximation derivation): the closed-form expressions for the stimulation distribution are obtained from the deterministic PS-PDE under a mean-field closure that discards local density fluctuations and discrete encounter stochasticity; no quantitative error bounds or direct comparison to ABM histograms are supplied for the high-clustering topologies that are central to the clinical motivation.
Authors: We acknowledge that the closed-form expressions rely on the mean-field PS-PDE limit. Although the PS-PDE is rigorously derived as the continuum limit of the ABM, we agree that quantitative validation against the stochastic ABM is needed for high-clustering cases. In the revised manuscript we will add direct comparisons of analytic stimulation distributions to ABM histograms for representative high-clustering topologies, including quantitative error measures such as total variation distance and Kullback-Leibler divergence between the two. revision: yes
-
Referee: [Results] Results, stimulation-distribution figures: the identification of the 'intermediate' uptake regime as optimal rests entirely on the analytic approximations; without side-by-side ABM validation for the same clustering parameters, it is unclear whether the reported gains in abundance and heterogeneity survive the stochastic spatial correlations that the PS-PDE limit is expected to suppress.
Authors: The referee is correct that the identification of the intermediate-uptake regime as optimal is currently supported only by the analytic results. To confirm that the reported advantages in activation abundance and heterogeneity persist under stochastic spatial correlations, we will include side-by-side ABM versus analytic comparisons in the Results section for both low- and high-clustering regimes, with explicit focus on the intermediate-uptake parameter range. revision: yes
Circularity Check
No circularity: derivation proceeds from explicit ABM to PS-PDE to analytic approximations without self-referential reduction
full rationale
The paper constructs a probabilistic ABM, derives the deterministic PS-PDE as its continuum limit, and then obtains closed-form analytic approximations for the expected stimulation distribution from the PS-PDE. These steps are presented as successive mathematical reductions rather than parameter fits, self-definitions, or renamings of inputs. No load-bearing self-citations, uniqueness theorems imported from prior author work, or ansatzes smuggled via citation appear in the abstract or described chain. The central claim—that intermediate-uptake T cells benefit most from clustering—arises from comparing the derived expressions across different DC topologies, not from any quantity being defined in terms of its own output. The skeptic concern about approximation fidelity is a question of accuracy, not circularity.
Axiom & Free-Parameter Ledger
Reference graph
Works this paper leans on
-
[1]
A hybrid discrete– continuum modelling approach to explore the impact of T-cell infiltration on anti-tumour im- mune response
Luis Almeida, Chloe Audebert, Emma Leschiera, and Tommaso Lorenzi. “A hybrid discrete– continuum modelling approach to explore the impact of T-cell infiltration on anti-tumour im- mune response”. In:Bulletin of Mathematical Biology84.12 (2022), p. 141
2022
-
[2]
Role of T cell-to-dendritic cell chemoattraction in T cell priming initiation in the lymph node: An agent-based modeling study
Ivan Azarov, Kirill Peskov, Gabriel Helmlinger, and Yuri Kosinsky. “Role of T cell-to-dendritic cell chemoattraction in T cell priming initiation in the lymph node: An agent-based modeling study”. In:Frontiers in immunology10 (2019), p. 1289
2019
-
[3]
Heterogeneous CD8+ T cell migration in the lymph node in the absence of inflamma- tion revealed by quantitative migration analysis
Edward J Banigan, Tajie H Harris, David A Christian, Christopher A Hunter, and Andrea J Liu. “Heterogeneous CD8+ T cell migration in the lymph node in the absence of inflamma- tion revealed by quantitative migration analysis”. In:PLoS computational biology11.2 (2015), e1004058
2015
-
[4]
Lymph node topology dictates T cell migration behavior
Joost B Beltman, Athanasius FM Mar´ ee, Jennifer N Lynch, Mark J Miller, and Rob J De Boer. “Lymph node topology dictates T cell migration behavior”. In:The Journal of experimental medicine204.4 (2007), pp. 771–780
2007
-
[5]
Cutting edge: cognate CD4 help pro- motes recruitment of antigen-specific CD8 T cells around dendritic cells
H´ elene Beuneu, Zacarias Garcia, and Philippe Bousso. “Cutting edge: cognate CD4 help pro- motes recruitment of antigen-specific CD8 T cells around dendritic cells”. In:The Journal of Immunology177.3 (2006), pp. 1406–1410
2006
-
[6]
On-lattice simulation of T cell motility, chemotaxis, and traf- ficking in the lymph node paracortex
Gib Bogle and P Rod Dunbar. “On-lattice simulation of T cell motility, chemotaxis, and traf- ficking in the lymph node paracortex”. In: (2012)
2012
-
[7]
Generation, migration and function of circulating dendritic cells
Roberto Bonasio and Ulrich H von Andrian. “Generation, migration and function of circulating dendritic cells”. In:Current opinion in immunology18.4 (2006), pp. 503–511
2006
-
[8]
T-cell activation by dendritic cells in the lymph node: lessons from the movies
Philippe Bousso. “T-cell activation by dendritic cells in the lymph node: lessons from the movies”. In:Nature Reviews Immunology8.9 (2008), pp. 675–684
2008
-
[9]
Dynamics of CD8+ T cell priming by dendritic cells in intact lymph nodes
Philippe Bousso and Ellen Robey. “Dynamics of CD8+ T cell priming by dendritic cells in intact lymph nodes”. In:Nature immunology4.6 (2003), pp. 579–585
2003
-
[10]
T cell fate at the single-cell level
Veit R Buchholz, Ton NM Schumacher, and Dirk H Busch. “T cell fate at the single-cell level”. In:Annual review of immunology34.1 (2016), pp. 65–92
2016
-
[11]
Chemokines enhance immunity by guiding naive CD8+ T cells to sites of CD4+ T cell–dendritic cell interaction
Flora Castellino, Alex Y Huang, Gr´ egoire Altan-Bonnet, Sabine Stoll, Clemens Scheinecker, and Ronald N Germain. “Chemokines enhance immunity by guiding naive CD8+ T cells to sites of CD4+ T cell–dendritic cell interaction”. In:Nature440.7086 (2006), pp. 890–895
2006
-
[12]
Mathematics in modern immunology
Mario Castro, Grant Lythe, Carmen Molina-Paris, and Ruy M Ribeiro. “Mathematics in modern immunology”. In:Interface focus6.2 (2016), p. 20150093
2016
-
[13]
How many dendritic cells are required to initiate a T-cell response?
Susanna Celli, Mark Day, Andreas J M¨ uller, Carmen Molina-Paris, Grant Lythe, and Philippe Bousso. “How many dendritic cells are required to initiate a T-cell response?” In:Blood, The Journal of the American Society of Hematology120.19 (2012), pp. 3945–3948
2012
-
[14]
Andrew Y. Chang, Nupur Bhattacharya, Jian Mu, A Francesca Setiadi, Valeria Carcamo- Cavazos, Gerald H. Lee, Diana L Simons, Sina Yadegarynia, Kaveh Hemati, Adam Kapelner, Zheng Ming, David N. Krag, Erich J. Schwartz, Danny Z. Chen, and Lee Peter P. “Spatial organization of dendritic cells within tumor draining lymph nodes impacts clinical outcome in breas...
-
[15]
Resident dendritic cell density in the lymph node paracortex is preDC-estined
Rafael S Czepielewski and Gwendalyn J Randolph. “Resident dendritic cell density in the lymph node paracortex is preDC-estined”. In:Immunity56.8 (2023), pp. 1699–1701
2023
-
[16]
Mathematical models for immunol- ogy: current state of the art and future research directions
Raluca Eftimie, Joseph J Gillard, and Doreen A Cantrell. “Mathematical models for immunol- ogy: current state of the art and future research directions”. In:Bulletin of mathematical biology 78.10 (2016), pp. 2091–2134. 22
2016
-
[17]
Real-time analysis of T cell receptors in naive cells in vitro and in vivo reveals flexibility in synapse and signaling dynamics
Rachel S Friedman, Peter Beemiller, Caitlin M Sorensen, Jordan Jacobelli, and Matthew F Krummel. “Real-time analysis of T cell receptors in naive cells in vitro and in vivo reveals flexibility in synapse and signaling dynamics”. In:Journal of Experimental Medicine207.12 (2010), pp. 2733–2749
2010
-
[18]
Harnessing the heterogeneity of T cell differentiation fate to fine-tune generation of effector and memory T cells
Chang Gong, Jennifer J Linderman, and Denise Kirschner. “Harnessing the heterogeneity of T cell differentiation fate to fine-tune generation of effector and memory T cells”. In:Frontiers in immunology5 (2014), p. 57
2014
-
[19]
Antigen Presentation and T Cell Stimulation by Dendritic Cells
Pierre Guermonprez, Jenny Valladeau, Laurence Zitvogel, Clotilde Th´ ery, and Sebastian Amigorena. “Antigen Presentation and T Cell Stimulation by Dendritic Cells”. In:Annual Review of Im- munology20.Volume 20, 2002 (2002), pp. 621–667.issn: 1545-3278.doi:https://doi.org/ 10.1146/annurev.immunol.20.100301.064828
-
[20]
Dendritic Cell Organization and Function in Innate and Adaptive Immune Defense Within Lymph Nodes
Jessica Y Huang and Michael Y Gerner. “Dendritic Cell Organization and Function in Innate and Adaptive Immune Defense Within Lymph Nodes”. In:Immunological reviews337.1 (2026), e70071
2026
-
[21]
Control of adaptive immunity by the innate immune system
Akiko Iwasaki and Ruslan Medzhitov. “Control of adaptive immunity by the innate immune system”. In:Nature immunology16.4 (2015), pp. 343–353
2015
-
[22]
Regulation of adaptive immunity by the innate immune system
Akiko Iwasaki and Ruslan Medzhitov. “Regulation of adaptive immunity by the innate immune system”. In:science327.5963 (2010), pp. 291–295
2010
-
[23]
Lymph node swelling combined with temporary effector T cell retention aids T cell response in a model of adaptive immunity
Sarah C Johnson, Jennifer Frattolin, Lowell T Edgar, Mohammad Jafarnejad, and James E Moore Jr. “Lymph node swelling combined with temporary effector T cell retention aids T cell response in a model of adaptive immunity”. In:Journal of the Royal Society Interface18.185 (2021), p. 20210464
2021
-
[24]
A brief review of the basics of immunology: the innate and adaptive response
Melissa A Kennedy. “A brief review of the basics of immunology: the innate and adaptive response”. In:Veterinary Clinics: Small Animal Practice40.3 (2010), pp. 369–379
2010
-
[25]
T cell migration, search strate- gies and mechanisms
Matthew F Krummel, Frederic Bartumeus, and Audrey G´ erard. “T cell migration, search strate- gies and mechanisms”. In:Nature Reviews Immunology16.3 (2016), pp. 193–201
2016
-
[26]
Mature dendritic cells may promote high-avidity tuning of vaccine T cell resp onses
Adarsh Kumbhari, Colt A Egelston, Peter P Lee, and Peter S Kim. “Mature dendritic cells may promote high-avidity tuning of vaccine T cell resp onses”. In:Frontiers in Immunology11 (2020), p. 584680
2020
-
[27]
Phenotype structuring in collective cell migration: a tutorial of mathematical models and methods
Tommaso Lorenzi, Kevin J Painter, and Chiara Villa. “Phenotype structuring in collective cell migration: a tutorial of mathematical models and methods”. In:Journal of Mathematical Biology 90.6 (2025), p. 61
2025
-
[28]
T-cell priming by den- dritic cells in lymph nodes occurs in three distinct phases
Thorsten R Mempel, Sarah E Henrickson, and Ulrich H Von Andrian. “T-cell priming by den- dritic cells in lymph nodes occurs in three distinct phases”. In:Nature427.6970 (2004), pp. 154– 159
2004
-
[29]
A virtual lymph node model to dissect the requirements for T-cell activation by synapses and kinapses
H´ el` ene D Moreau, Gib Bogle, and Philippe Bousso. “A virtual lymph node model to dissect the requirements for T-cell activation by synapses and kinapses”. In:Immunology and cell biology 94.7 (2016), pp. 680–688
2016
-
[30]
A phenotype-structured mathematical model for the influence of hypoxia on oncolytic virotherapy
David Morselli, Giulia Chiari, Federico Frascoli, and Marcello E Delitala. “A phenotype-structured mathematical model for the influence of hypoxia on oncolytic virotherapy”. In:arXiv preprint arXiv:2411.02413(2024)
-
[31]
T cell migration in intact lymph nodes in vivo
Marcia A Munoz, Mate Biro, and Wolfgang Weninger. “T cell migration in intact lymph nodes in vivo”. In:Current opinion in cell biology30 (2014), pp. 17–24
2014
-
[32]
Topological small-world organization of the fibroblastic reticular cell network determines lymph node functionality
Mario Novkovic, Lucas Onder, Jovana Cupovic, Jun Abe, David Bomze, Viviana Cremasco, Elke Scandella, Jens V Stein, Gennady Bocharov, Shannon J Turley, et al. “Topological small-world organization of the fibroblastic reticular cell network determines lymph node functionality”. In: PLoS biology14.7 (2016), e1002515. 23
2016
-
[33]
CD8+ T cell differentiation and dysfunction in cancer
Mary Philip and Andrea Schietinger. “CD8+ T cell differentiation and dysfunction in cancer”. In:Nature Reviews Immunology22.4 (2022), pp. 209–223
2022
-
[34]
A guide to antigen processing and presentation
Novalia Pishesha, Thibault J Harmand, and Hidde L Ploegh. “A guide to antigen processing and presentation”. In:Nature Reviews Immunology22.12 (2022), pp. 751–764
2022
-
[35]
Dendritic cell migration through the lymphatic vasculature to lymph nodes
Andrew M Platt and Gwendalyn J Randolph. “Dendritic cell migration through the lymphatic vasculature to lymph nodes”. In:Advances in immunology120 (2013), pp. 51–68
2013
-
[36]
Dendritic-cell trafficking to lymph nodes through lymphatic vessels
Gwendalyn J Randolph, Veronique Angeli, and Melody A Swartz. “Dendritic-cell trafficking to lymph nodes through lymphatic vessels”. In:Nature Reviews Immunology5.8 (2005), pp. 617– 628
2005
-
[37]
A comparison of random vs. chemotaxis-driven contacts of T cells with dendritic cells during repertoire scanning
Thomas Riggs, Adrienne Walts, Nicolas Perry, Laura Bickle, Jennifer N Lynch, Amy Myers, Joanne Flynn, Jennifer J Linderman, Mark J Miller, and Denise E Kirschner. “A comparison of random vs. chemotaxis-driven contacts of T cells with dendritic cells during repertoire scanning”. In:Journal of theoretical biology250.4 (2008), pp. 732–751
2008
-
[38]
Why must T cells be cross-reactive?
Andrew K Sewell. “Why must T cells be cross-reactive?” In:Nature Reviews Immunology12.9 (2012), pp. 669–677
2012
-
[39]
Homeostatic lym- phoid chemokines synergize with adhesion ligands to trigger T and B lymphocyte chemokinesis
Agnieszka N Stachowiak, Yana Wang, Yen-Chen Huang, and Darrell J Irvine. “Homeostatic lym- phoid chemokines synergize with adhesion ligands to trigger T and B lymphocyte chemokinesis”. In:The Journal of Immunology177.4 (2006), pp. 2340–2348
2006
-
[40]
T cell egress via lymphatic vessels is tuned by antigen encounter and limits tumor control
Maria M Steele, Abhinav Jaiswal, Ines Delclaux, Ian D Dryg, Dhaarini Murugan, Julia Femel, Sunny Son, Haley du Bois, Cameron Hill, Sancy A Leachman, et al. “T cell egress via lymphatic vessels is tuned by antigen encounter and limits tumor control”. In:Nature immunology24.4 (2023), pp. 664–675
2023
-
[41]
Tolerogenic dendritic cells
Ralph M Steinman, Daniel Hawiger, and Michel C Nussenzweig. “Tolerogenic dendritic cells”. In:Annual review of immunology21.1 (2003), pp. 685–711.issn: 1545-3278
2003
-
[42]
Random migration and signal integration promote rapid and robust T cell recruitment
Johannes Textor, Sarah E Henrickson, Judith N Mandl, Ulrich H Von Andrian, J¨ urgen Wester- mann, Rob J De Boer, and Joost B Beltman. “Random migration and signal integration promote rapid and robust T cell recruitment”. In:PLoS computational biology10.8 (2014), e1003752
2014
-
[43]
A brief outline of the immune system
Namrata Tomar and Rajat K De. “A brief outline of the immune system”. In:Immunoinfor- matics. Springer, 2014, pp. 3–12
2014
-
[44]
The serial engagement model 17 years after: from TCR triggering to im- munotherapy
Salvatore Valitutti. “The serial engagement model 17 years after: from TCR triggering to im- munotherapy”. In:Frontiers in immunology3 (2012), p. 272
2012
-
[45]
Chemo- tactic migration of T cells towards dendritic cells promotes the detection of rare antigens
Renske MA Vroomans, Athanasius FM Mar´ ee, Rob J De Boer, and Joost B Beltman. “Chemo- tactic migration of T cells towards dendritic cells promotes the detection of rare antigens”. In: PLOS Computational Biology8.11 (2012), e1002763
2012
-
[46]
A single autoimmune T cell receptor recognizes more than a million different peptides
Linda Wooldridge, Julia Ekeruche-Makinde, Hugo a Van Den Berg, Anna Skowera, John J Miles, Mai Ping Tan, Garry Dolton, Mathew Clement, Sian Llewellyn-Lacey, David A Price, et al. “A single autoimmune T cell receptor recognizes more than a million different peptides”. In:Journal of Biological Chemistry287.2 (2012), pp. 1168–1177
2012
-
[47]
Dendritic cell migration in health and disease
Tim Worbs, Swantje I Hammerschmidt, and Reinhold F¨ orster. “Dendritic cell migration in health and disease”. In:Nature Reviews Immunology17.1 (2017), pp. 30–48. 24 Supplementary Information: Spatial dynamic modelling to understand how dendritic cell clustering affects T cell activation Domenic P.J. Germano 1,3, Federico Frascoli 2, Robyn P. Araujo 3, Pet...
2017
discussion (0)
Sign in with ORCID, Apple, or X to comment. Anyone can read and Pith papers without signing in.