Recognition: unknown
FASE : A Fairness-Aware Spatiotemporal Event Graph Framework for Predictive Policing
Pith reviewed 2026-05-10 06:01 UTC · model grok-4.3
The pith
Fairness constraints on patrol allocation alone leave a persistent detection gap in predictive policing simulations.
A machine-rendered reading of the paper's core claim, the machinery that carries it, and where it could break.
Core claim
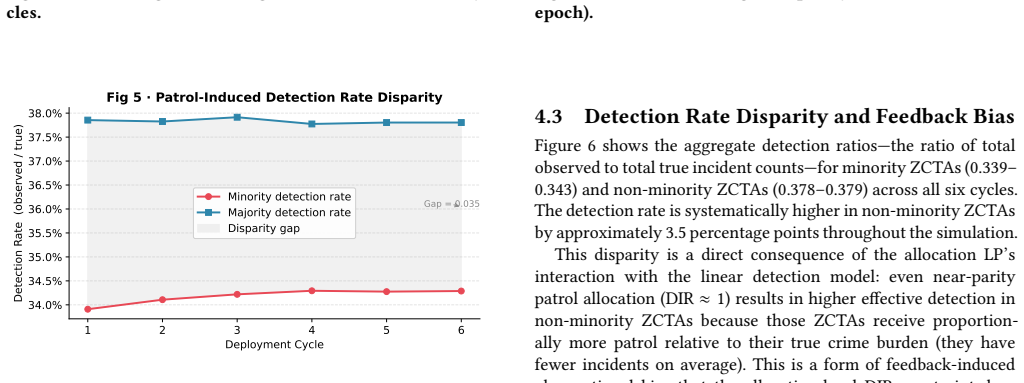
The FASE framework combines a spatiotemporal graph neural network and multivariate Hawkes process to forecast crime counts modeled as zero-inflated negative binomial distributions, then solves a linear program that maximizes risk-weighted patrol coverage subject to a Demographic Impact Ratio constraint with 0.05 deviation bound. Across six closed-loop deployment cycles on 2017-2019 Baltimore data, the ratio stays between 0.9928 and 1.0262 and coverage between 0.876 and 0.936, yet the detection-rate gap between minority and non-minority areas remains approximately 3.5 percentage points, showing that allocation-level constraints do not remove feedback-induced bias from retraining data.
What carries the argument
The closed-loop deployment feedback simulator that generates new training data from the outcomes of fairness-constrained patrol allocations and feeds it back into model retraining.
Load-bearing premise
The simulator's model of how patrol decisions and crime reporting produce feedback-driven changes in the data used for retraining matches real-world police and public behavior.
What would settle it
Running the fairness-constrained allocation rules in actual Baltimore policing operations and checking whether the 3.5-point detection-rate gap narrows after several retraining cycles.
Figures


read the original abstract
Predictive policing systems that allocate patrol resources based solely on predicted crime risk can unintentionally amplify racial disparities through feedback driven data bias. We present FASE, a Fairness Aware Spatiotemporal Event Graph framework, which integrates spatiotemporal crime prediction with fairness constrained patrol allocation and a closed loop deployment feedback simulator. We model Baltimore as a graph of 25 ZIP Code Tabulation Areas and use 139,982 Part 1 crime incidents from 2017 to 2019 at hourly resolution, producing a sparse feature tensor. The prediction module combines a spatiotemporal graph neural network with a multivariate Hawkes process to capture spatial dependencies and self exciting temporal dynamics. Outputs are modeled using a Zero Inflated Negative Binomial distribution, suitable for overdispersed and zero heavy crime counts. The model achieves a validation loss of 0.4800 and a test loss of 0.4857. Patrol allocation is formulated as a fairness constrained linear optimization problem that maximizes risk weighted coverage while enforcing a Demographic Impact Ratio constraint with deviation bounded by 0.05. Across six simulated deployment cycles, fairness remains within 0.9928 to 1.0262, and coverage ranges from 0.876 to 0.936. However, a persistent detection rate gap of approximately 3.5 percentage points remains between minority and non minority areas. This result shows that allocation level fairness constraints alone do not eliminate feedback induced bias in retraining data, highlighting the need for fairness interventions across the full pipeline.
Editorial analysis
A structured set of objections, weighed in public.
Referee Report
Summary. The paper claims to introduce the FASE framework for predictive policing, which uses a spatiotemporal graph neural network combined with a multivariate Hawkes process to model crime events in Baltimore based on 139,982 incidents from 2017-2019. It formulates patrol allocation as a linear optimization problem with a fairness constraint on the Demographic Impact Ratio (deviation ≤ 0.05), and employs a closed-loop simulator to run six deployment cycles. The results indicate that fairness is maintained between 0.9928 and 1.0262 with coverage from 0.876 to 0.936, but a 3.5 percentage point gap in detection rates between minority and non-minority areas persists, suggesting that allocation-level fairness constraints do not fully eliminate feedback-induced bias in retraining data.
Significance. If the closed-loop simulator accurately reflects real-world dynamics of patrol allocation influencing crime reporting and data bias, this work would be significant for demonstrating the insufficiency of isolated fairness interventions at the resource allocation stage in predictive policing. It provides a concrete example of how feedback loops can perpetuate disparities even under fairness constraints, advocating for comprehensive pipeline approaches. The integration of GNN and Hawkes process for spatiotemporal prediction is a technical contribution, but the overall impact is tempered by the lack of real-world validation.
major comments (3)
- [Simulation Results] The central claim that allocation-level fairness constraints alone do not eliminate feedback-induced bias rests on the observation of a persistent ~3.5pp detection-rate gap across six simulated deployment cycles. The manuscript provides no details on the simulator's mapping from patrol allocation to subsequent crime reporting rates, detection mechanics, or label generation for retraining data, nor any sensitivity analysis on parameters such as the 0.05 deviation bound or reporting elasticity.
- [Prediction Model] The prediction module reports a validation loss of 0.4800 and test loss of 0.4857 using a spatiotemporal GNN + Hawkes process with Zero-Inflated Negative Binomial outputs, but the manuscript supplies no information on data splits, hyperparameter search, or baseline comparisons. This information is required to establish that the risk predictions feeding into the fairness-constrained allocation are reliable and not themselves contributing to the observed gap.
- [Fairness Constraint Formulation] The Demographic Impact Ratio constraint (deviation bounded by 0.05) is presented as keeping fairness in [0.9928, 1.0262] while coverage ranges from 0.876 to 0.936, yet the manuscript does not specify how the 0.05 bound was chosen or demonstrate that the 3.5pp gap is robust to reasonable variations in this hyperparameter.
minor comments (3)
- The term 'Part 1 crime incidents' is used without definition or reference to its standard classification in the Baltimore dataset.
- Explicit mathematical notation for the sparse feature tensor, the Zero-Inflated Negative Binomial parameterization, and the Demographic Impact Ratio would improve clarity.
- A table summarizing all simulator parameters, their values, and justification would aid reproducibility.
Simulated Author's Rebuttal
We thank the referee for their thoughtful and constructive comments. We agree that greater transparency on the simulator mechanics, prediction evaluation protocol, and fairness hyperparameter choices will strengthen the manuscript. We provide point-by-point responses below and will incorporate the requested clarifications and analyses in the revision.
read point-by-point responses
-
Referee: The manuscript provides no details on the simulator's mapping from patrol allocation to subsequent crime reporting rates, detection mechanics, or label generation for retraining data, nor any sensitivity analysis on parameters such as the 0.05 deviation bound or reporting elasticity.
Authors: We appreciate this observation. The current manuscript describes the closed-loop simulator at a high level but does not fully specify the functional mappings or parameter sensitivities. In the revised version we will add an expanded methods subsection that details the assumed relationships between patrol density and reporting/detection rates, the process for generating retraining labels from simulated detections, and a sensitivity analysis that varies the deviation bound and reporting elasticity parameters while tracking the persistence of the detection-rate gap. revision: yes
-
Referee: The prediction module reports a validation loss of 0.4800 and test loss of 0.4857 using a spatiotemporal GNN + Hawkes process with Zero-Inflated Negative Binomial outputs, but the manuscript supplies no information on data splits, hyperparameter search, or baseline comparisons.
Authors: We acknowledge the omission. The revised manuscript will include a dedicated evaluation subsection that describes the temporal data-splitting strategy employed to respect the time-series structure, the hyperparameter search procedure, and quantitative comparisons against relevant baselines (standard multivariate Hawkes process and non-graph spatiotemporal models). These additions will better substantiate that the risk predictions supplied to the allocation module are reliable. revision: yes
-
Referee: The Demographic Impact Ratio constraint (deviation bounded by 0.05) is presented as keeping fairness in [0.9928, 1.0262] while coverage ranges from 0.876 to 0.936, yet the manuscript does not specify how the 0.05 bound was chosen or demonstrate that the 3.5pp gap is robust to reasonable variations in this hyperparameter.
Authors: We selected the 0.05 bound to enforce a tight but operationally feasible fairness tolerance. The revision will explicitly state this rationale and add a supplementary experiment that re-runs the six-cycle simulation under alternative bounds (e.g., 0.03 and 0.07) to confirm that the observed detection-rate gap remains stable across reasonable choices of the hyperparameter. revision: yes
Circularity Check
No significant circularity detected; results derive from independent simulation run
full rationale
The paper constructs a prediction model (STGNN + Hawkes + ZINB) on real Baltimore crime data, solves a constrained linear program for allocation, and then executes a separate closed-loop simulator to generate deployment cycles and measure downstream detection gaps. The 3.5pp gap is reported as an observed output of that simulator rather than being algebraically identical to any fitted parameter or input definition. No self-citations, uniqueness theorems, or ansatzes are invoked to force the central claim, and no equation reduces the fairness-bias conclusion to a tautology. The simulation is therefore an independent (if unvalidated) experimental apparatus, keeping the derivation self-contained.
Axiom & Free-Parameter Ledger
free parameters (1)
- Demographic Impact Ratio deviation bound =
0.05
axioms (2)
- domain assumption Spatiotemporal graph neural networks combined with multivariate Hawkes processes can adequately represent spatial dependencies and temporal self-excitation in crime event data.
- domain assumption Zero-inflated negative binomial distribution is appropriate for modeling overdispersed, zero-heavy hourly crime counts.
Reference graph
Works this paper leans on
-
[1]
Kiana Alikhademi, Emma Drobina, Diandra Prioleau, Brianna Richardson, Dun- can Purves, and Juan E. Gilbert. 2022. A Review of Predictive Policing from the Perspective of Fairness.Artificial Intelligence and Law30, 1 (2022), 1–17. doi:10.1007/s10506-021-09286-4
-
[2]
Almasoud and Jamiu Adekunle Idowu
Ahmed S. Almasoud and Jamiu Adekunle Idowu. 2025. Algorithmic Fairness in Predictive Policing.AI & Ethics5, 3 (2025), 2323–2337. doi:10.1007/s43681-024- 00541-3
-
[3]
Baltimore City Open Data. 2019. Baltimore Police Department Part 1 Crime Data, 2017–2019. https://data.baltimorecity.gov Accessed 2024
2019
- [4]
-
[5]
Richard Berk, Hoda Heidari, Shahin Jabbari, Michael Kearns, and Aaron Roth
-
[6]
Fairness in Criminal Justice Risk Assessments: The State of the Art.Soci- ological Methods & Research50, 1 (2021), 3–44. doi:10.1177/0049124118782533
-
[7]
Alexandra Chouldechova. 2017. Fair Prediction with Disparate Impact: A Study of Bias in Recidivism Prediction Instruments.Big Data5, 2 (2017), 153–163. doi:10.1089/big.2016.0047
-
[8]
Julia Dressel and Hany Farid. 2018. The Accuracy, Fairness, and Limits of Pre- dicting Recidivism.Science Advances4, 1 (2018), eaao5580. doi:10.1126/sciadv. aao5580
-
[9]
Friedler, Scott Neville, Carlos Scheidegger, and Suresh Venkatasubramanian
Danielle Ensign, Sorelle A. Friedler, Scott Neville, Carlos Scheidegger, and Suresh Venkatasubramanian. 2018. Runaway Feedback Loops in Predictive Polic- ing. InProceedings of the 1st Conference on Fairness, Accountability and Trans- parency (Proceedings of Machine Learning Research, Vol. 81). PMLR, 160–171. https://proceedings.mlr.press/v81/ensign18a.html
2018
-
[10]
Andrew Guthrie Ferguson. 2017. Policing Predictive Policing.Washington Uni- versity Law Review94, 5 (2017), 1109–1189
2017
-
[11]
Diego Hernández, Elena Santos, Xavier Ferrer, and Thomas Wischmeyer. 2026. Quantifying and Mitigating Racial Bias in Predictive Policing Algorithms.Arti- ficial Intelligence and Law(2026). doi:10.1007/s10506-026-09508-7
-
[12]
Tzu-Wei Hung and Chun-Ping Yen. 2023. Predictive Policing and Algorithmic Fairness: An Analysis of Philosophical Foundations.Synthese201, 6 (2023), 206. doi:10.1007/s11229-023-04189-0
-
[13]
Hyemi Kim, Seungjae Shin, Joon Ho Jang, Kyungwoo Song, Weonyoung Joo, Wanmo Kang, and Il-Chul Moon. 2021. Counterfactual Fairness with Disentan- gled Causal Effect Variational Autoencoder. InProceedings of the AAAI Confer- ence on Artificial Intelligence, Vol. 35. 8128–8136
2021
-
[14]
Yaguang Li, Rose Yu, Cyrus Shahabi, and Yan Liu. 2018. Diffusion Convolu- tional Recurrent Neural Network: Data-Driven Traffic Forecasting. InInterna- tional Conference on Learning Representations (ICLR). https://openreview.net/ forum?id=SJiHXGWAZ
2018
-
[15]
Kristian Lum and William Isaac. 2016. To Predict and Serve?Significance13, 5 (2016), 14–19. doi:10.1111/j.1740-9713.2016.00960.x
-
[16]
Ninareh Mehrabi, Fred Morstatter, Nripsuta Saxena, Kristina Lerman, and Aram Galstyan. 2021. A Survey on Bias and Fairness in Machine Learning.Comput. Surveys54, 6 (2021), 1–35. doi:10.1145/3457607
-
[17]
George O. Mohler, Martin B. Short, Sean Malinowski, Mark Johnson, George E. Tita, Andrea L. Bertozzi, and P. Jeffrey Brantingham. 2015. Randomized Con- trolled Field Trials of Predictive Policing.J. Amer. Statist. Assoc.110, 512 (2015), 1399–1411. doi:10.1080/01621459.2015.1077710
-
[18]
Schultz, and Kate Crawford
Rashida Richardson, Jason M. Schultz, and Kate Crawford. 2019. Dirty Data, Bad Predictions: How Civil Rights Violations Impact Police Data, Predictive Policing Systems, and Justice.New York University Law Review Online94 (2019), 15–55. https://www.nyulawreview.org/online-features/dirty-data-bad-predictions/
2019
-
[19]
Andrew D. Selbst, danah boyd, Sorelle A. Friedler, Suresh Venkatasubramanian, and Janet Vertesi. 2019. Fairness and Abstraction in Sociotechnical Systems. InProceedings of the Conference on Fairness, Accountability, and Transparency (FAT*). ACM, 59–68. doi:10.1145/3287560.3287598
-
[20]
Samin Semsar, Kiran Laxmikant Prabhu, Gabriella Waters, and James Foulds
-
[21]
https://arxiv.org/abs/2602.02566
A Comparative Simulation Study of the Fairness and Accuracy of Predic- tive Policing Systems in Baltimore City.arXiv preprint arXiv:2602.02566(2026). https://arxiv.org/abs/2602.02566
-
[22]
Census Bureau
U.S. Census Bureau. 2022. American Community Survey 5-Year Estimates, 2019. https://www.census.gov/programs-surveys/acs Accessed 2024
2022
-
[23]
Caroline Wang, Bin Han, Bhrij Patel, and Cynthia Rudin. 2023. In Pursuit of Interpretable, Fair and Accurate Machine Learning for Criminal Recidivism Pre- diction.Journal of Quantitative Criminology39, 2 (2023), 519–581
2023
- [24]
-
[25]
Tao Wang, Peng Chen, and Miaoxuan Shan. 2025. Crime Spatiotemporal Predic- tion Through Urban Region Representation by Using Building Footprints.Big Data and Cognitive Computing9, 12 (2025), 301
2025
- [26]
-
[27]
Zonghan Wu, Shirui Pan, Guodong Chen, Guodong Long, Chengqi Zhang, and Philip S. Yu. 2019. Graph WaveNet for Deep Spatial-Temporal Graph Modeling. InProceedings of the 28th International Joint Conference on Artificial Intelligence (IJCAI-19). 1907–1913. doi:10.24963/ijcai.2019/264
-
[28]
Junzhe Zhang and Elias Bareinboim. 2018. Fairness in Decision-Making—The Causal Explanation Formula. InProceedings of the AAAI Conference on Artificial Intelligence, Vol. 32
2018
-
[29]
Marta Ziosi and Dasha Pruss. 2024. Evidence of What, for Whom? The Socially Contested Role of Algorithmic Bias in a Predictive Policing Tool. InProceedings of the 2024 ACM Conference on Fairness, Accountability, and Transparency. ACM, 1596–1608
2024
discussion (0)
Sign in with ORCID, Apple, or X to comment. Anyone can read and Pith papers without signing in.