Recognition: unknown
Beyond One Output: Visualizing and Comparing Distributions of Language Model Generations
Pith reviewed 2026-05-10 04:02 UTC · model grok-4.3
The pith
GROVE represents multiple language model generations as overlapping paths in a text graph to expose hidden distributional structures.
A machine-rendered reading of the paper's core claim, the machinery that carries it, and where it could break.
Core claim
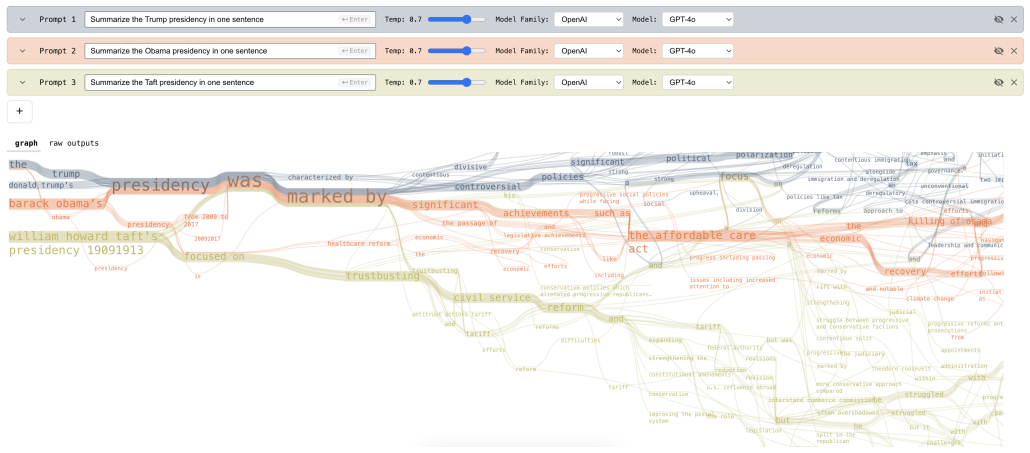
We introduce GROVE as an interactive visualization that represents multiple LM generations as overlapping paths through a text graph, revealing shared structure, branching points, and clusters while preserving access to raw outputs. Formative research with LM researchers informed the design, and three crowdsourced studies targeting distributional tasks support a hybrid workflow: graph summaries improve structural judgments such as assessing diversity, while direct output inspection remains stronger for detail-oriented questions.
What carries the argument
GROVE, the interactive visualization system that models LM outputs as paths in a text graph to show overlaps and divergences.
Load-bearing premise
The tasks and participant pools in the three crowdsourced user studies sufficiently represent the real-world needs and behaviors of researchers and practitioners who use language models for open-ended tasks.
What would settle it
If a controlled experiment finds that users perform no better at distributional tasks with GROVE than with standard single-output interfaces, the value of the graph visualization would be questioned.
Figures


read the original abstract
Users typically interact with and evaluate language models via single outputs, but each output is just one sample from a broad distribution of possible completions. This interaction hides distributional structure such as modes, uncommon edge cases, and sensitivity to small prompt changes, leading users to over-generalize from anecdotes when iterating on prompts for open-ended tasks. Informed by a formative study with researchers who use LMs (n=13) examining when stochasticity matters in practice, how they reason about distributions over language, and where current workflows break down, we introduce GROVE. GROVE is an interactive visualization that represents multiple LM generations as overlapping paths through a text graph, revealing shared structure, branching points, and clusters while preserving access to raw outputs. We evaluate across three crowdsourced user studies (N=47, 44, and 40 participants) targeting complementary distributional tasks. Our results support a hybrid workflow: graph summaries improve structural judgments such as assessing diversity, while direct output inspection remains stronger for detail-oriented questions.
Editorial analysis
A structured set of objections, weighed in public.
Referee Report
Summary. The paper introduces GROVE, an interactive visualization that renders multiple LM generations as overlapping paths in a text graph to expose distributional features such as modes, branches, and clusters while retaining access to raw text. Grounded in a formative study with 13 LM researchers, the authors evaluate GROVE via three crowdsourced user studies (N=47, 44, 40) on complementary tasks and conclude that the results support a hybrid workflow: graph summaries aid structural judgments (e.g., diversity assessment) while direct output inspection remains preferable for detail-oriented questions.
Significance. If the empirical support holds, the work addresses a practical gap in LM interfaces by making stochasticity and distributional structure visible rather than hidden behind single samples. The formative study with domain experts provides useful grounding for design choices, and the hybrid-workflow finding offers a concrete, actionable recommendation for prompt iteration and model evaluation. The graph-based approach for text distributions is a novel contribution that could influence future tooling in open-ended generation tasks.
major comments (2)
- [§5 (User Studies)] §5 (User Studies): The three crowdsourced evaluations (N=47/44/40) lack reported details on statistical methods, effect sizes, participant demographics, screening criteria, or raw data/analysis code. Because the central hybrid-workflow claim rests entirely on these studies showing graph summaries improving structural judgments, the moderate evidence strength cannot be fully assessed without this information.
- [§3 (Formative Study) and §5] §3 (Formative Study) and §5: No validation or discussion is provided on whether the crowdsourced participants' reasoning patterns, domain knowledge, or task behaviors align with the n=13 researchers from the formative study. If crowd workers treat the tasks as abstract puzzles rather than real prompt-engineering workflows, the measured advantages for GROVE on diversity and structural tasks may not generalize to the target practitioner population, which is load-bearing for the recommended hybrid interface.
minor comments (2)
- [Figure 3] Figure 3 (or equivalent visualization figure): Adding explicit callouts or legends for shared prefixes, branching points, and cluster boundaries would improve readability for readers new to the graph representation.
- [Discussion] The paper could more explicitly discuss limitations of the crowdsourced setup and potential differences from expert users in the discussion or limitations section.
Simulated Author's Rebuttal
We thank the referee for their constructive feedback, which highlights key areas for improving the transparency and generalizability of our user studies. We address each major comment below, indicating the revisions we will make to the manuscript.
read point-by-point responses
-
Referee: §5 (User Studies): The three crowdsourced evaluations (N=47/44/40) lack reported details on statistical methods, effect sizes, participant demographics, screening criteria, or raw data/analysis code. Because the central hybrid-workflow claim rests entirely on these studies showing graph summaries improving structural judgments, the moderate evidence strength cannot be fully assessed without this information.
Authors: We agree that these details are necessary for readers to fully assess the evidence. In the revised manuscript, we will expand §5 with a new subsection on study methodology and analysis. This will include: (1) full description of statistical methods (e.g., specific tests, p-values, and corrections), (2) effect sizes for all key comparisons, (3) participant demographics (age, gender, education, LM usage frequency), (4) screening criteria (attention checks, platform qualifications), and (5) a link to anonymized raw data and analysis code in a public repository. These additions will directly support evaluation of the hybrid-workflow findings. revision: yes
-
Referee: §3 (Formative Study) and §5: No validation or discussion is provided on whether the crowdsourced participants' reasoning patterns, domain knowledge, or task behaviors align with the n=13 researchers from the formative study. If crowd workers treat the tasks as abstract puzzles rather than real prompt-engineering workflows, the measured advantages for GROVE on diversity and structural tasks may not generalize to the target practitioner population, which is load-bearing for the recommended hybrid interface.
Authors: We acknowledge this limitation in generalizability. The revised manuscript will add explicit discussion in §5 and the limitations section comparing the two participant groups. We will explain how task designs were derived from formative study insights to approximate real workflows, report available background data on crowdsourced participants, and qualify the hybrid-workflow recommendation as based on complementary but distinct populations. We will also outline plans for future expert-user validation studies. This addresses the concern without overstating current evidence. revision: partial
Circularity Check
No significant circularity; claims grounded in independent empirical studies
full rationale
The paper introduces GROVE after a formative study (n=13) and evaluates it via three new crowdsourced user studies (N=47/44/40). The central claim that graph summaries aid structural judgments while direct inspection aids detail-oriented ones is presented as a direct outcome of those fresh participant results. No mathematical derivations, fitted parameters renamed as predictions, self-definitional constructs, or load-bearing self-citations appear in the abstract or described content. The work is self-contained against external benchmarks because the reported advantages derive from the new experiments rather than reducing to prior author work or internal definitions.
Axiom & Free-Parameter Ledger
axioms (1)
- domain assumption Crowdsourced participants performing the described tasks provide reliable evidence about visualization effectiveness for LM users
invented entities (1)
-
GROVE
no independent evidence
Reference graph
Works this paper leans on
-
[1]
D. B. Acharya, K. Kuppan, and B. Divya. Agentic AI: Autonomous intelligence for complex goals: A comprehensive survey.IEEE Access, 13:18912–18936, 2025. doi: 10.1109/ACCESS.2025.3532853 1
-
[2]
D. Agarwal, M. Naaman, and A. Vashistha. Ai suggestions homogenize writing toward western styles and diminish cultural nuances. InProceed- ings of the 2025 CHI Conference on Human Factors in Computing Systems, CHI ’25, art. no. 1117, 21 pages. Association for Computing Machinery, New York, NY , USA, 2025. doi: 10.1145/3706598.3713564 1
-
[3]
I. Arawjo, C. Swoopes, P. Vaithilingam, M. Wattenberg, and E. L. Glass- man. ChainForge: A visual toolkit for prompt engineering and LLM hypothesis testing. InProceedings of the CHI Conference on Human Factors in Computing Systems, pp. 1–18. ACM, New York, NY , USA, May 2024. doi: 10.1145/3613904.3642016 2
-
[4]
B. Bach, C. Shi, N. Heulot, T. Madhyastha, T. Grabowski, and P. Dragice- vic. Time curves: Folding time to visualize patterns of temporal evolution in data.IEEE Transactions on Visualization and Computer Graphics, 22(1):559–568, Jan. 2016. doi: 10.1109/TVCG.2015.2467851 4, 13
-
[5]
Brath, A
R. Brath, A. Bradley, and D. Jonker. Visualizing LLM text style transfer: Visually dissecting how to talk like a pirate. InProceedings of the VIS Workshop on NLP meets Visualization (NLVIZ), 2023. 2
2023
-
[6]
Brath, A
R. Brath, A. Bradley, and D. Jonker. Visualizing textual distributions of repeated LLM responses to characterize LLM knowledge. InProceedings of the VIS Workshop on NLP meets Visualization (NLVIZ), 2023. 2
2023
-
[7]
Braun and V
V . Braun and V . Clarke. Using thematic analysis in psychology.Qual- itative Research in Psychology, 3(2):77–101, Jan. 2006. doi: 10.1191/ 1478088706qp063oa 3
2006
-
[8]
C. J. Brockett and W. B. Dolan. User-modifiable word lattice display for editing documents and search queries, Mar. 2015. 5
2015
-
[9]
Cheng, V
F. Cheng, V . Zouhar, S. Arora, M. Sachan, H. Strobelt, and M. El- Assady. RELIC: Investigating large language model responses using self-consistency. InProceedings of the CHI Conference on Human Fac- tors in Computing Systems, pp. 1–18. ACM, New York, NY , USA, May
-
[10]
doi: 10.1145/3613904.3641904 2
-
[11]
C. Collins, S. Carpendale, and G. Penn. Visualization of uncer- tainty in lattices to support decision-making. InProceedings of the Eurographics/IEEE-VGTC Symposium on Visualization, pp. 51–58, 2007. doi: 10.2312/VisSym/EuroVis07/051-058 2
-
[12]
Collins and G
C. Collins and G. Penn. Leveraging uncertainty visualization to enhance multilingual chat. InProceedings of the CSCW, 2006. 2
2006
-
[13]
G. W. Furnas. Generalized fisheye views. InProceedings of the SIGCHI Conference on Human Factors in Computing Systems, pp. 16–23. ACM,
-
[14]
doi: 10.1145/22627.22342 6
-
[15]
K. I. Gero, C. Swoopes, Z. Gu, J. K. Kummerfeld, and E. L. Glassman. Supporting sensemaking of large language model outputs at scale. In Proceedings of the 2024 CHI Conference on Human Factors in Computing Systems, CHI ’24, art. no. 838, 21 pages. Association for Computing Machinery, New York, NY , USA, 2024. doi: 10.1145/3613904.3642139 1, 2, 4, 5, 8
-
[16]
Z. Gu, J. Zhou, N.-E. n. Lei, J. K. Kummerfeld, M. Jasim, N. Mahyar et al. AbstractExplorer: Leveraging structure-mapping theory to enhance comparative close reading at scale. InProceedings of the 38th Annual ACM Symposium on User Interface Software and Technology, pp. 1–25. ACM, New York, NY , USA, Sept. 2025. doi: 10.1145/3746059.3747773 2
-
[17]
Hamilton
S. Hamilton. Detecting mode collapse in language models via narration. In Proceedings of the First edition of the Workshop on the Scaling Behavior of Large Language Models (SCALE-LLM 2024), pp. 65–72. Association for Computational Linguistics, St. Julian’s, Malta, 2024. doi: 10.18653/ v1/2024.scalellm-1.5 2
2024
-
[18]
Z. He, S. Naphade, and T.-H. K. Huang. Prompting in the dark: Assessing human performance in prompt engineering for data labeling when gold labels are absent. InProceedings of the 2025 CHI Conference on Human Factors in Computing Systems, pp. 1–33. ACM, New York, NY , USA, Apr
2025
-
[19]
doi: 10.1145/3706598.3714319 2
-
[20]
Heimerl, S
F. Heimerl, S. Lohmann, S. Lange, and T. Ertl. Word cloud explorer: Text analytics based on word clouds. In2014 47th Hawaii International Conference on System Sciences, pp. 1833–1842, 2014. doi: 10.1109/ HICSS.2014.231 5
2014
-
[21]
A. K. Hopkins, A. Renda, and M. Carbin. Can llms generate random numbers? evaluating llm sampling in controlled domains. InICML 2023 workshop: sampling and optimization in discrete space, 2023. 1, 8
2023
-
[22]
M. Hu, K. Wongsuphasawat, and J. Stasko. Visualizing social media con- tent with SentenTree.IEEE Transactions on Visualization and Computer Graphics, 23(1):621–630, 2017. doi: 10.1109/TVCG.2016.2598590 2
-
[23]
Jänicke, A
S. Jänicke, A. Geßner, M. Büchler, and G. Scheuermann. Visualizations for text re-use. InProceedings of the International Conference on Information Visualization Theory and Applications (IVAPP), pp. 59–70. SciTePress,
-
[24]
doi: 10.5220/0004692500590070 2, 5
-
[25]
doi:10.48550/arXiv.2510.22954 , url =
L. Jiang, Y . Chai, M. Li, M. Liu, R. Fok, N. Dziri et al. Artificial hivemind: The open-ended homogeneity of language models (and beyond), 2025. doi: 10.48550/arXiv.2510.22954 1, 2
-
[26]
Kahng, I
M. Kahng, I. Tenney, M. Pushkarna, M. X. Liu, J. Wexler, E. Reif et al. LLM comparator: Visual analytics for side-by-side evaluation of large language models. InExtended Abstracts of the CHI Conference on Human Factors in Computing Systems, pp. 1–7. ACM, New York, NY , USA, May
-
[27]
doi: 10.1145/3613905.3650755 2
-
[28]
L. Kuhn, Y . Gal, and S. Farquhar. Semantic uncertainty: Linguistic invariances for uncertainty estimation in natural language generation. In International Conference on Learning Representations, 2023. doi: 10. 48550/arXiv.2302.09664 2
work page internal anchor Pith review arXiv 2023
-
[29]
Z. Li, E. Shareghi, and N. Collier. ReasonGraph: Visualization of reason- ing methods and extended inference paths. InProceedings of the 63rd Annual Meeting of the Association for Computational Linguistics (Volume 3: System Demonstrations), pp. 140–147. Association for Computational Linguistics, 2025. doi: 10.18653/v1/2025.acl-demo.14 2
-
[30]
Z. Ma, Y . Mei, and Z. Su. Understanding the benefits and challenges of using large language model-based conversational agents for mental well- being support.AMIA Annual Symposium Proceedings, 2023:1105–1114,
2023
-
[31]
J. M. Morse. Critical Analysis of Strategies for Determining Rigor in Qualitative Inquiry.Qualitative Health Research, 25(9):1212–1222, Sept
-
[32]
doi: 10.1177/1049732315588501 3
-
[33]
T. Munz, D. Väth, P. Kuznecov, N. T. Vu, and D. Weiskopf. Visualization- based improvement of neural machine translation.Computers & Graphics, 103:45–60, Apr. 2022. doi: 10.1016/j.cag.2021.12.003 2
-
[34]
O’Mahony, L
L. O’Mahony, L. Grinsztajn, H. Schoelkopf, and S. Biderman. Attributing mode collapse in the fine-tuning of large language models. InICLR 2024 Workshop on Mathematical and Empirical Understanding of Foundation Models, 2024. 2
2024
-
[35]
R. Y . Pang, K. J. K. Feng, S. Feng, C. Li, W. Shi, Y . Tsvetkov et al. Inter- active reasoning: Visualizing and controlling chain-of-thought reasoning in large language models, 2025. doi: 10.48550/arXiv.2506.23678 2
-
[36]
Pirolli and S
P. Pirolli and S. Card. The sensemaking process and leverage points for analyst technology as identified through cognitive task analysis. In Proceedings of international conference on intelligence analysis, vol. 5, pp. 2–4. McLean, V A, USA, 2005. 2
2005
-
[37]
M. Read. Who is elara voss? https://maxread.substack.com/p/ who-is-elara-voss, 2024. Accessed: 2025-11-19. 1
2024
-
[38]
A. Reinhart, B. Markey, M. Laudenbach, K. Pantusen, R. Yurko, G. Wein- berg et al. Do LLMs write like humans? variation in grammatical and rhetorical styles.Proceedings of the National Academy of Sciences, 122(8):e2422455122, 2025. doi: 10.1073/pnas.2422455122 1
-
[39]
P. Riehmann, H. Gruendl, M. Potthast, M. Trenkmann, B. Stein, and B. Froehlich. WORDGRAPH: Keyword-in-context visualization for NET- SPEAK’s wildcard search.IEEE Transactions on Visualization and Com- puter Graphics, 18(9):1411–1423, 2012. doi: 10.1109/TVCG.2012.96 2
-
[40]
Sevastjanova, S
R. Sevastjanova, S. V ogelbacher, A. Spitz, D. Keim, and M. El-Assady. Visual comparison of text sequences generated by large language models. In2023 IEEE Visualization in Data Science (VDS), pp. 11–20. IEEE, Oct
-
[41]
doi: 10.1109/vds60365.2023.00007 2
-
[42]
B. Shneiderman. The eyes have it: A task by data type taxonomy for information visualizations. InProceedings 1996 IEEE Symposium on Visual Languages, pp. 336–343. IEEE, 1996. doi: 10.1109/VL.1996. 545307 2
-
[43]
H. Strobelt, B. Hoover, A. Satyanarayan, and S. Gehrmann. LMdiff: A visual diff tool to compare language models. InProceedings of the 2021 Conference on Empirical Methods in Natural Language Process- ing: System Demonstrations, pp. 96–105. Association for Computational Linguistics, Nov. 2021. doi: 10.18653/v1/2021.emnlp-demo.12 2
-
[44]
K. Sugiyama and K. Misue. Graph drawing by the magnetic spring model. Journal of Visual Languages & Computing, 6(3):217–231, 1995. doi: 10. 1006/jvlc.1995.1013 5 11
-
[45]
C. Swoopes, T. Holloway, and E. L. Glassman. The impact of revealing large language model stochasticity on trust, reliability, and anthropomor- phization, 2025. doi: 10.48550/arXiv.2503.16114 1, 2
-
[46]
J. R. Trippas, S. F. D. Al Lawati, J. Mackenzie, and L. Gallagher. What do users really ask large language models? an initial log analysis of google bard interactions in the wild. InProceedings of the 47th International ACM SIGIR Conference on Research and Development in Information Retrieval, SIGIR ’24, pp. 2703–2707. Association for Computing Machinery,...
-
[47]
F. van Ham, M. Wattenberg, and F. B. Viégas. Mapping text with phrase nets.IEEE Trans. Vis. Comput. Graph., 15(6):1169–1176, Nov. 2009. doi: 10.1109/TVCG.2009.165 2
-
[48]
Wattenberg
L. Wattenberg. 2025 name of the year is elara, the fa- vorite name of ai. https://namerology.com/2025/12/15/ 2025-name-of-the-year-is-elara-the-favorite-name-of-ai/ ,
2025
-
[49]
Accessed: 2026-03-19. 1
2026
-
[50]
M. Wattenberg and F. B. Viégas. The word tree, an interactive visual concordance.IEEE Transactions on Visualization and Computer Graphics, 14(6):1221–1228, 2008. doi: 10.1109/TVCG.2008.172 2, 4, 5
-
[51]
Wikipedia:signs of ai writing — Wikipedia, the free encyclopedia, 2026
Wikipedia contributors. Wikipedia:signs of ai writing — Wikipedia, the free encyclopedia, 2026. [Online; accessed 30-March-2026]. 1
2026
-
[52]
Biometrics Bulletin , author =
F. Wilcoxon. Individual comparisons by ranking methods.Biometrics Bulletin, 1(6):80–83, 1945. doi: 10.2307/3001968 7
-
[53]
T. Wu, M. Terry, and C. J. Cai. AI chains: Transparent and controllable human-AI interaction by chaining large language model prompts. In Proceedings of the 2022 CHI Conference on Human Factors in Computing Systems, pp. 1–22. ACM, 2022. doi: 10.1145/3491102.3517582 2, 3
-
[54]
S. J. Young, N. Russell, and J. S. Thornton.Token passing: a simple conceptual model for connected speech recognition systems. Cambridge University Engineering Department Cambridge, UK, 1989. 5
1989
-
[55]
J. Zamfirescu-Pereira, H. Wei, A. Xiao, K. Gu, G. Jung, M. G. Lee et al. Herding ai cats: Lessons from designing a chatbot by prompting gpt-3. In Proceedings of the 2023 ACM Designing Interactive Systems Conference, DIS ’23, pp. 2206–2220. Association for Computing Machinery, New York, NY , USA, 2023. doi: 10.1145/3563657.3596138 2
-
[56]
Zhang, Jonathan Bragg, and Joseph Chee Chang
J. Zamfirescu-Pereira, R. Y . Wong, B. Hartmann, and Q. Yang. Why johnny can’t prompt: How non-ai experts try (and fail) to design llm prompts. InProceedings of the 2023 CHI Conference on Human Factors in Computing Systems, CHI ’23, art. no. 437, 21 pages. Association for Computing Machinery, New York, NY , USA, 2023. doi: 10.1145/3544548 .3581388 1, 2
-
[58]
Noveltybench: Evaluating language models for humanlike diversity.arXiv preprint arXiv:2504.05228,
Y . Zhang, H. Diddee, S. Holm, H. Liu, X. Liu, V . Samuel et al. Novelty- Bench: Evaluating language models for humanlike diversity, 2025. doi: 10.48550/arXiv.2504.05228 2
-
[59]
Zhang, S
Y . Zhang, S. A. Khan, A. Mahmud, H. Yang, A. Lavin, M. Levin et al. Exploring the role of large language models in the scientific method: from hypothesis to discovery.npj Artificial Intelligence, 1(1):14, 2025. doi: 10. 1038/s44387-025-00019-5 1
2025
-
[60]
arXiv preprint arXiv:2404.10859 , year=
Y . Zhang, A. Schwarzschild, N. Carlini, J. Z. Kolter, and D. Ippolito. Forc- ing diffuse distributions out of language models, 2024. First Conference on Language Modeling (COLM 2024). doi: 10.48550/arXiv.2404.10859 2 12 Preprint. Under review. A TOKEN SIMILARITY ALGORITHM Algorithm A.1Token similarity score used during the merge step. For stopwords, simi...
-
[61]
Introduction (2 to 3 min).The facilitator explained the study’s purpose: to understand how LM researchers currently assess, address, and leverage the stochasticity of models, and to identify potential use cases for a graph-based visualization of LM output distributions
-
[62]
What kinds of NLP/LLM/AI problems are you working on?
Background and semi-structured discussion (10 to 15 min). Participants described their current research focus and how they typi- cally use LMs. Questions were adapted to each participant’s context but drew from the following: •“What kinds of NLP/LLM/AI problems are you working on?” •“Do your tasks have constrained outputs (e.g., multiple choice), or are t...
-
[63]
The facilitator walked through a preloaded example, demonstrating the graph layout, node selection and filtering, and comparison mode
Prototype demo (5 min).Participants viewed an early pro- totype of the visualization tool. The facilitator walked through a preloaded example, demonstrating the graph layout, node selection and filtering, and comparison mode. (a) Word tree prototype. (b) Color-coded span highlighting prototype. (c) Time Curves-style prototype [4]. Fig. A.2: During our ite...
-
[64]
Is this clear? What is confusing?
Feedback (5 to 10 min).Participants gave reactions to the prototype’s clarity, utility, and perceived relevance (or lack thereof) to their own workflows. Sample prompts included: •“Is this clear? What is confusing?” •“Would this be useful for any of the tasks you described?” •“What is missing or would you change?”
-
[65]
Use case brainstorming (5 to 10 min).Participants were asked to imagine how the tool could fit into their current work, and discussed potential extensions, new features, or alternative analysis tasks the tool could support
-
[66]
Using this interface, I understood how diverse (i.e., how narrow or broad) the output space was for a given prompt
Wrap-up (2 min).The facilitator asked for any remaining thoughts and thanked the participant. Analysis.Interview notes and recordings were coded to identify common workflow patterns for LM output inspection, recurrent themes in potential use cases, and specific design feedback. We used open coding followed by thematic synthesis, as described in Section 3....
discussion (0)
Sign in with ORCID, Apple, or X to comment. Anyone can read and Pith papers without signing in.