Recognition: unknown
Connecting the forward problem to the inverse problem in uncertainty quantification of Earth system models using fast emulators
Pith reviewed 2026-05-10 00:59 UTC · model grok-4.3
The pith
Forward uncertainty analysis identifies observations that enable accurate Bayesian calibration of Earth system model parameters.
A machine-rendered reading of the paper's core claim, the machinery that carries it, and where it could break.
Core claim
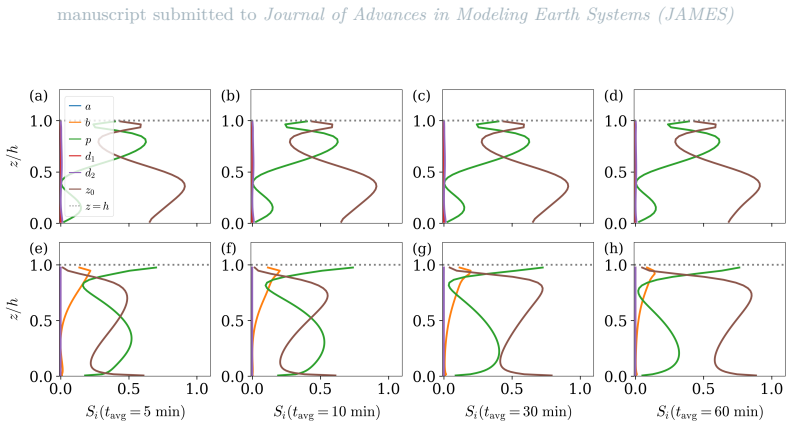
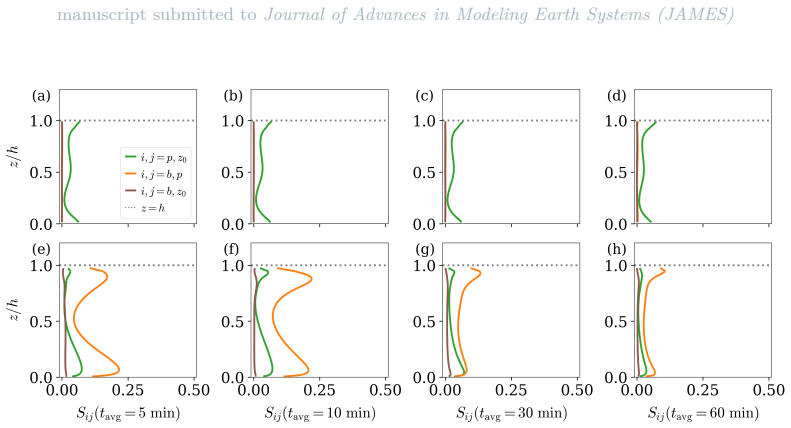
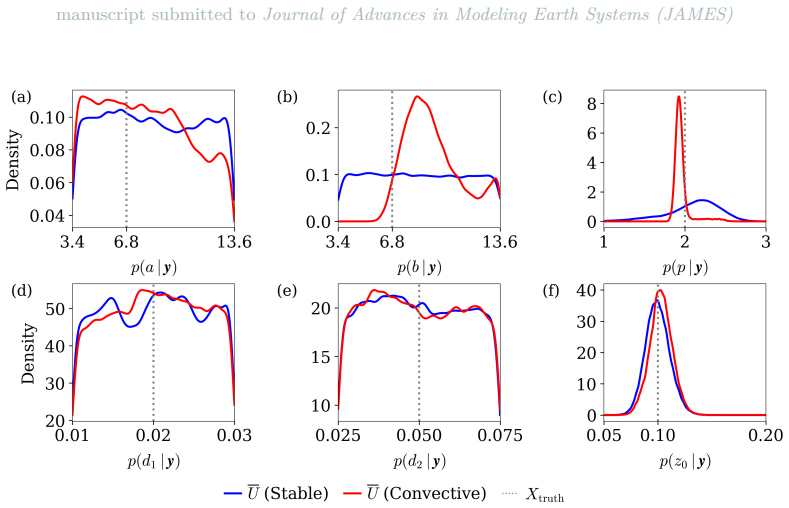
Using emulators, global sensitivity analysis across observation space shows that a parameter's contribution to output variance depends on quantity of interest, stability regime, averaging length, and spatial location. Nondimensional diagnostic measures then flag the observation regions where that contribution exceeds observational noise and the parameter's main effect exceeds interactions. Bayesian inversions that assimilate data only from these regions recover the true parameter values and achieve substantially smaller posterior variances than inversions using arbitrary or less informative observations.
What carries the argument
Nondimensional diagnostic measures that test whether a parameter's contribution to output variance exceeds observational noise and its independent effect exceeds interaction effects; these measures select the observations used for subsequent Bayesian calibration.
If this is right
- Observations from regions identified by the diagnostics serve as a strong proxy for accurate parameter recovery in Bayesian calibration.
- Posterior uncertainty on model parameters decreases systematically when calibration uses sensitivity-guided rather than arbitrary observations.
- Emulators allow exhaustive sensitivity mapping across observation space without the O(10^5) model evaluations otherwise required.
- The resulting non-iterative workflow avoids the computational cost and ill-posedness that arise when calibration begins with uninformative data.
Where Pith is reading between the lines
- The same diagnostic approach could be used to design field campaigns that place sensors only in the most informative locations and conditions.
- If the diagnostics remain reliable on real data, they offer a practical way to down-select the enormous observation streams now available from satellites and networks before calibration begins.
- Extending the method to other Earth system components such as ocean or land-surface parameterizations would test whether the same forward-to-inverse link holds across different model physics.
- One could combine these static diagnostics with sequential experimental design to adaptively acquire new observations that further shrink the remaining posterior uncertainty.
Load-bearing premise
The nondimensional diagnostics based on variance contributions will still select observations that reduce posterior uncertainty when the observations are real rather than synthetic and when the emulator contains approximation error.
What would settle it
Run Bayesian calibration twice on the same synthetic or real dataset: once with observations chosen by the diagnostics and once with randomly selected observations of equal number; if the posterior variance is not smaller for the diagnostic-selected set, the claim fails.
Figures


read the original abstract
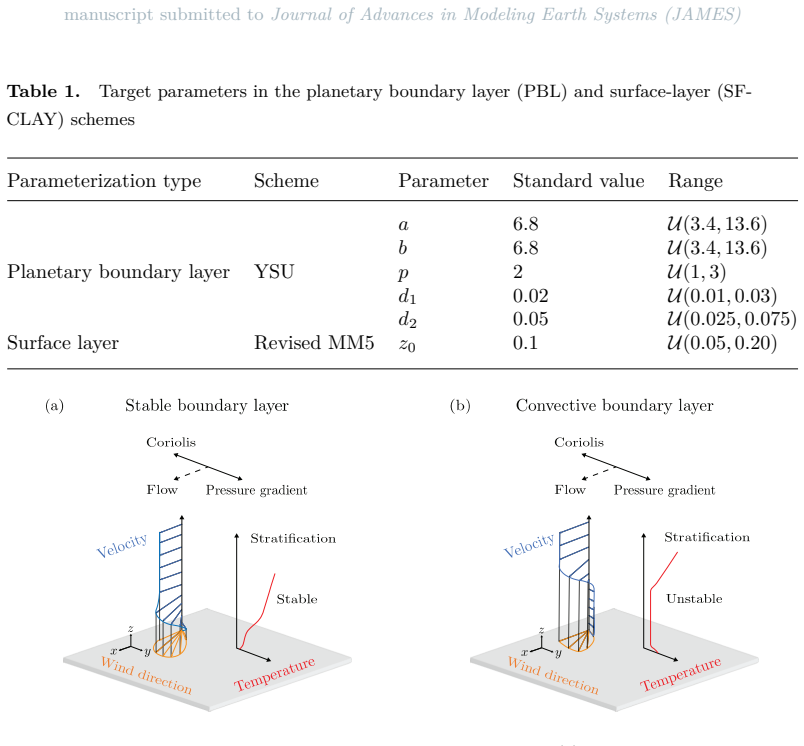
Quantifying and reducing uncertainty in Earth system model parameterizations is essential to improving their reliability in decision-making. Forward uncertainty propagation is used to derive parameter sensitivity but requires physically plausible parameter distributions first be learned from observations. Bayesian inference offers a principled approach but can become ill-posed when observations weakly constrain parameters--a condition difficult to know prior to inference. Addressing this gap, we show that parameter sensitivity results from forward uncertainty quantification can guide a non-iterative strategy for identifying observations informative to Bayesian calibration. We explore both forward and inverse uncertainty quantification for parameterizations of atmospheric turbulence in the Weather Research and Forecasting (WRF) model. To overcome the computational bottleneck of $\mathcal{O}(10^5)$ model evaluations required for both analyses, we leverage Gaussian process emulators trained on several hundred WRF simulations. Using these emulators, we conduct a global sensitivity analysis across observation space, investigating how parameter contributions to output variance depend on quantity of interest, atmospheric stability, time-averaging length, and spatial location. We then introduce nondimensional diagnostic measures that systematically identify regions where a parameter's contribution to output variance exceeds observational noise and its independent effect exceeds interaction effects. We demonstrate that observations from these regions serve as a strong proxy for accurate Bayesian calibration and reduced posterior uncertainty. Through emulator-aided Bayesian inversion with synthetic observations, we show how parameter uncertainty can be systematically reduced by leveraging sensitivity information.
Editorial analysis
A structured set of objections, weighed in public.
Referee Report
Summary. The manuscript develops a non-iterative workflow that uses Gaussian process emulators of the WRF atmospheric turbulence parameterization to perform global sensitivity analysis (GSA) over observation space. Nondimensional diagnostics derived from Sobol indices identify locations where a parameter's contribution to output variance exceeds observational noise and its main effect exceeds interaction effects. These locations are then shown, via emulator-based Bayesian inversion on synthetic observations, to yield tighter parameter posteriors than random selection.
Significance. If the diagnostics remain informative under model discrepancy and emulator error, the method would provide a practical, computationally tractable bridge between forward uncertainty quantification and Bayesian calibration for Earth system models. The emulator-based handling of O(10^5) evaluations and the explicit nondimensional selection criteria are clear strengths that could generalize to other parameterizations.
major comments (2)
- [§4.3, §5] The validation in §4.3 and §5 relies exclusively on synthetic observations generated from the identical WRF parameterization and prior used to train the emulator and compute the GSA. This shared forward operator makes the reported posterior reduction partly tautological; the manuscript does not test whether the same nondimensional thresholds remain predictive once structural model error or real observational noise is introduced.
- [§3.2] The propagation of emulator approximation error into the estimated Sobol indices (and hence into the observation-selection diagnostics) is not quantified. With training sets of only several hundred runs, the uncertainty in the main-effect and interaction indices could alter which locations are flagged as informative, yet no leave-one-out or bootstrap analysis of index stability is reported.
minor comments (2)
- [§4.1] Notation for the nondimensional diagnostics (variance contribution exceeding noise, main effect exceeding interactions) is introduced in the text but not given compact symbols or an explicit equation; adding a boxed definition would improve reproducibility.
- [Figure 7] Figure captions for the spatial maps of sensitivity diagnostics should state the exact threshold values used (e.g., S_i > noise level and S_i / S_{T_i} > 0.8) rather than referring only to “exceeding” criteria.
Simulated Author's Rebuttal
We thank the referee for their constructive and insightful comments. These highlight key aspects of validation and uncertainty quantification that we address point-by-point below, with proposed revisions to strengthen the manuscript.
read point-by-point responses
-
Referee: [§4.3, §5] The validation in §4.3 and §5 relies exclusively on synthetic observations generated from the identical WRF parameterization and prior used to train the emulator and compute the GSA. This shared forward operator makes the reported posterior reduction partly tautological; the manuscript does not test whether the same nondimensional thresholds remain predictive once structural model error or real observational noise is introduced.
Authors: We agree that the use of synthetic observations from the identical model and prior represents an idealized setting that does not fully capture structural model discrepancy or real observational noise. This choice was made to isolate the effect of the sensitivity-based selection strategy in a controlled proof-of-concept. In the revised manuscript we will expand the discussion in §5 to explicitly acknowledge this limitation, clarify that the nondimensional diagnostics are derived from forward UQ (which can incorporate discrepancy if parameterized in the likelihood), and outline pathways for extension to real observations or perturbed forward models. We will also add a brief note on how the method could be tested under model error in future work. revision: partial
-
Referee: [§3.2] The propagation of emulator approximation error into the estimated Sobol indices (and hence into the observation-selection diagnostics) is not quantified. With training sets of only several hundred runs, the uncertainty in the main-effect and interaction indices could alter which locations are flagged as informative, yet no leave-one-out or bootstrap analysis of index stability is reported.
Authors: We thank the referee for this important observation. We will revise §3.2 to include a bootstrap resampling analysis of the training data, computing confidence intervals on the Sobol indices and assessing the stability of the nondimensional thresholds and selected locations. Results will be reported to demonstrate that the primary informative regions remain robust within the estimated emulator uncertainty. revision: yes
Circularity Check
No significant circularity; forward sensitivity and Bayesian inversion remain distinct
full rationale
The paper conducts global sensitivity analysis on Gaussian process emulators to compute parameter contributions to output variance, then defines nondimensional diagnostics (variance contribution exceeding observational noise; main effect exceeding interactions) to select observation locations. These locations are subsequently used in a separate Bayesian calibration step with synthetic observations. No equations equate the reported posterior reduction to the sensitivity inputs by construction, no self-citations bear the central claim, and no ansatz or uniqueness result is imported from prior author work. The forward UQ and inverse steps are executed independently, rendering the derivation self-contained against the paper's own benchmarks.
Axiom & Free-Parameter Ledger
axioms (2)
- domain assumption Gaussian process emulators trained on several hundred WRF runs can faithfully reproduce the model outputs needed for global sensitivity analysis across observation space
- domain assumption Synthetic observations generated from the model itself can serve as a valid proxy for testing whether selected real observations will reduce posterior parameter uncertainty
Reference graph
Works this paper leans on
-
[1]
Boundary-Layer Meteorology , volume=
Representative roughness parameters for homogeneous terrain , author=. Boundary-Layer Meteorology , volume=. 1993 , publisher=
1993
-
[2]
R. K. Newsom and C. Sivaraman and T. Shippert and L. D. Riihimaki , Date-Added =. Doppler lidar vertical velocity statistics value-added product , Year =
-
[3]
Salesky , Date-Added =
Scott T. Salesky , Date-Added =. Monin--
-
[4]
A. C. M. Beljaars and A. A. M. Holtslag , Date-Added =. A software library for the calculation of surface fluxes over land and sea , Volume =. Environ Softw , Number =
-
[5]
A. C. M. Beljaars and A. A. M. Holtslag , Date-Added =. Flux parameterization over land surfaces for atmospheric models , Volume =. J Appl Meteorol , Number =
-
[6]
Marusic and R
I. Marusic and R. Mathis and N. Hutchins , Booktitle =. A wall-shear stress predictive model , Year =
-
[7]
Kaimal, J. C. , Booktitle =. Sonic anemometer measurement of atmospheric turbulence , Year =
-
[8]
Fedorovich , Date-Added =
E. Fedorovich , Date-Added =. Numerical modelling of atmospheric boundary layer flow over topography elements , Year =
-
[9]
Batchvarova and S
E. Batchvarova and S. E. Gryning , Booktitle =. Use of
-
[10]
J. C. Wyngaard , Booktitle =. Changing the face of small-scale meteorology , Year =
-
[11]
J. R. Garratt , Date-Added =. The atmospheric boundary layer , Year =
-
[12]
P. J. Mason and D. J. Thomson , Date-Added =. Large-eddy simulations of the neutral-static-stability planetary boundary layer , Volume =. Q. J. R. Meteorol. Soc. , Pages =
-
[13]
JAMES , volume=
An extended eddy-diffusivity mass-flux scheme for unified representation of subgrid-scale turbulence and convection , author=. JAMES , volume=. 2018 , publisher=
2018
-
[14]
Better calibration of cloud parameterizations and subgrid effects increases the fidelity of the
Ma, Po-Lun and others , journal=. Better calibration of cloud parameterizations and subgrid effects increases the fidelity of the. 2022 , publisher=
2022
-
[15]
JAMES , volume=
A generalized mixing length closure for eddy-diffusivity mass-flux schemes of turbulence and convection , author=. JAMES , volume=. 2020 , publisher=
2020
-
[16]
Parameter uncertainty quantification in an idealized
Howland, Michael F and Dunbar, Oliver RA and Schneider, Tapio , journal=. Parameter uncertainty quantification in an idealized. 2022 , publisher=
2022
-
[17]
Journal of Computational Physics , volume=
Calibrate, emulate, sample , author=. Journal of Computational Physics , volume=. 2021 , publisher=
2021
-
[18]
SIAM Journal on Numerical Analysis , volume=
Analysis of the ensemble Kalman filter for inverse problems , author=. SIAM Journal on Numerical Analysis , volume=. 2017 , publisher=
2017
-
[19]
Handbook of markov chain monte carlo , author=
-
[20]
Joule , year=
Overcoming the disconnect between energy system and climate modeling , author=. Joule , year=
-
[21]
Susskind and others , journal=
L. Susskind and others , journal=. Sources of opposition to renewable energy projects in the
-
[22]
Nature Climate Change , volume=
Increasing probability of record-shattering climate extremes , author=. Nature Climate Change , volume=. 2021 , publisher=
2021
-
[23]
Global Warming of 1.5 ^ C : A n IPCC special report on the impacts of global warming of 1.5 ^ C above pre-industrial levels and related global greenhouse gas emission pathways, in the context of strengthening the global response to the threat of climate change, sustainable development, and efforts to eradicate poverty. 2018
2018
-
[24]
Cambridge University Press
Masson-Delmotte, V. and P. Zhai and A. Pirani and S. L. Connors and C. Péan and S. Berger and N. Caud and Y. Chen and L. Goldfarb and M. I. Gomis and M. Huang and K. Leitzell and E. Lonnoy and J. B. R. Matthews and T. K. Maycock and T. Waterfield and O. Yelekçi and R. Yu and B. Zhou (eds.) , publisher="Cambridge University Press", year =. IPCC , 2021: Sum...
2021
-
[25]
Scientific American , volume=
A path to sustainable energy by 2030 , author=. Scientific American , volume=. 2009 , publisher=
2030
-
[26]
Report No
Adoption of the Paris Agreement. Report No. FCCC/CP/2015/L.9/Rev.1. 2015
2015
-
[27]
2018 , institution=
2017 Cost of Wind Energy Review , author=. 2018 , institution=
2017
-
[28]
Annual Energy Outlook (AEO2018). 2018
2018
-
[29]
Nature , volume=
Paris Agreement climate proposals need a boost to keep warming well below 2 C , author=. Nature , volume=. 2016 , publisher=
2016
-
[30]
Science , volume=
The trouble with negative emissions , author=. Science , volume=. 2016 , publisher=
2016
-
[31]
Energy , volume=
System LCOE: What are the costs of variable renewables? , author=. Energy , volume=. 2013 , publisher=
2013
-
[32]
IEEE power and energy magazine , volume=
Grid of the future , author=. IEEE power and energy magazine , volume=. 2009 , publisher=
2009
-
[33]
Energy Policy , volume=
The cost of wind power variability , author=. Energy Policy , volume=. 2012 , publisher=
2012
-
[34]
Journal of Physics: Conference Series , volume=
Aeroelastic instabilities of large offshore and onshore wind turbines , author=. Journal of Physics: Conference Series , volume=. 2007 , organization=
2007
-
[35]
estimates , author=
Capacity factor of wind power realized values vs. estimates , author=. energy policy , volume=. 2009 , publisher=
2009
-
[36]
Energy Policy , volume=
Policies and market factors driving wind power development in the United States , author=. Energy Policy , volume=. 2005 , publisher=
2005
-
[37]
Applied Energy , volume=
Assessing the benefits and economics of bulk energy storage technologies in the power grid , author=. Applied Energy , volume=. 2015 , publisher=
2015
-
[38]
2011 , publisher=
Wind Energy Handbook , author=. 2011 , publisher=
2011
-
[39]
Wind Energy , volume=
Modelling and measuring flow and wind turbine wakes in large wind farms offshore , author=. Wind Energy , volume=. 2009 , publisher=
2009
-
[40]
Physics of fluids , volume=
Large eddy simulation study of fully developed wind-turbine array boundary layers , author=. Physics of fluids , volume=. 2010 , publisher=
2010
-
[41]
Wind Energy , volume=
Combining economic and fluid dynamic models to determine the optimal spacing in very large wind farms , author=. Wind Energy , volume=. 2017 , publisher=
2017
-
[42]
2018 , publisher=
GE announces Haliade-X, the world’s most powerful offshore wind turbine. 2018 , publisher=
2018
-
[43]
Wind Energy , volume=
Effects of turbine spacing on the power output of extended wind-farms , author=. Wind Energy , volume=. 2016 , publisher=
2016
-
[44]
Design and estimator for the total sensitivity index , author=
Variance based sensitivity analysis of model output. Design and estimator for the total sensitivity index , author=. Computer physics communications , volume=. 2010 , publisher=
2010
-
[45]
Statistical science , pages=
Bayesian experimental design: A review , author=. Statistical science , pages=. 1995 , publisher=
1995
-
[46]
Wind Energy , volume=
Optimal turbine spacing in fully developed wind farm boundary layers , author=. Wind Energy , volume=. 2012 , publisher=
2012
-
[47]
Renewable Energy , volume=
Placement of wind turbines using genetic algorithms , author=. Renewable Energy , volume=. 2005 , publisher=
2005
-
[48]
Renewable Energy , volume=
Optimal placement of wind turbines in a wind park using Monte Carlo simulation , author=. Renewable Energy , volume=. 2008 , publisher=
2008
-
[49]
1983 , publisher=
A note on wind generator interaction , author=. 1983 , publisher=
1983
-
[50]
Annual review of fluid mechanics , volume=
Direct numerical simulation: a tool in turbulence research , author=. Annual review of fluid mechanics , volume=. 1998 , publisher=
1998
-
[51]
Annual review of fluid mechanics , volume=
Flow structure and turbulence in wind farms , author=. Annual review of fluid mechanics , volume=
-
[52]
Journal of Fluid Mechanics , volume=
Boundary-layer development and gravity waves in conventionally neutral wind farms , author=. Journal of Fluid Mechanics , volume=. 2017 , publisher=
2017
-
[53]
Journal of Physics: Conference Series , volume=
Wake behind an offshore wind farm observed with dual-Doppler radars , author=. Journal of Physics: Conference Series , volume=. 2018 , organization=
2018
-
[54]
Wind plant power optimization through yaw control using a parametric model for wake effects—a
Gebraad, PMO and Teeuwisse, FW and Van Wingerden, JW and Fleming, Paul A and Ruben, SD and Marden, JR and Pao, LY , journal=. Wind plant power optimization through yaw control using a parametric model for wake effects—a. 2016 , publisher=
2016
-
[55]
Renewable and sustainable energy reviews , volume=
A review of maximum power point tracking algorithms for wind energy systems , author=. Renewable and sustainable energy reviews , volume=. 2012 , publisher=
2012
-
[56]
Journal of Physics: Conference Series , volume=
Field-test results using a nacelle-mounted lidar for improving wind turbine power capture by reducing yaw misalignment , author=. Journal of Physics: Conference Series , volume=. 2014 , organization=
2014
-
[57]
2005 , publisher=
Wind power in power systems , author=. 2005 , publisher=
2005
-
[58]
2017 American Control Conference (ACC) , year=
A tutorial on control-oriented modeling and control of wind farms , author=. 2017 American Control Conference (ACC) , year=
2017
-
[59]
Wind Energy , volume=
Analysis of axial-induction-based wind plant control using an engineering and a high-order wind plant model , author=. Wind Energy , volume=. 2016 , publisher=
2016
-
[60]
Wind Energy , volume=
Application of a LES technique to characterize the wake deflection of a wind turbine in yaw , author=. Wind Energy , volume=. 2010 , publisher=
2010
-
[61]
IEEE Transactions on Control Systems Technology , volume=
A model-free approach to wind farm control using game theoretic methods , author=. IEEE Transactions on Control Systems Technology , volume=. 2013 , publisher=
2013
-
[62]
Renewable Energy , volume=
Experimental investigation of wake effects on wind turbine performance , author=. Renewable Energy , volume=. 2011 , publisher=
2011
-
[63]
Wind Energy , volume=
Wind plant system engineering through optimization of layout and yaw control , author=. Wind Energy , volume=. 2016 , publisher=
2016
-
[64]
Experiments in fluids , volume=
Optical vortex tracking studies of a horizontal axis wind turbine in yaw using laser-sheet, flow visualisation , author=. Experiments in fluids , volume=. 1997 , publisher=
1997
-
[65]
Controlling wind in ECN’s scaled wind farm , author=. Proc. Europe Premier Wind Energy Event , year=
-
[66]
Wind Energy Science , volume=
A simulation study demonstrating the importance of large-scale trailing vortices in wake steering , author=. Wind Energy Science , volume=. 2018 , publisher=
2018
-
[67]
Wind Energy Science , volume=
Assessment of wind turbine component loads under yaw-offset conditions , author=. Wind Energy Science , volume=. 2018 , publisher=
2018
-
[68]
Journal of Turbulence , number=
The top-down model of wind farm boundary layers and its applications , author=. Journal of Turbulence , number=. 2012 , publisher=
2012
-
[69]
Wind Energy , volume=
Validation of the dynamic wake meander model for loads and power production in the Egmond aan Zee wind farm , author=. Wind Energy , volume=. 2013 , publisher=
2013
-
[70]
New Directions in Strategic Energy Analysis
Arent, Doug , year =. New Directions in Strategic Energy Analysis
-
[71]
Wind Energy , volume=
Nonlinear model predictive control of wind turbines using LIDAR , author=. Wind Energy , volume=. 2013 , publisher=
2013
-
[72]
1973 , publisher=
Theoretical aerodynamics , author=. 1973 , publisher=
1973
-
[73]
Journal of Fluid Mechanics , volume=
Modelling yawed wind turbine wakes: a lifting line approach , author=. Journal of Fluid Mechanics , volume=. 2018 , publisher=
2018
-
[74]
2015 , publisher=
Decision making under uncertainty: theory and application , author=. 2015 , publisher=
2015
-
[75]
2018 Annual American Control Conference (ACC) , year=
Active power control for wind farms using distributed model predictive control and nearest neighbor communication , author=. 2018 Annual American Control Conference (ACC) , year=
2018
-
[76]
Renewable Energy , volume=
A new analytical model for wind-turbine wakes , author=. Renewable Energy , volume=. 2014 , publisher=
2014
-
[77]
Wind Energy Science , volume=
Field test of wake steering at an offshore wind farm , author=. Wind Energy Science , volume=. 2017 , publisher=
2017
-
[78]
Journal of Renewable and Sustainable Energy , volume=
Wake structure in actuator disk models of wind turbines in yaw under uniform inflow conditions , author=. Journal of Renewable and Sustainable Energy , volume=. 2016 , publisher=
2016
-
[79]
Wind Energy , volume=
Maximization of the annual energy production of wind power plants by optimization of layout and yaw-based wake control , author=. Wind Energy , volume=. 2017 , publisher=
2017
-
[80]
Adam: A Method for Stochastic Optimization
Adam: A method for stochastic optimization , author=. arXiv preprint arXiv:1412.6980 , year=
work page internal anchor Pith review Pith/arXiv arXiv
discussion (0)
Sign in with ORCID, Apple, or X to comment. Anyone can read and Pith papers without signing in.