Recognition: no theorem link
Tuning in to Frequencies: How Global Assets Align with U.S. Put-Call Parity Residuals
Pith reviewed 2026-05-11 01:53 UTC · model grok-4.3
The pith
The carry gap in U.S. equity index options aligns with low-frequency global asset returns rather than being contained within OIS rates.
A machine-rendered reading of the paper's core claim, the machinery that carries it, and where it could break.
Core claim
Adding low-frequency global asset-return components to an OIS-based baseline improves in-sample and leave-one-year-out out-of-sample R^2, with gains robust to broad-dollar neutralization, alternative asset blocks, and nested horizon selection. The evidence indicates reduced-form P-Q alignment: the carry gap is not empirically separable from physical-measure outside-option proxies, rather than behaving as a purely OIS-contained wedge.
What carries the argument
The carry gap, the annualized wedge between option-implied and OIS discount factors in SPX and RUT options, which measures the opportunity cost of capital used to enforce put-call parity.
If this is right
- The carry gap varies systematically with low-frequency global asset returns beyond OIS baselines.
- Model explanatory power rises when these global components are included and stays higher under multiple robustness checks.
- Parity enforcement costs link empirically to physical outside-option proxies.
- The alignment is not isolated to one asset class or horizon choice.
Where Pith is reading between the lines
- Traders or risk managers could monitor selected global asset frequencies to anticipate shifts in the carry gap.
- The same frequency-based proxy approach might extend to other derivatives where capital constraints create similar wedges.
- Direct data on capital flows around low-frequency market movements could test the opportunity-cost channel more tightly.
Load-bearing premise
That low-frequency global asset returns serve as valid proxies for the outside investment opportunities that represent the opportunity cost of capital used to enforce put-call parity.
What would settle it
A direct test showing that low-frequency global asset components produce no R-squared improvement in leave-one-year-out out-of-sample periods even after broad-dollar neutralization.
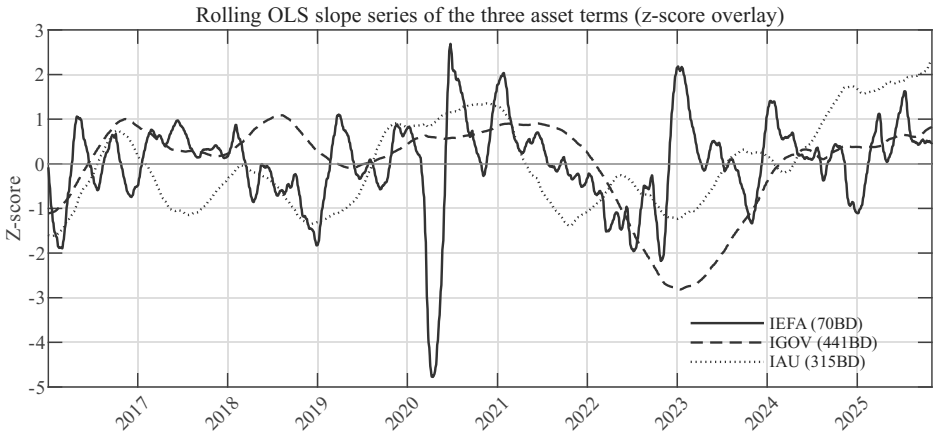
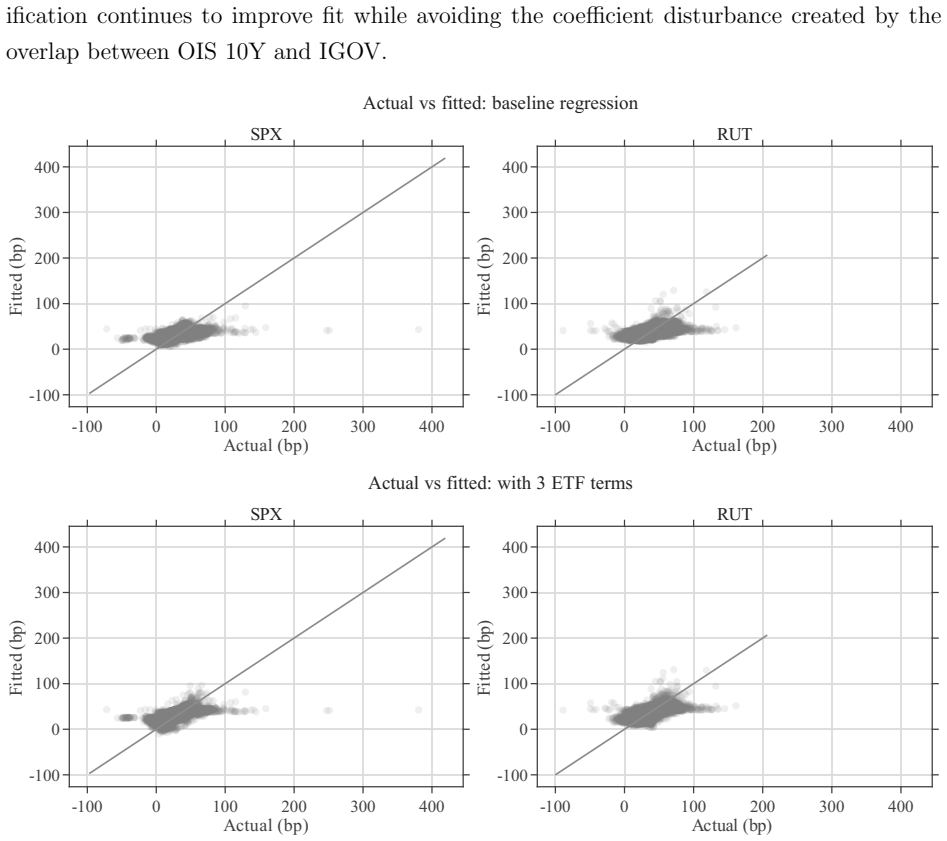
Figures


read the original abstract
Put-call parity is a risk-neutral identity, but enforcing it is path-dependent and capital-using. I study the carry gap, the annualized wedge between option-implied and OIS discount factors, in SPX and RUT options. Because parity enforcement ties up scarce capital, its opportunity cost may reflect outside investment opportunities. Adding low-frequency global asset-return components to an OIS-based baseline improves in-sample and leave-one-year-out out-of-sample R^2, with gains robust to broad-dollar neutralization, alternative asset blocks, and nested horizon selection. The evidence indicates reduced-form P-Q alignment: the carry gap is not empirically separable from physical-measure outside-option proxies, rather than behaving as a purely OIS-contained wedge.
Editorial analysis
A structured set of objections, weighed in public.
Referee Report
Summary. The paper studies the 'carry gap'—the annualized wedge between option-implied discount factors and OIS rates—in SPX and RUT options. It posits that enforcing put-call parity consumes scarce capital whose opportunity cost is reflected in outside investment opportunities, and shows that augmenting an OIS baseline with low-frequency components of global asset returns raises both in-sample and leave-one-year-out out-of-sample R². These gains survive broad-dollar neutralization, alternative asset blocks, and nested horizon selection. The results are interpreted as reduced-form evidence of P-Q measure alignment rather than a purely OIS-contained wedge.
Significance. If the central result holds, the work supplies empirical evidence that low-frequency global returns can proxy the capital-opportunity costs that drive parity residuals, offering a bridge between physical-market conditions and risk-neutral pricing. The leave-one-year-out validation and the reported robustness checks constitute genuine strengths. The contribution would be stronger if the low-frequency proxies were shown to isolate opportunity costs rather than shared risk premia; under that condition the paper would usefully inform limits-to-arbitrage models in derivatives markets.
major comments (3)
- [§3] §3 (Data and Variable Construction): the manuscript provides insufficient detail on the precise data sources for the global asset-return series, the exact filtering procedure used to isolate low-frequency components, and the construction of the carry-gap variable itself. These omissions are load-bearing because the reported R² gains and the P-Q alignment claim rest directly on the validity of these components as proxies for outside opportunities.
- [Results] Results section (robustness tables): while the paper demonstrates robustness to broad-dollar neutralization and alternative asset blocks, it does not report tests that orthogonalize the low-frequency components to known common risk factors (equity premia, volatility, or liquidity). This leaves open the possibility that the R² improvements arise from shared risk exposures rather than the specific opportunity cost of parity-enforcing capital, directly affecting the reduced-form P-Q interpretation.
- [§5] §5 (Interpretation): the claim of 'reduced-form P-Q alignment' is asserted on the basis of regression fit, yet the manuscript does not supply a formal argument or auxiliary test showing why improved explanatory power implies that the carry gap is not empirically separable from physical-measure proxies. The leave-one-year-out check mitigates some in-sample concerns but does not resolve this interpretive gap.
minor comments (3)
- [Introduction] The notation for the carry gap and the low-frequency extraction operator should be introduced with an explicit equation early in the text to improve readability.
- [Figures] Several figures would benefit from clearer legends and axis labels indicating the exact frequency bands and asset blocks used.
- [Data] A short table summarizing the asset universe and sample periods for the global returns would aid replication.
Simulated Author's Rebuttal
We thank the referee for the constructive and detailed comments, which have helped us clarify key aspects of the analysis. We address each major comment below and have revised the manuscript to incorporate additional details, robustness checks, and interpretive discussion where appropriate.
read point-by-point responses
-
Referee: §3 (Data and Variable Construction): the manuscript provides insufficient detail on the precise data sources for the global asset-return series, the exact filtering procedure used to isolate low-frequency components, and the construction of the carry-gap variable itself. These omissions are load-bearing because the reported R² gains and the P-Q alignment claim rest directly on the validity of these components as proxies for outside opportunities.
Authors: We agree that greater transparency on these elements strengthens the paper. In the revised manuscript, we have expanded §3 with a dedicated subsection that specifies the exact data sources (Bloomberg and Datastream tickers for the global asset series including equity indices, commodities, and currencies), the bandpass filter parameters (cutoffs at frequencies corresponding to 12- and 60-month horizons to extract low-frequency components), and the carry-gap construction (annualized difference between the put-call parity implied financing rate and the OIS rate, computed daily from option mid prices with standard no-arbitrage filters). These additions ensure full reproducibility and directly support the proxy validity. revision: yes
-
Referee: Results section (robustness tables): while the paper demonstrates robustness to broad-dollar neutralization and alternative asset blocks, it does not report tests that orthogonalize the low-frequency components to known common risk factors (equity premia, volatility, or liquidity). This leaves open the possibility that the R² improvements arise from shared risk exposures rather than the specific opportunity cost of parity-enforcing capital, directly affecting the reduced-form P-Q interpretation.
Authors: We concur that orthogonalization tests would help isolate the opportunity-cost channel from common risk exposures. The revised Results section now includes additional tables in which the low-frequency global components are first regressed on equity premia (MSCI World), volatility (VIX), and liquidity (TED spread) proxies; the residuals are then used in the main carry-gap regressions. The incremental R² gains remain statistically significant and economically similar in magnitude, indicating that the explanatory power is not fully attributable to shared risk factors. This bolsters the reduced-form P-Q alignment interpretation. revision: yes
-
Referee: §5 (Interpretation): the claim of 'reduced-form P-Q alignment' is asserted on the basis of regression fit, yet the manuscript does not supply a formal argument or auxiliary test showing why improved explanatory power implies that the carry gap is not empirically separable from physical-measure proxies. The leave-one-year-out check mitigates some in-sample concerns but does not resolve this interpretive gap.
Authors: We view the reduced-form claim as appropriately limited to the empirical non-separability demonstrated by the incremental fit. To address the concern, we have added a short formal discussion in §5 noting that, under the null of separability (i.e., carry gap driven solely by OIS), the low-frequency physical proxies should add no explanatory power; the observed and robust out-of-sample gains therefore reject this null in a reduced-form sense. We also clarify that this does not imply structural causality but is consistent with limits-to-arbitrage mechanisms. The leave-one-year-out validation is retained as supporting evidence. revision: partial
Circularity Check
No significant circularity; empirical regression results are self-contained against external benchmarks.
full rationale
The paper conducts an empirical analysis of the carry gap using regressions that add low-frequency components extracted from global asset returns as explanatory variables. In-sample and leave-one-year-out out-of-sample R^2 improvements follow directly from the regression specification and the stated robustness checks (broad-dollar neutralization, alternative blocks, nested horizons). These steps do not reduce by construction to the inputs via self-definition, fitted parameters renamed as predictions, or self-citation chains. The leave-one-year-out procedure supplies an independent validation layer, and no load-bearing premise relies on an unverified uniqueness theorem or ansatz imported from prior author work. The central claim remains a testable reduced-form alignment rather than a tautological restatement of the data construction.
Axiom & Free-Parameter Ledger
free parameters (1)
- regression coefficients on global asset components
axioms (2)
- standard math Put-call parity is a risk-neutral identity
- domain assumption Enforcing parity uses scarce capital whose opportunity cost appears in outside returns
Reference graph
Works this paper leans on
-
[1]
Stoll, H. R. (1969). The Relationship between Put and Call Option Prices. The Journal of Finance, 24(5), 801--824. https://doi.org/10.1111/j.1540-6261.1969.tb01694.x
-
[2]
Merton, R. C. (1973). An Intertemporal Capital Asset Pricing Model. Econometrica, 41(5), 867--887. https://doi.org/10.2307/1913811
-
[3]
Gould, J. P., & Galai, D. (1974). Transaction Costs and the Relationship between Put and Call Prices. Journal of Financial Economics, 1(2), 105--129. https://doi.org/10.1016/0304-405X(74)90001-4
-
[4]
Klemkosky, R. C., & Resnick, B. G. (1979). Put--Call Parity and Market Efficiency. The Journal of Finance, 34(5), 1141--1155. https://doi.org/10.1111/j.1540-6261.1979.tb00061.x
-
[5]
Shleifer, A., & Vishny, R. W. (1997). The Limits of Arbitrage. The Journal of Finance, 52(1), 35--55. https://doi.org/10.1111/j.1540-6261.1997.tb03807.x
-
[6]
Ackert, L. F., & Tian, Y. S. (2001). Efficiency in Index Options Markets and Trading in Stock Baskets. Journal of Banking & Finance, 25(9), 1607--1634. https://doi.org/10.1016/S0378-4266(00)00145-X
-
[7]
Gromb, D., & Vayanos, D. (2002). Equilibrium and Welfare in Markets with Financially Constrained Arbitrageurs. Journal of Financial Economics, 66(2--3), 361--407. https://doi.org/10.1016/S0304-405X(02)00228-3
-
[8]
Ofek, E., Richardson, M., & Whitelaw, R. F. (2004). Limited arbitrage and short sales restrictions: evidence from the options markets. Journal of Financial Economics, 74(2), 305--342. https://doi.org/10.1016/j.jfineco.2003.05.008
-
[9]
Bollerslev, T., Tauchen, G., & Zhou, H. (2009). Expected Stock Returns and Variance Risk Premia. The Review of Financial Studies, 22(11), 4463--4492. https://doi.org/10.1093/rfs/hhp008
-
[10]
Brunnermeier, M. K., & Pedersen, L. H. (2009). Market Liquidity and Funding Liquidity. The Review of Financial Studies, 22(6), 2201--2238. https://doi.org/10.1093/rfs/hhn098
-
[11]
Mitchell, M., & Pulvino, T. (2012). Arbitrage Crashes and the Speed of Capital. Journal of Financial Economics, 104(3), 469--490. https://doi.org/10.1016/j.jfineco.2011.09.002
-
[12]
Ross, S. (2015). The Recovery Theorem. The Journal of Finance, 70(2), 615--648. https://doi.org/10.1111/jofi.12092
-
[13]
Martin, I. (2017). What Is the Expected Return on the Market? The Quarterly Journal of Economics, 132(1), 367--433. https://doi.org/10.1093/qje/qjw034
-
[14]
Du, W., Tepper, A., & Verdelhan, A. (2018). Deviations from Covered Interest Rate Parity. The Journal of Finance, 73(3), 915--957. https://doi.org/10.1111/jofi.12620
-
[15]
Azzone, M., & Baviera, R. (2021). Synthetic Forwards and Cost of Funding in the Equity Derivative Market. Finance Research Letters, 41, 101841. https://doi.org/10.1016/j.frl.2020.101841
-
[16]
Muravyev, D., Pearson, N. D., & Pollet, J. M. (2025). Why does options market information predict stock returns? Journal of Financial Economics, 172, 104153. https://doi.org/10.1016/j.jfineco.2025.104153
-
[17]
Shin, U. (2026). The Cost of a Free Lunch. SSRN Working Paper, No. 6407379 https://papers.ssrn.com/abstract_id=6407379
work page 2026
-
[18]
Board of Governors of the Federal Reserve System (US) (2026a). Federal Reserve Bank of Chicago, Chicago Fed National Financial Conditions Index [NFCI], retrieved from FRED, Federal Reserve Bank of St.\ Louis, April 3, 2026. https://fred.stlouisfed.org/series/NFCI
work page 2026
-
[19]
Board of Governors of the Federal Reserve System (US), Nominal Broad U.S
Board of Governors of the Federal Reserve System (US) (2026b). Board of Governors of the Federal Reserve System (US), Nominal Broad U.S. Dollar Index [DTWEXBGS], retrieved from FRED, Federal Reserve Bank of St.\ Louis, April 3, 2026. https://fred.stlouisfed.org/series/DTWEXBGS
work page 2026
-
[20]
Historical SPX and RUT option NBBO data
ThetaData (2026). Historical SPX and RUT option NBBO data. Retrieved April 3, 2026, from https://www.thetadata.net
work page 2026
discussion (0)
Sign in with ORCID, Apple, or X to comment. Anyone can read and Pith papers without signing in.