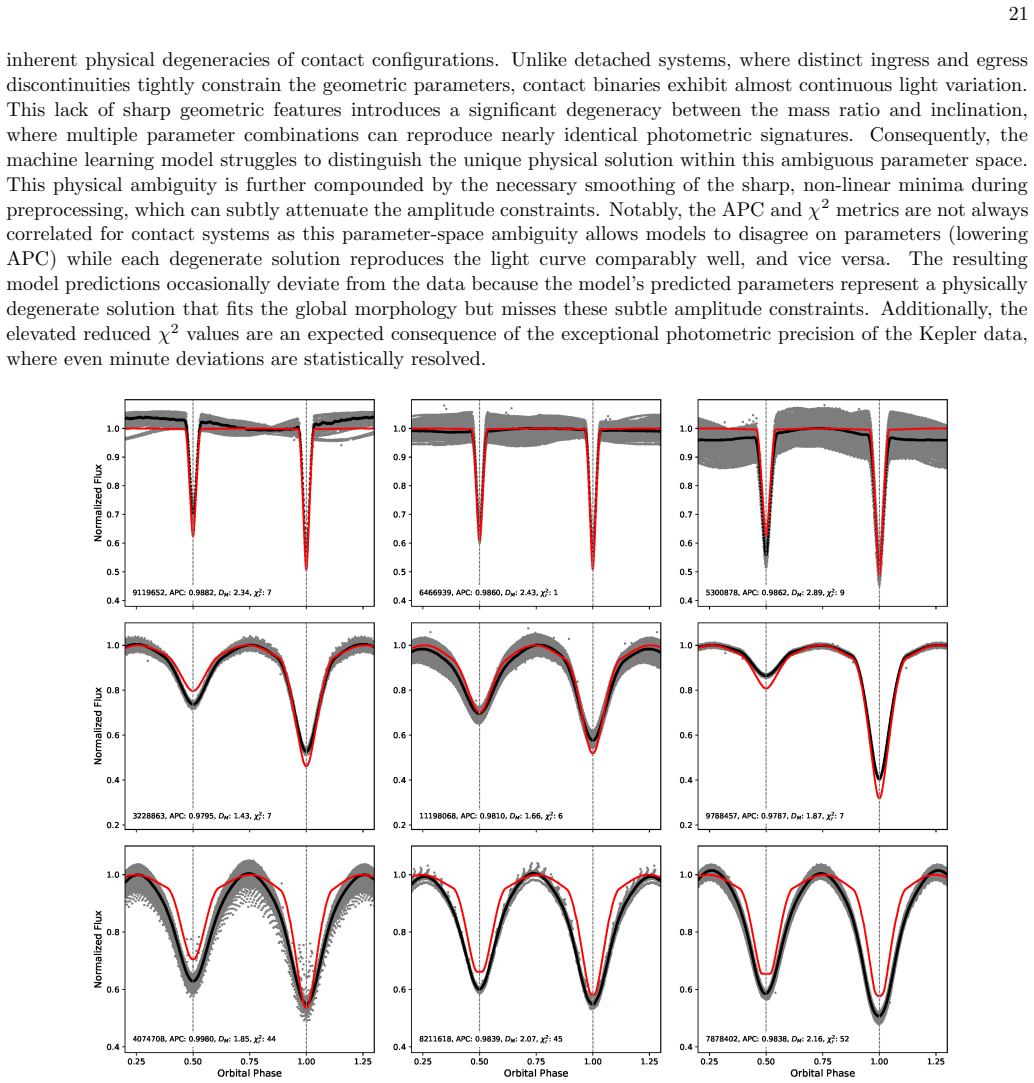
Recognition: unknown
Is the `Known' Enough? An Integrated Machine Learning Framework for Eclipsing Binary Classification and Parameter Estimation Based on Well-Characterized Systems
Pith reviewed 2026-05-10 01:20 UTC · model grok-4.3
The pith
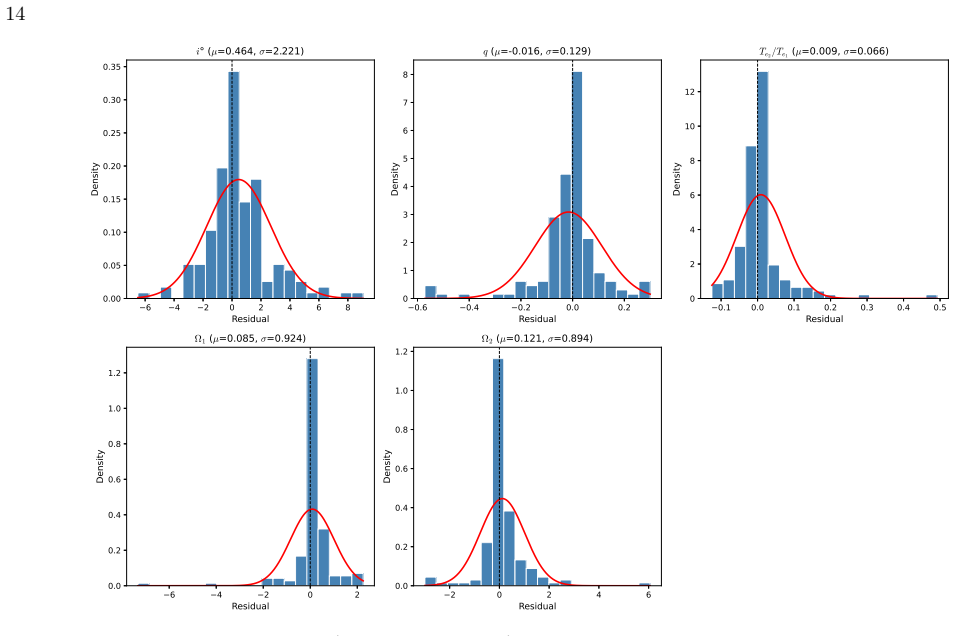
Machine learning ensembles trained on 845 well-characterized eclipsing binaries classify morphologies at 95% accuracy and estimate physical parameters like temperature ratios and inclinations with R-squared values from 0.77 to 0.92 on held-
A machine-rendered reading of the paper's core claim, the machinery that carries it, and where it could break.
Core claim
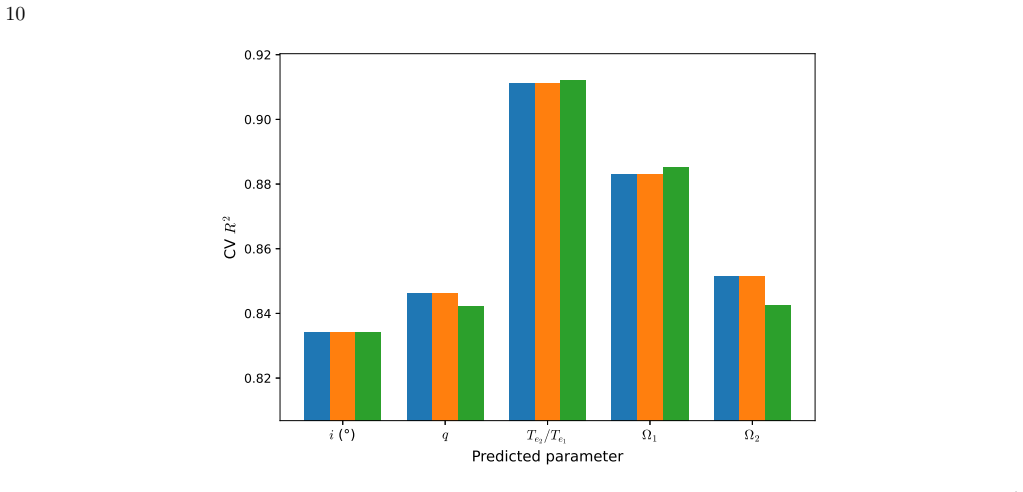
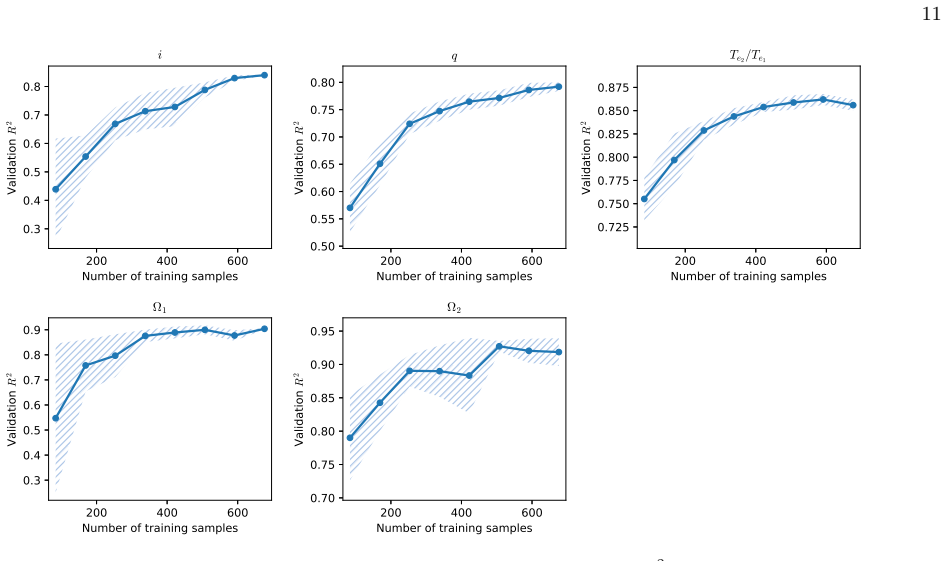
Random Forest and XGBoost ensemble models, trained on 51 features from phase-folded light curves of 845 well-characterized eclipsing binaries across three morphological classes, simultaneously classify system morphology with 95.4% cross-validation accuracy and 90.7% accuracy on a held-out test set while estimating effective temperature ratio (R² = 0.88), primary and secondary surface potentials (R² = 0.91 and 0.92), inclination (R² = 0.89), and mass ratio (R² = 0.77). Physics-guided post-processing is applied after the models, and independent validation against the OGLE OCVS catalog yields 0.99 contact recall across 104692 matched systems, while cross-matches with Kepler catalogs recover 77%
What carries the argument
The multi-task ensemble framework that extracts 51 domain-specific features from each phase-folded photometric light curve and feeds them to Random Forest and XGBoost models for joint classification and regression, followed by physics-guided post-processing.
If this is right
- Thousands of high-confidence eclipsing binary candidates can be identified and assigned preliminary physical parameters from existing photometric survey data.
- Morphological classifications achieve high recall (0.99 for contact systems) when cross-checked against the OGLE Online Catalog of Variable Stars across over 100,000 matched objects.
- Cross-matching with independent Kepler catalogs confirms 77% classification accuracy and parameter recovery consistent with known selection biases, third-light dilution, and differences between photometric and spectroscopic methods.
- The framework provides a scalable route to detailed astrophysical characterization for the volume of light curves produced by modern photometric surveys.
Where Pith is reading between the lines
- If applied to upcoming large-scale surveys, the same pipeline could supply initial parameter estimates for millions of systems and thereby prioritize targets for follow-up spectroscopy or multi-band photometry.
- The feature set derived from phase-folded curves may transfer to other classes of periodic variables once suitable training labels become available.
- Accounting explicitly for third-light contamination in the post-processing step could reduce the systematic deviations observed in the Kepler validation.
- The approach could be extended to joint modeling with radial-velocity data when such measurements exist for a subset of targets, tightening the mass-ratio and temperature estimates.
Load-bearing premise
The 845 well-characterized systems used for training are representative of the broader population of eclipsing binaries encountered in large surveys, and the 51 extracted features capture the necessary information without significant information loss or selection bias from phase-folding and feature engineering.
What would settle it
A comparison of the model's predicted parameters against independent spectroscopic or detailed photometric solutions for several hundred eclipsing binaries not included in the original 845-system training set would reveal whether the reported R-squared values hold outside the training distribution.
Figures


read the original abstract
This study presents a multi-task machine learning framework for simultaneous morphology classification and physical parameter estimation of eclipsing binaries using photometric light curves. We train Random Forest and XGBoost ensemble models on 845 of 995 well-characterized systems comprising three morphological configurations by extracting 51 domain-specific features from each phase-folded light. To assess generalization, 15% of systems were withheld as an independent test set before any model training. On this held-out set, the XGBoost model yields $R^2$ values of 0.88 for the effective temperature ratio, 0.91 for the primary surface potential, 0.92 for the secondary surface potential, 0.89 for inclination, and 0.77 for the mass ratio. Morphology classification achieves 95.4% accuracy on the cross-validation set with per-class F1 scores exceeding 0.90, while the held-out test set confirms generalization with 90.7% accuracy. We present a catalog of estimated physical parameters and classifications for these systems, identifying thousands of high-confidence candidates. Morphological classifications are independently validated against the OGLE Online Catalog of Variable Stars (OCVS), achieving a contact recall of 0.99 across 104692 matched systems. The model's generalization capability is validated by cross-matching predictions with independent Kepler catalogs, achieving 77% classification accuracy and recovering physical parameters with systematic deviations consistent with known selection biases, third-light dilution, and methodological differences between photometric and spectroscopic approaches. This work confirms that machine learning ensembles, when coupled with physics guided post-processing, can effectively bridge the gap between massive photometric surveys and detailed astrophysical characterization.
Editorial analysis
A structured set of objections, weighed in public.
Referee Report
Summary. The paper presents a multi-task machine learning framework using Random Forest and XGBoost ensembles trained on 845 well-characterized eclipsing binary systems. It extracts 51 domain-specific features from phase-folded light curves to simultaneously classify morphology (detached, semi-detached, contact) and estimate physical parameters including effective temperature ratio, primary and secondary surface potentials, inclination, and mass ratio. Reported performance includes R² values of 0.77–0.92 on a 15% held-out test set, 95.4% morphology classification accuracy under cross-validation, and 90.7% accuracy on the held-out set. External validation shows high contact recall (0.99) against the OGLE OCVS catalog for 104692 matched systems and 77% classification accuracy with systematic parameter offsets when cross-matched to Kepler catalogs. The central claim is that ML ensembles combined with physics-guided post-processing can bridge the gap between massive photometric surveys and detailed astrophysical characterization.
Significance. If the generalization to survey-scale data holds, the framework could provide a scalable method for classifying and parameterizing large numbers of eclipsing binaries from surveys such as TESS or LSST, where full physical modeling is impractical. The use of an independent held-out test set, cross-validation, and external catalog cross-matches supplies concrete evidence supporting the supervised prediction task, though the extent to which the approach remains robust under realistic distribution shifts is central to its claimed utility.
major comments (2)
- [Abstract and Kepler validation section] Abstract and Kepler validation section: the cross-match with independent Kepler catalogs yields only 77% classification accuracy together with systematic offsets in recovered parameters, explicitly attributed to selection biases, third-light dilution, and photometric-versus-spectroscopic differences. Because the central claim requires the framework to bridge well-characterized systems to blind survey detections, this performance degradation under distribution shift is load-bearing and needs quantitative mitigation or additional tests to substantiate the generalization assertion.
- [Training data description and methodology] Training data description and methodology: the 845 training systems are selected as 'well-characterized,' which by construction biases the sample toward objects with prior high-quality follow-up and therefore differs in period, amplitude, SNR, and morphology from typical blind survey detections. The 15% held-out test set remains inside this distribution, and the 51 phase-folded features plus post-processing have not been shown to be invariant under the shift that defines the target application, as indicated by the Kepler results.
minor comments (2)
- [Abstract] Abstract: no details are provided on the hyperparameter tuning procedure, the feature selection process that produced the 51 domain-specific features, uncertainty estimates or error bars on the predicted parameters, or the explicit implementation of third-light and dilution corrections in the physics-guided post-processing step.
- [General presentation] General presentation: clarify how the physics-guided post-processing is applied to the raw ML outputs and whether it is deterministic or introduces additional free parameters, to support reproducibility.
Simulated Author's Rebuttal
We thank the referee for their constructive and detailed comments, which have prompted us to clarify the scope of our claims regarding generalization. We respond point by point to the major comments below.
read point-by-point responses
-
Referee: [Abstract and Kepler validation section] Abstract and Kepler validation section: the cross-match with independent Kepler catalogs yields only 77% classification accuracy together with systematic offsets in recovered parameters, explicitly attributed to selection biases, third-light dilution, and photometric-versus-spectroscopic differences. Because the central claim requires the framework to bridge well-characterized systems to blind survey detections, this performance degradation under distribution shift is load-bearing and needs quantitative mitigation or additional tests to substantiate the generalization assertion.
Authors: We agree that the Kepler cross-match constitutes a key test of generalization to survey-like data and that the drop to 77% accuracy with systematic parameter offsets is an important indicator of distribution shift. The manuscript already reports these results transparently and attributes them to the cited factors. In revision we will expand the Kepler validation section with a quantitative tabulation of per-parameter biases and scatters relative to the Kepler values, together with a brief discussion of how third-light corrections could be incorporated into the existing post-processing step. We note, however, that complete removal of the shift would require a training set drawn from blind survey detections with independent high-precision parameters, which does not yet exist at the necessary scale; the current external validations therefore illustrate both the promise and the realistic limits of the approach. revision: partial
-
Referee: [Training data description and methodology] Training data description and methodology: the 845 training systems are selected as 'well-characterized,' which by construction biases the sample toward objects with prior high-quality follow-up and therefore differs in period, amplitude, SNR, and morphology from typical blind survey detections. The 15% held-out test set remains inside this distribution, and the 51 phase-folded features plus post-processing have not been shown to be invariant under the shift that defines the target application, as indicated by the Kepler results.
Authors: We concur that the training sample is necessarily biased toward systems with existing high-quality characterization, and that the held-out test set therefore lies within the same distribution. This is an unavoidable consequence of supervised learning when reliable ground-truth parameters are required. The 51 features were selected on physical grounds to capture morphology and potential information from phase-folded light curves; their robustness is evidenced by the strong held-out and OGLE performance. We will revise the training-data and methodology sections to include an explicit discussion of the expected distribution shift, supported by a comparison of feature statistics between the training sample and the Kepler cross-matches, and will add a dedicated limitations subsection. Full invariance cannot be demonstrated without additional labeled data from blind surveys, but the proposed textual changes will make the current evidence and its boundaries clearer to readers. revision: partial
Circularity Check
Standard supervised ML training and external validation exhibit no circularity
full rationale
The paper implements a conventional supervised learning pipeline: 51 features are extracted from phase-folded light curves of 845 pre-characterized systems, models (Random Forest, XGBoost) are trained to map those features to morphology labels and physical parameters, and performance is measured on an explicitly withheld 15% test set plus cross-matches to independent catalogs (OGLE OCVS, Kepler). No derivation, equation, or uniqueness claim reduces the output to the input by construction; the held-out predictions and external validations are statistically independent of the training labels. Self-citations are absent from the load-bearing steps, and no ansatz or fitted parameter is relabeled as a first-principles result.
Axiom & Free-Parameter Ledger
free parameters (2)
- XGBoost and Random Forest hyperparameters
- Selection of the 51 domain-specific features
axioms (2)
- domain assumption Parameters of the 845 training systems constitute accurate ground truth.
- domain assumption Phase-folded light curves and the 51 extracted features retain sufficient information for both classification and regression.
Reference graph
Works this paper leans on
-
[1]
Armstrong, D. J., Kirk, J., Lam, K. W. F., et al. 2016, Monthly Notices of the Royal Astronomical Society, 456, 2260, doi: 10.1093/mnras/stv2836
-
[2]
Hargis, J. R. 2004, in American Astronomical Society Meeting Abstracts, Vol. 204, American Astronomical Society Meeting Abstracts #204, 05.01
2004
-
[3]
Breiman, L. 2001, Machine Learning, 45, 5, doi: 10.1023/A:1010933404324
-
[4]
Chen, T., & Guestrin, C. 2016, in Proceedings of the 22nd ACM SIGKDD International Conference on Knowledge Discovery and Data Mining, ACM, 785–794, doi: 10.1145/2939672.2939785
-
[5]
Chen, X., Wang, S., Deng, L., et al. 2020, ApJS, 249, 18, doi: 10.3847/1538-4365/ab9cae
-
[6]
Claret, A., & Bloemen, S. 2011, A&A, 529, A75, doi: 10.1051/0004-6361/201116451
-
[7]
2024, AJ, 167, 192, doi: 10.3847/1538-3881/ad3048 D’Isanto, A., & Polsterer, K
Ding, X., Song, Z., Wang, C., & Ji, K. 2024, AJ, 167, 192, doi: 10.3847/1538-3881/ad3048 D’Isanto, A., & Polsterer, K. L. 2018, A&A, 609, A111, doi: 10.1051/0004-6361/201731326
-
[8]
SIAM Journal on Numerical Analysis , author =
Fritsch, F. N., & Carlson, R. E. 1980, SIAM Journal on Numerical Analysis, 17, 238, doi: 10.1137/0717021
-
[9]
Gray, D. F., & Nagel, T. 1989, ApJ, 341, 421, doi: 10.1086/167505
-
[10]
2016, AJ, 151, 68, doi: 10.3847/0004-6256/151/3/68 18
Kirk, B., Conroy, K., Prˇ sa, A., et al. 2016, The Astronomical Journal, 151, 68, doi: 10.3847/0004-6256/151/3/68 Latkovi´ c, O.,ˇCeki, A., & Lazarevi´ c, S. 2021, ApJS, 254, 10, doi: 10.3847/1538-4365/abeb23
-
[11]
2025, ApJS, 277, 51, doi: 10.3847/1538-4365/adba63
Li, K., & Wang, L.-H. 2025, ApJS, 277, 51, doi: 10.3847/1538-4365/adba63
-
[12]
Lucy, L. B. 1967, Zeitschrift f¨ ur Astrophysik, 65, 89
1967
-
[13]
Mahalanobis, P. C. 1936, Proceedings of the National Institute of Sciences of India, 2, 49
1936
-
[14]
2023, A&A, 674, A16, doi: 10.1051/0004-6361/202245330
Mowlavi, N., Holl, B., Lecoeur-Ta¨ ıbi, I., et al. 2023, A&A, 674, A16, doi: 10.1051/0004-6361/202245330
-
[15]
M., Gould, A., Fouqu´ e, P., et al
Nataf, D. M., Gould, A., Fouqu´ e, P., et al. 2013, The Astrophysical Journal, 769, 88, doi: 10.1088/0004-637X/769/2/88 Parimucha, ˇS., Gabdeev, M., Markus, Y., Vaˇ nko, M., & Gajdoˇ s, P. 2025, Astronomy and Computing, 53, 100998, doi: 10.1016/j.ascom.2025.100998
-
[16]
2016, Acta Astronomica, 66, 421, doi: 10.48550/arXiv.1612.06394
Pawlak, M., Soszy´ nski, I., Udalski, A., et al. 2016, Acta Astronomica, 66, 421, doi: 10.48550/arXiv.1612.06394
-
[17]
2011, Journal of Machine Learning Research, 12, 2825
Pedregosa, F., Varoquaux, G., Gramfort, A., et al. 2011, Journal of Machine Learning Research, 12, 2825
2011
-
[18]
Pojmanski, G. 2002, Acta Astronomica, 52, 397, doi: 10.48550/arXiv.astro-ph/0210283 Prˇ sa, A., & Zwitter, T. 2005, ApJ, 628, 426, doi: 10.1086/430591 Prˇ sa, A., Batalha, N., Slawson, R. W., et al. 2011, AJ, 141, 83, doi: 10.1088/0004-6256/141/3/83 Ram´ ırez, I., & Mel´ endez, J. 2005, ApJ, 626, 465, doi: 10.1086/430102 Ruci´ nski, S. M. 1969, Acta Astro...
-
[19]
Rucinski, S. M. 1993, PASP, 105, 1433, doi: 10.1086/133326
-
[20]
M., S´ anchez-Fern´ andez, C., & Gim´ enez,´A
Sarro, L. M., S´ anchez-Fern´ andez, C., & Gim´ enez,´A. 2006, Astronomy & Astrophysics, 446, 395, doi: 10.1051/0004-6361:20052830
-
[21]
Savitzky, A., & Golay, M. J. E. 1964, Analytical Chemistry, 36, 1627, doi: 10.1021/ac60214a047
-
[22]
2025, PASP, 137, 044503, doi: 10.1088/1538-3873/adc5a2
Shan, Y., Chen, J., Zhang, Z., et al. 2025, PASP, 137, 044503, doi: 10.1088/1538-3873/adc5a2
-
[23]
Slawson, R. W., Prˇ sa, A., Welsh, W. F., et al. 2011, AJ, 142, 160, doi: 10.1088/0004-6256/142/5/160 26 Soszy´ nski, I., Pawlak, M., Pietrukowicz, P., et al. 2016, Acta Astronomica, 66, 405, doi: 10.48550/arXiv.1701.03105
-
[24]
M., Torres G., Zejda M., eds, Astronomical Society of the Pacific Conference Series Vol
Southworth, J. 2015, in Astronomical Society of the Pacific Conference Series, Vol. 496, Living Together: Planets, Host Stars and Binaries, ed. S. M. Rucinski, G. Torres, & M. Zejda, 164, doi: 10.48550/arXiv.1411.1219 Von Zeipel, H. 1924, MNRAS, 84, 665, doi: 10.1093/mnras/84.9.665
-
[25]
Wilson, R. E., & Devinney, E. J. 1971, ApJ, 166, 605, doi: 10.1086/150986
-
[26]
E., Devinney, E
Wilson, R. E., Devinney, E. J., & Van Hamme, W. 2020, WD: Wilson-Devinney binary star modeling, http://ascl.net/2004.004
2020
-
[27]
2019, MNRAS, 489, 1644, doi: 10.1093/mnras/stz2137
Windemuth, D., Agol, E., Ali, A., & Kiefer, F. 2019, MNRAS, 489, 1644, doi: 10.1093/mnras/stz2137
-
[28]
Xiong, J., Ding, X., Li, J., et al. 2024, ApJS, 270, 20, doi: 10.3847/1538-4365/ad0ceb 27 APPENDIX A.FORMULATION FOR EVALUATION METRICS To quantify the reliability of our predictions for uncharacterized systems, we formulated confidence scores based on the consensus of the ensemble. For continuous regression parameters (q, i, T e2 /Te1 ,Ω 1,Ω 2), we utili...
discussion (0)
Sign in with ORCID, Apple, or X to comment. Anyone can read and Pith papers without signing in.