Recognition: unknown
Fast-Cooling Synchrotron in Decaying Magnetic Fields: Implications for the GRB Spectral Distribution
Pith reviewed 2026-05-09 23:55 UTC · model grok-4.3
The pith
Decaying magnetic fields can harden the low-energy index in fast-cooling synchrotron spectra of gamma-ray bursts but leave the population distribution too soft.
A machine-rendered reading of the paper's core claim, the machinery that carries it, and where it could break.
Core claim
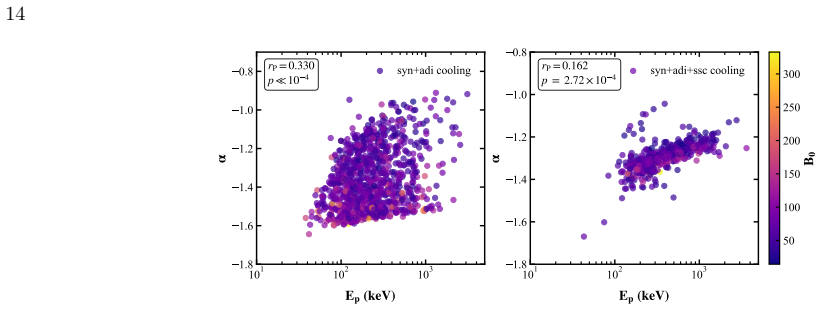
Fast-cooling synchrotron emission in a decaying magnetic field yields synthetic spectra whose Band-fit low-energy indices alpha lie mostly between -1.5 and -0.8 and center around -1.5, even after instrument folding and Monte Carlo sampling that mimics the GBM catalog; SSC cooling adds only modest extra hardening that does not stabilize alpha near the observed peak.
What carries the argument
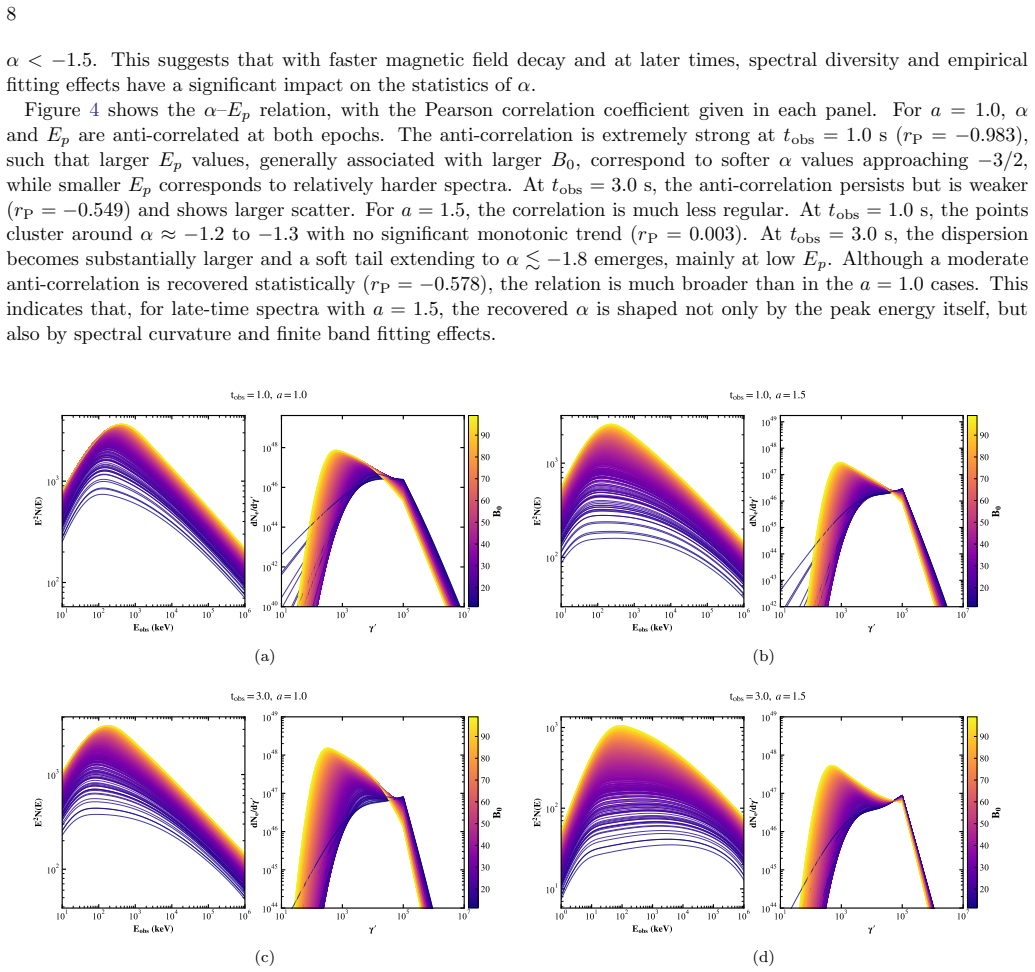
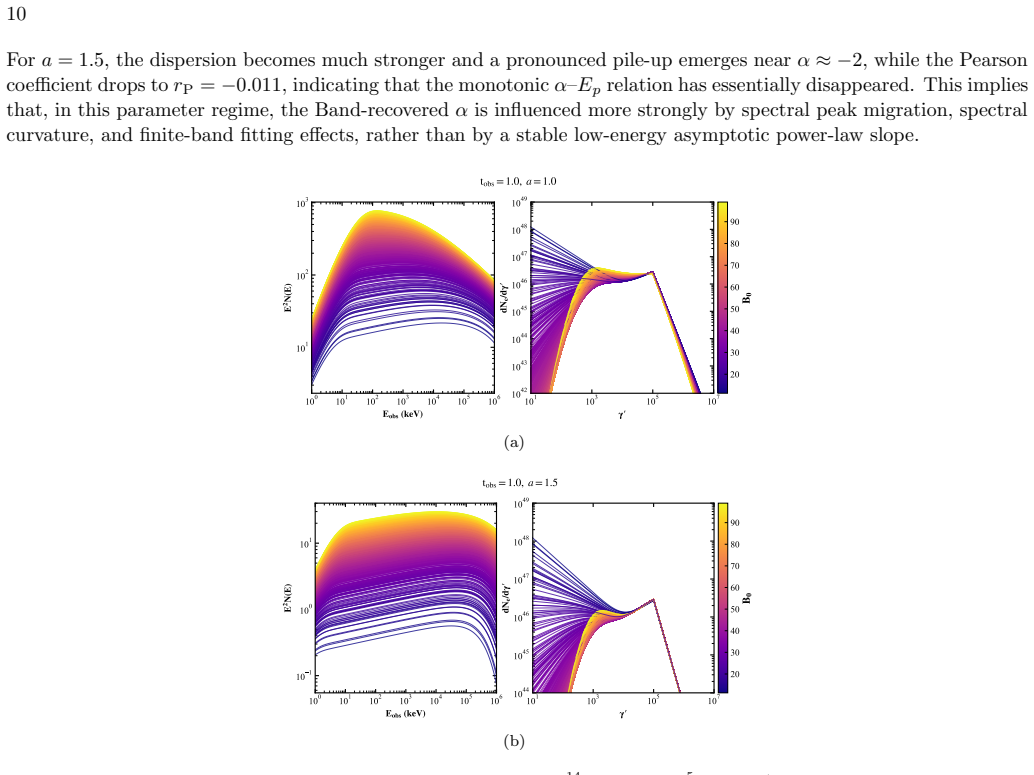
The time-dependent solution of the electron continuity equation with synchrotron, adiabatic, and synchrotron self-Compton losses under a prescribed decaying magnetic-field profile, followed by forward-folding of the resulting photon spectra through GBM response matrices and refitting with the Band function.
If this is right
- Catalog alpha values frequently represent an effective in-band slope rather than the true asymptotic low-energy index.
- SSC cooling contributes modest additional hardening but does not move the population distribution to the observed peak.
- Shifting the peak energy relative to the detector band or altering the magnetic-field decay law can reshape the recovered alpha distribution substantially.
- Decaying-field models alleviate overly soft spectra only in restricted parts of parameter space and remain insufficient at the population level.
Where Pith is reading between the lines
- Models that combine decaying fields with slow-cooling segments or modified acceleration could be tested next to see whether they reach the observed alpha peak.
- The strong sensitivity of recovered alpha to peak-energy location suggests that selection biases in the catalog may need explicit debiasing before model comparison.
- If future instruments with broader energy coverage measure the true asymptotic index directly, they would provide a cleaner test of whether decaying fields are operating.
Load-bearing premise
That the chosen functional form and radial range of magnetic-field decay, together with the explored peak-energy locations and Monte Carlo sampling, adequately capture the physical conditions and selection effects in real gamma-ray bursts.
What would settle it
If a larger Monte Carlo ensemble with the same decaying-field prescription produces an alpha distribution whose peak and width match the GBM catalog after identical selection cuts, the claim that additional processes are required would be falsified; persistent centering near -1.5 while data peak near -1 would confirm the shortfall.
Figures


read the original abstract
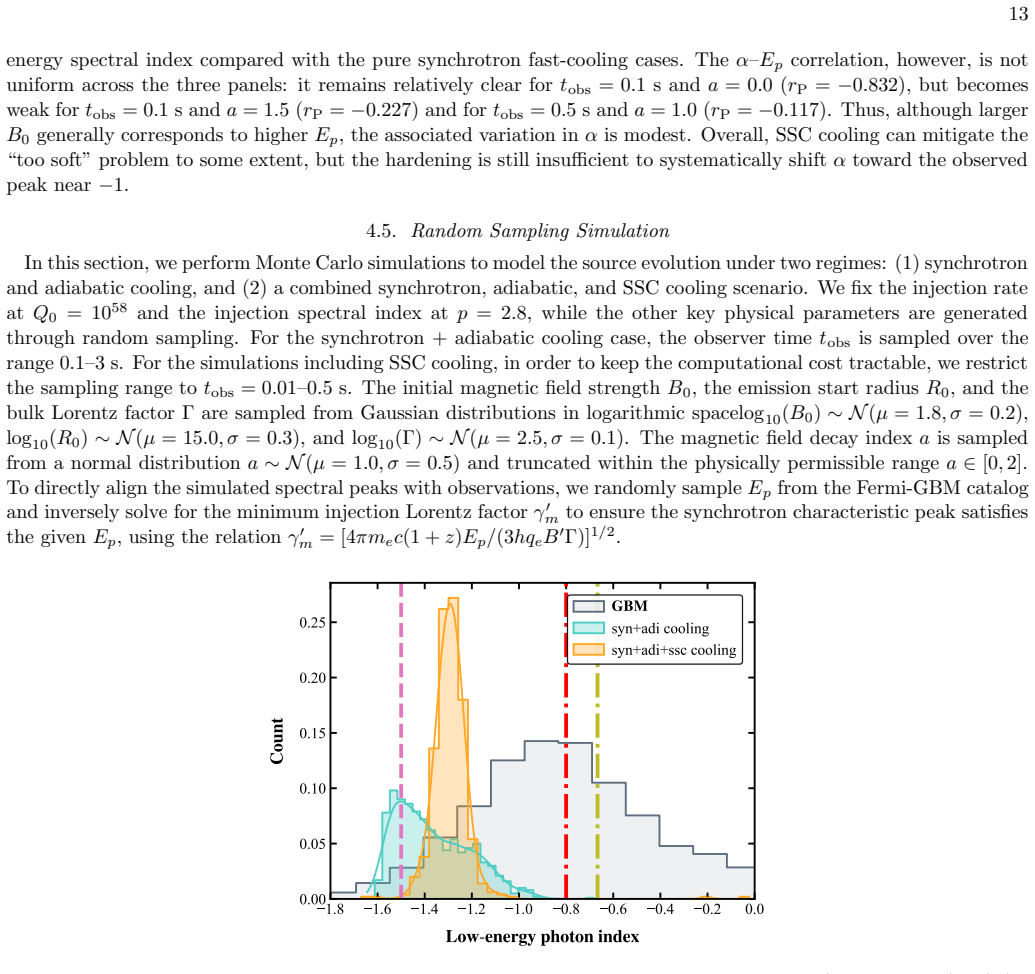
The prompt-emission spectra of gamma-ray bursts (GRBs) are commonly described by the empirical Band function. The typical low-energy spectral index is $\sim -1$, which poses a challenge to standard synchrotron radiation models. We systematically investigate a fast-cooling synchrotron model with a decaying magnetic field and test, within an observation-consistent pipeline, whether it reproduces the Band-fit parameter distributions in the GBM catalog, in a statistical sense. We solve the electron continuity equation with synchrotron, adiabatic, and synchrotron self-Compton cooling to obtain the time-dependent electron distribution and synthetic spectra; we then forward-fold through the GBM response matrices and recover $(\alpha, \beta, E_p)$ with Band fits. We find that magnetic-field decay can harden the recovered $\alpha$ relative to the fast-cooling limit in part of parameter space, but the effect is not robust and is sensitive to the location of $E_p$ within the finite band and to spectral curvature; varying key physical scales reshapes the recovered $\alpha$ distribution, indicating that catalog $\alpha$ often represents an effective in-band slope rather than the asymptotic index. SSC cooling provides modest additional hardening and, in our setups, does not stabilize $\alpha$ near the observed peak. Using Monte Carlo samples designed to mimic the observations, the model yields $\alpha$ mostly between $-1.5$ and $-0.8$, but remains centered around $\alpha \approx -1.5$. Overall, while decaying-field fast-cooling synchrotron can partially alleviate overly soft spectra expected from standard fast-cooling synchrotron emission, it still falls short of reproducing the GBM $\alpha$ distribution at the population level, implying that additional physical processes are required.
Editorial analysis
A structured set of objections, weighed in public.
Referee Report
Summary. The paper claims that fast-cooling synchrotron emission in a decaying magnetic field can partially harden the recovered low-energy Band index α relative to the canonical fast-cooling value of -1.5, but when electron distributions are obtained from the continuity equation (including synchrotron, adiabatic and SSC cooling), synthetic spectra are forward-folded through GBM response matrices, and Band fits are performed on Monte Carlo samples designed to mimic observations, the resulting α distribution remains centered near -1.5 and does not reproduce the GBM catalog at the population level, implying additional physical processes are required. The analysis stresses sensitivity of α to Ep location within the finite band and to spectral curvature.
Significance. If the result holds, the work is significant because it supplies a quantitative, instrument-consistent test of a frequently invoked modification to the standard synchrotron model for GRB prompt emission. Credit is due for solving the time-dependent continuity equation with multiple cooling channels, performing forward-folding through real GBM matrices, and using Monte Carlo sampling that attempts to replicate observational selection. The explicit demonstration that catalog α often represents an effective in-band slope rather than the asymptotic index is a useful clarification for the field.
major comments (2)
- [Abstract] Abstract: the load-bearing claim that the model 'still falls short of reproducing the GBM α distribution at the population level' rests on the specific functional forms and explored range of magnetic-field decay together with the chosen Ep placements; because the text itself notes that varying key physical scales reshapes the recovered α distribution, the conclusion requires either a broader parameter survey or a quantitative justification that the adopted decay laws and Ep sampling bracket the relevant physical regimes.
- [Abstract] Abstract (Monte Carlo description): the statement that 'Monte Carlo samples designed to mimic the observations' yield α mostly between -1.5 and -0.8 is central to the population-level result; the precise implementation of observational selection effects, the prior on Ep relative to the GBM band, and the treatment of spectral curvature must be shown to be representative, otherwise the reported shortfall could be an artifact of the particular parametrization.
minor comments (2)
- [Abstract] Abstract: state the exact functional forms (e.g., power-law index range or exponential decay timescale) adopted for B(t) so that the sensitivity analysis can be reproduced.
- Ensure that the definitions of all cooling terms in the continuity equation and the precise Band-fitting procedure (energy range, background subtraction) are given with equation numbers in the methods section.
Simulated Author's Rebuttal
We thank the referee for the careful and constructive review. The comments correctly identify that our population-level conclusion depends on the explored parameter space and Monte Carlo implementation. We address each point below and will revise the manuscript to provide the requested clarifications and expansions.
read point-by-point responses
-
Referee: [Abstract] Abstract: the load-bearing claim that the model 'still falls short of reproducing the GBM α distribution at the population level' rests on the specific functional forms and explored range of magnetic-field decay together with the chosen Ep placements; because the text itself notes that varying key physical scales reshapes the recovered α distribution, the conclusion requires either a broader parameter survey or a quantitative justification that the adopted decay laws and Ep sampling bracket the relevant physical regimes.
Authors: We agree that a broader survey would further strengthen the result. The manuscript already explores decay indices q = 0–2 (motivated by expanding-shell models) and Ep placements across the GBM band, showing that the recovered α distribution remains centered near −1.5 despite partial hardening in limited regimes. To address the concern quantitatively, we will add an expanded parameter study in the revised version that includes additional decay functional forms and Ep priors drawn directly from the GBM catalog, thereby demonstrating that the shortfall persists across representative regimes. revision: partial
-
Referee: [Abstract] Abstract (Monte Carlo description): the statement that 'Monte Carlo samples designed to mimic the observations' yield α mostly between -1.5 and -0.8 is central to the population-level result; the precise implementation of observational selection effects, the prior on Ep relative to the GBM band, and the treatment of spectral curvature must be shown to be representative, otherwise the reported shortfall could be an artifact of the particular parametrization.
Authors: The Monte Carlo samples draw Ep from a distribution consistent with GBM catalog statistics, incorporate fluence-based selection effects calibrated to detection thresholds, and treat spectral curvature by forward-folding the full time-dependent synthetic spectra through real GBM response matrices before performing Band fits. We will revise the methods section to include an explicit description of these choices together with sensitivity tests that vary the selection function and Ep prior, confirming that the reported α distribution is robust and representative rather than an artifact of the specific setup. revision: yes
Circularity Check
No significant circularity; model spectra derived from continuity equation and compared to external GBM catalog.
full rationale
The derivation begins by solving the electron continuity equation including synchrotron, adiabatic, and SSC cooling terms to obtain the time-dependent electron distribution and resulting synthetic spectra. These spectra are then forward-folded through GBM response matrices and refitted with the Band function to recover (α, β, Ep). Monte Carlo sampling is used to explore parameter space and mimic observational selection, but no parameters are fitted to the target α distribution itself. The central claim—that decaying B-fields only partially harden α and still center around ≈−1.5, falling short of the observed GBM peak—is obtained by direct statistical comparison to the external catalog. No equation reduces the reported α distribution to a fitted input, no self-citation chain bears the load of the result, and no ansatz is smuggled in via prior work by the same authors. The exploration of B(t) decay forms and Ep locations is an ansatz choice, but it is not equivalent to the output by construction.
Axiom & Free-Parameter Ledger
free parameters (2)
- magnetic field decay index or timescale
- Ep location relative to GBM band
axioms (1)
- domain assumption Electron number density evolves according to the continuity equation that includes synchrotron, adiabatic, and synchrotron self-Compton cooling terms.
Reference graph
Works this paper leans on
-
[1]
Abdo, A. A., Ackermann, M., Ajello, M., et al. 2009, ApJL, 706, L138, doi: 10.1088/0004-637X/706/1/L138
-
[2]
2009, ApJ, 705, 1714, doi: 10.1088/0004-637X/705/2/1714
Asano, K., & Terasawa, T. 2009, ApJ, 705, 1714, doi: 10.1088/0004-637X/705/2/1714
-
[3]
2015, MNRAS, 454, 2242, doi: 10.1093/mnras/stv2152
Asano, K., & Terasawa, T. 2015, MNRAS, 454, 2242, doi: 10.1093/mnras/stv2152
-
[4]
Ascenzi, S., Oganesyan, G., Salafia, O. S., et al. 2020, A&A, 641, A61, doi: 10.1051/0004-6361/202038265
-
[5]
1993, ApJ, 413, 281, doi: 10.1086/172995
Band, D., Matteson, J., Ford, L., et al. 1993, ApJ, 413, 281, doi: 10.1086/172995
-
[6]
Beloborodov, A. M. 2010, MNRAS, 407, 1033, doi: 10.1111/j.1365-2966.2010.16770.x Boˇ snjak,ˇZ., & Daigne, F. 2014, A&A, 568, A45, doi: 10.1051/0004-6361/201322341
-
[7]
Burgess, J. M. 2014, MNRAS, 445, 2589, doi: 10.1093/mnras/stu1925 17
-
[8]
Burgess, J. M. 2019, A&A, 629, A69, doi: 10.1051/0004-6361/201935140
-
[9]
M., B´egu´e, D., Greiner, J., et al
Burgess, J. M., B´ egu´ e, D., Greiner, J., et al. 2020, Nature Astronomy, 4, 174, doi: 10.1038/s41550-019-0911-z
-
[10]
Burgess, J. M., Ryde, F., & Yu, H.-F. 2015, MNRAS, 451, 1511, doi: 10.1093/mnras/stv775
-
[11]
Journal of Computational Physics , volume =
Chang, J., & Cooper, G. 1970, Journal of Computational Physics, 6, 1, doi: https://doi.org/10.1016/0021-9991(70)90001-X
-
[12]
2022, ApJ, 932, 25, doi: 10.3847/1538-4357/ac6c2a
Chen, J.-M., Peng, Z.-Y., Du, T.-T., & Yin, Y. 2022, ApJ, 932, 25, doi: 10.3847/1538-4357/ac6c2a
-
[13]
Cheng, K. F., Zhao, X. H., & Bai, J. M. 2020, MNRAS, 498, 3492, doi: 10.1093/mnras/staa2595
-
[14]
2025, A&A, 693, A320, doi: 10.1051/0004-6361/202451369
Daigne, F., & Boˇ snjak,ˇZ. 2025, A&A, 693, A320, doi: 10.1051/0004-6361/202451369
-
[15]
2011, A&A, 526, A110, doi: 10.1051/0004-6361/201015457
Daigne, F., Boˇ snjak,ˇZ., & Dubus, G. 2011, A&A, 526, A110, doi: 10.1051/0004-6361/201015457
-
[16]
Daigne, F., & Mochkovitch, R. 1998, MNRAS, 296, 275, doi: 10.1046/j.1365-8711.1998.01305.x
-
[17]
2014, ApJ, 785, 112, doi: 10.1088/0004-637X/785/2/112
Deng, W., & Zhang, B. 2014, ApJ, 785, 112, doi: 10.1088/0004-637X/785/2/112
-
[18]
Finke, J. D., Dermer, C. D., & B¨ ottcher, M. 2008, ApJ, 686, 181, doi: 10.1086/590900
-
[19]
2025, ApJ, 986, 106, doi: 10.3847/1538-4357/adceb1
Gao, H.-X., Geng, J.-J., Liang, Y.-F., et al. 2025, ApJ, 986, 106, doi: 10.3847/1538-4357/adceb1
-
[20]
2017, ApJL, 841, L15, doi: 10.3847/2041-8213/aa725a
Geng, J.-J., Huang, Y.-F., & Dai, Z.-G. 2017, ApJL, 841, L15, doi: 10.3847/2041-8213/aa725a
-
[21]
Geng, J.-J., Huang, Y.-F., Wu, X.-F., Zhang, B., & Zong, H.-S. 2018, ApJS, 234, 3, doi: 10.3847/1538-4365/aa9e84
-
[22]
2013, MNRAS, 432, 3237, doi: 10.1093/mnras/stt681
Ghirlanda, G., Pescalli, A., & Ghisellini, G. 2013, MNRAS, 432, 3237, doi: 10.1093/mnras/stt681
-
[23]
Goldstein, A., Burgess, J. M., Preece, R. D., et al. 2012, ApJS, 199, 19, doi: 10.1088/0067-0049/199/1/19
-
[24]
2014, ApJS, 211, 12, doi: 10.1088/0067-0049/211/1/12
Gruber, D., Goldstein, A., Weller von Ahlefeld, V., et al. 2014, ApJS, 211, 12, doi: 10.1088/0067-0049/211/1/12
-
[25]
Hartmann, D. H. 2017, ApJ, 846, 138, doi: 10.3847/1538-4357/aa81c2
-
[26]
2013, ApJ, 770, 32, doi: 10.1088/0004-637X/770/1/32
Guiriec, S., Daigne, F., Hasco¨ et, R., et al. 2013, ApJ, 770, 32, doi: 10.1088/0004-637X/770/1/32
-
[27]
Kaneko, Y., Preece, R. D., Briggs, M. S., et al. 2006, ApJS, 166, 298, doi: 10.1086/505911
-
[28]
The Physics of Gamma-Ray Bursts and Relativistic Jets
Kumar, P., & Zhang, B. 2015, PhR, 561, 1, doi: 10.1016/j.physrep.2014.09.008
work page Pith review doi:10.1016/j.physrep.2014.09.008 2015
-
[29]
Lazzati, D., & Begelman, M. C. 2010, ApJ, 725, 1137, doi: 10.1088/0004-637X/725/1/1137
-
[30]
2019, ApJS, 245, 7, doi: 10.3847/1538-4365/ab42de
Li, L. 2019, ApJS, 245, 7, doi: 10.3847/1538-4365/ab42de
-
[31]
2020, ApJL, 893, L14, doi: 10.3847/2041-8213/ab838e
Liu, K., Lin, D.-B., Wang, K., et al. 2020, ApJL, 893, L14, doi: 10.3847/2041-8213/ab838e
-
[32]
Lloyd, N. M., & Petrosian, V. 2000, ApJ, 543, 722, doi: 10.1086/317125
-
[33]
Longair, M. S. 2011, High Energy Astrophysics, 3rd edn. (Cambridge: Cambridge University Press)
2011
-
[34]
2013, MNRAS, 428, 2430, doi: 10.1093/mnras/sts219
Lundman, C., Pe’er, A., & Ryde, F. 2013, MNRAS, 428, 2430, doi: 10.1093/mnras/sts219 M´ esz´ aros, P., & Rees, M. J. 2000, ApJ, 530, 292, doi: 10.1086/308371
-
[35]
Meszaros, P., Rees, M. J., & Papathanassiou, H. 1994, ApJ, 432, 181, doi: 10.1086/174559
-
[36]
Nakar, E., Ando, S., & Sari, R. 2009, ApJ, 703, 675, doi: 10.1088/0004-637X/703/1/675 Planck Collaboration, Aghanim, N., Akrami, Y., et al. 2020, A&A, 641, A6, doi: 10.1051/0004-6361/201833910
-
[37]
Preece, R. D., Briggs, M. S., Mallozzi, R. S., et al. 1998, ApJL, 506, L23, doi: 10.1086/311644
-
[38]
Preece, R. D., Briggs, M. S., Mallozzi, R. S., et al. 2000, ApJS, 126, 19, doi: 10.1086/313289
-
[39]
B., & Lightman, A
Rybicki, G. B., & Lightman, A. P. 1979, Radiative processes in astrophysics (New York: Interscience)
1979
-
[40]
Ryde, F., Axelsson, M., Zhang, B. B., et al. 2010, ApJL, 709, L172, doi: 10.1088/2041-8205/709/2/L172
-
[41]
Ryde, F., Pe’er, A., Nymark, T., et al. 2011, MNRAS, 415, 3693, doi: 10.1111/j.1365-2966.2011.18985.x
-
[42]
2015, MNRAS, 450, 3549, doi: 10.1093/mnras/stv766
Nappo, F. 2015, MNRAS, 450, 3549, doi: 10.1093/mnras/stv766
-
[43]
1998, ApJL, 497, L17, doi: 10.1086/311269
Sari, R., Piran, T., & Narayan, R. 1998, ApJL, 497, L17, doi: 10.1086/311269
-
[44]
C., Daigne, F., & Drenkhahn, G
Spruit, H. C., Daigne, F., & Drenkhahn, G. 2001, A&A, 369, 694, doi: 10.1051/0004-6361:20010131
-
[45]
2021, ApJ, 922, 255, doi: 10.3847/1538-4357/ac26ba
Tang, Q.-W., Wang, K., Li, L., & Liu, R.-Y. 2021, ApJ, 922, 255, doi: 10.3847/1538-4357/ac26ba
-
[46]
Uhm, Z. L., Tak, D., Zhang, B., et al. 2024, ApJL, 963, L30, doi: 10.3847/2041-8213/ad28b7
-
[47]
Uhm, Z. L., & Zhang, B. 2014, Nature Physics, 10, 351, doi: 10.1038/nphys2932
-
[48]
Uhm, Z. L., & Zhang, B. 2016, ApJ, 825, 97, doi: 10.3847/0004-637X/825/2/97
-
[49]
L., Zhang, B., Hasco¨ et, R., et al
Uhm, Z. L., Zhang, B., Hasco¨ et, R., et al. 2012, ApJ, 761, 147, doi: 10.1088/0004-637X/761/2/147
-
[50]
Vianello, G., Lauer, R. J., Younk, P., et al. 2015, arXiv e-prints, arXiv:1507.08343, doi: 10.48550/arXiv.1507.08343
-
[51]
2021, Galaxies, 9, 68, doi: 10.3390/galaxies9030068
Wang, K., & Dai, Z.-G. 2021, Galaxies, 9, 68, doi: 10.3390/galaxies9030068
-
[52]
2009, ApJL, 698, L98, doi: 10.1088/0004-637X/698/2/L98
Wang, X.-Y., Li, Z., Dai, Z.-G., & M´ esz´ aros, P. 2009, ApJL, 698, L98, doi: 10.1088/0004-637X/698/2/L98
-
[53]
2018, ApJ, 853, 43, doi: 10.3847/1538-4357/aaa0ca 18
Xu, S., Yang, Y.-P., & Zhang, B. 2018, ApJ, 853, 43, doi: 10.3847/1538-4357/aaa0ca 18
-
[54]
2016, MNRAS, 459, 3175, doi: 10.1093/mnras/stw739
Yan, D., Zhang, L., & Zhang, S.-N. 2016, MNRAS, 459, 3175, doi: 10.1093/mnras/stw739
-
[55]
Yu, H.-F., van Eerten, H. J., Greiner, J., et al. 2015, A&A, 583, A129, doi: 10.1051/0004-6361/201527015
-
[56]
2014, International Journal of Modern Physics D, 23, 1430002, doi: 10.1142/S021827181430002X
Zhang, B. 2014, International Journal of Modern Physics D, 23, 1430002, doi: 10.1142/S021827181430002X
-
[57]
Zhang, B. 2018, The Physics of Gamma-Ray Bursts (Cambridge: Cambridge University Press), doi: 10.1017/9781139226530
-
[58]
2011, ApJ, 726, 90, doi: 10.1088/0004-637X/726/2/90
Zhang, B., & Yan, H. 2011, ApJ, 726, 90, doi: 10.1088/0004-637X/726/2/90
-
[59]
2016, ApJ, 816, 72, doi: 10.3847/0004-637X/816/2/72
Zhang, B.-B., Uhm, Z. L., Connaughton, V., Briggs, M. S., & Zhang, B. 2016, ApJ, 816, 72, doi: 10.3847/0004-637X/816/2/72
-
[60]
2009, ApJL, 690, L10, doi: 10.1088/0004-637X/690/1/L10
Zhang, B.-B., Zhang, B., Liang, E.-W., & Wang, X.-Y. 2009, ApJL, 690, L10, doi: 10.1088/0004-637X/690/1/L10
-
[61]
2011, ApJ, 730, 141, doi: 10.1088/0004-637X/730/2/141
Zhang, B.-B., Zhang, B., Liang, E.-W., et al. 2011, ApJ, 730, 141, doi: 10.1088/0004-637X/730/2/141
-
[62]
2014, ApJ, 780, 12, doi: 10.1088/0004-637X/780/1/12
Zhao, X., Li, Z., Liu, X., et al. 2014, ApJ, 780, 12, doi: 10.1088/0004-637X/780/1/12
discussion (0)
Sign in with ORCID, Apple, or X to comment. Anyone can read and Pith papers without signing in.