Recognition: unknown
SHARELIFE Imputations
Pith reviewed 2026-05-09 23:04 UTC · model grok-4.3
The pith
SHARELIFE life-course data receive multiple imputations via fully conditional specification that align with observed responses and external benchmarks.
A machine-rendered reading of the paper's core claim, the machinery that carries it, and where it could break.
Core claim
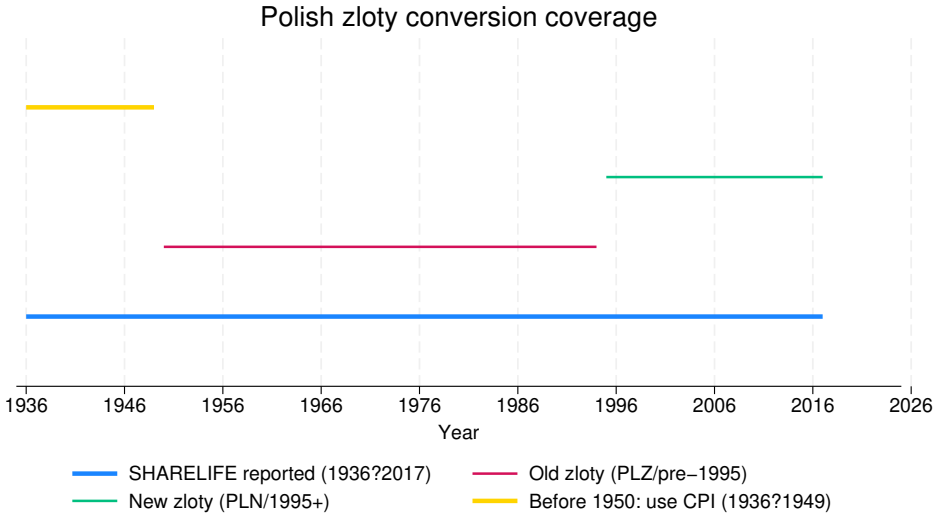
The central claim is that an imputation model based on fully conditional specification, after appropriate data harmonization that includes currency conversions across time periods, generates completed SHARELIFE records whose distributions are consistent both internally with the observed cases and externally with alternative nonresponse corrections and with data from the regular SHARE waves.
What carries the argument
The fully conditional specification imputation procedure, which draws each incomplete variable in turn from a conditional model given all other variables and repeats the cycle to produce multiple completed datasets.
If this is right
- Analyses of life-course transitions can retain the full sample rather than dropping respondents who have any missing retrospective items.
- Results obtained from the imputed files can be checked for sensitivity by comparing them with estimates that use inverse-propensity weighting on the same incomplete data.
- The completed datasets support pooled analyses that combine SHARELIFE information with the longitudinal measures collected in the standard SHARE waves.
Where Pith is reading between the lines
- Researchers studying retirement or health trajectories can now include individuals who would otherwise be excluded because of incomplete life-history modules.
- The same preparation and imputation workflow could be applied to other retrospective surveys that collect biographical data across multiple domains and currencies.
- If later waves add new observations on the same individuals, the imputed baseline values can serve as starting points for dynamic models of change.
Load-bearing premise
The missing values are missing at random given the other variables that are included in the imputation models.
What would settle it
A direct comparison in which the distribution of imputed pension amounts or employment durations deviates systematically from the distribution seen in the non-missing cases or from the corresponding distribution in the regular SHARE waves for the same birth cohorts.
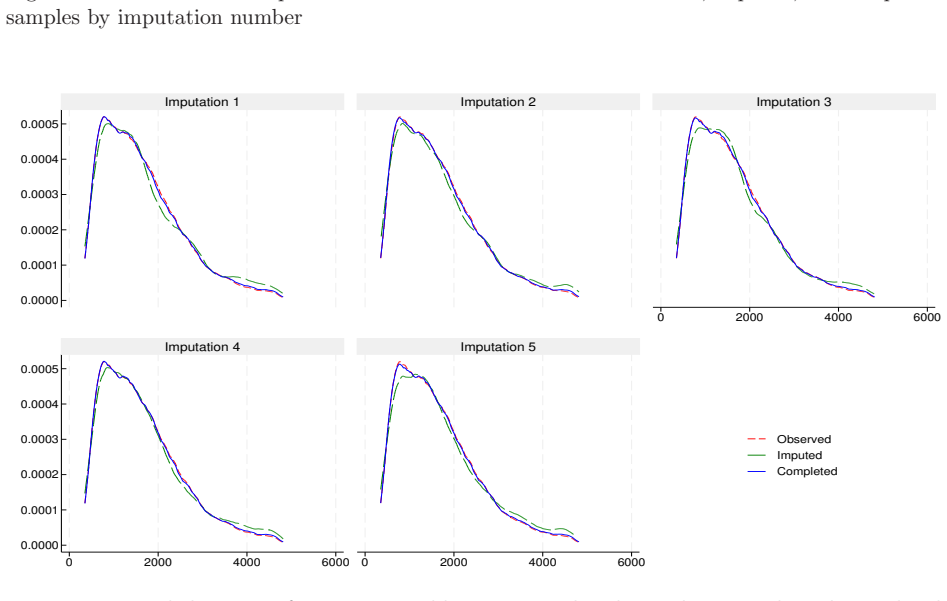
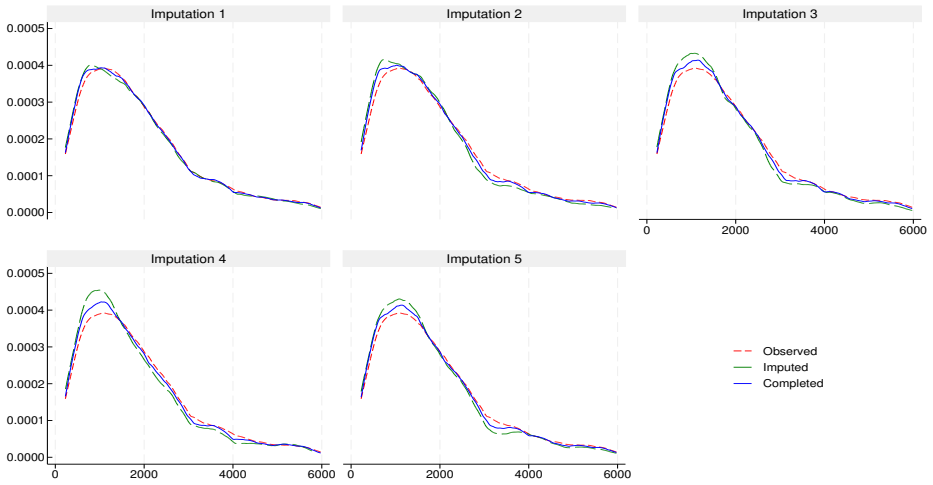
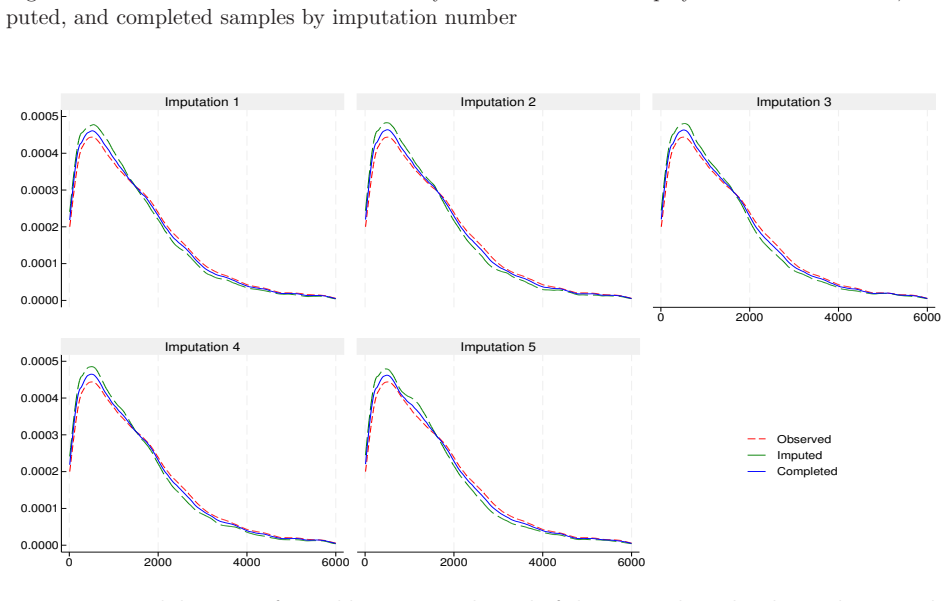
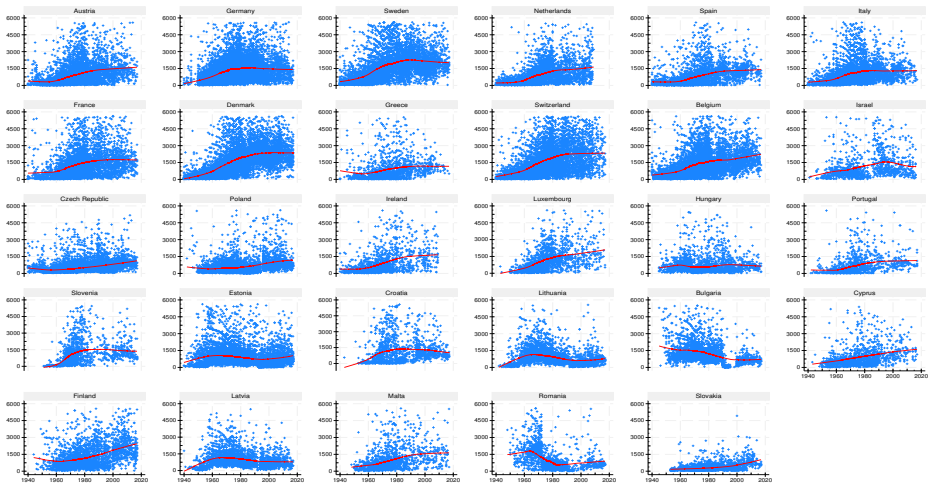
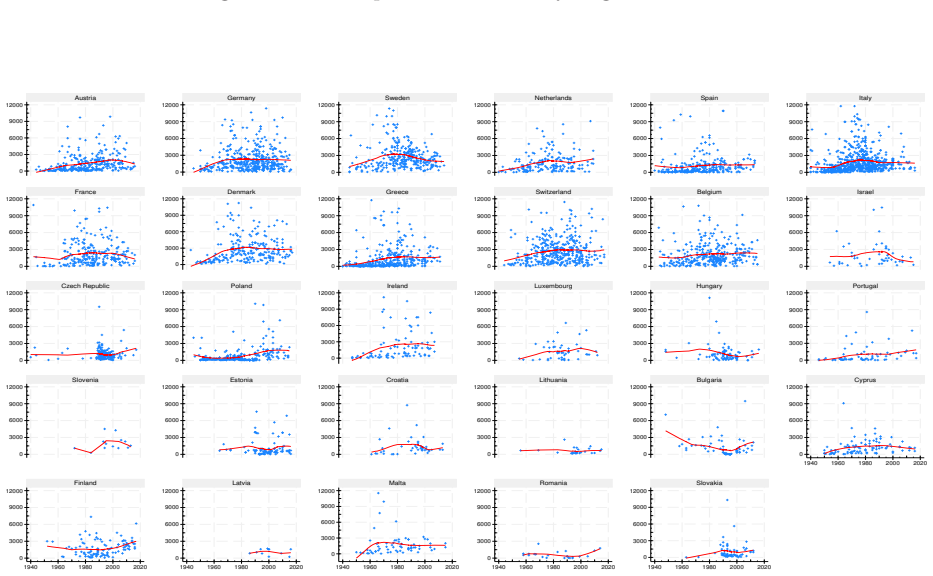
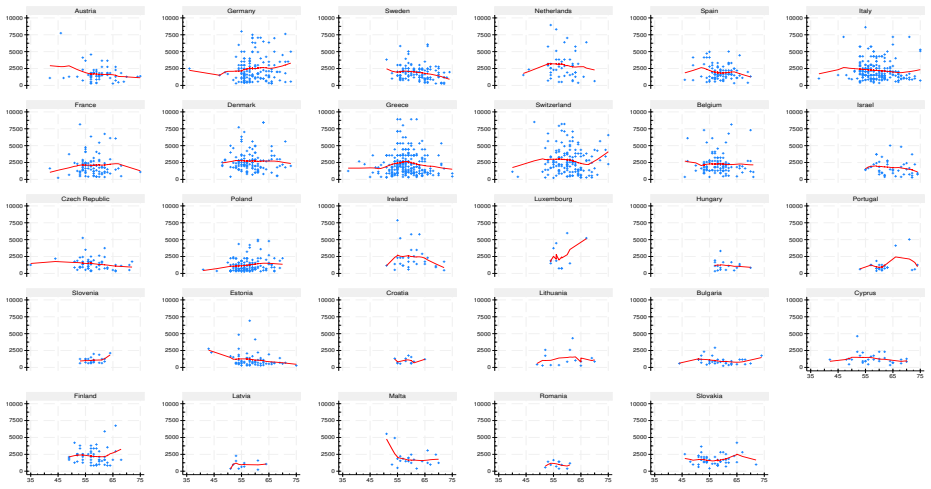
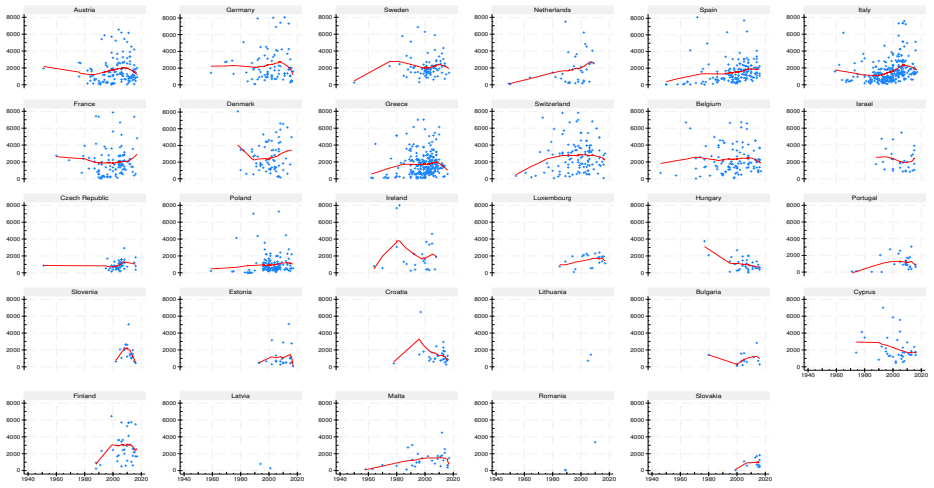
Figures


read the original abstract
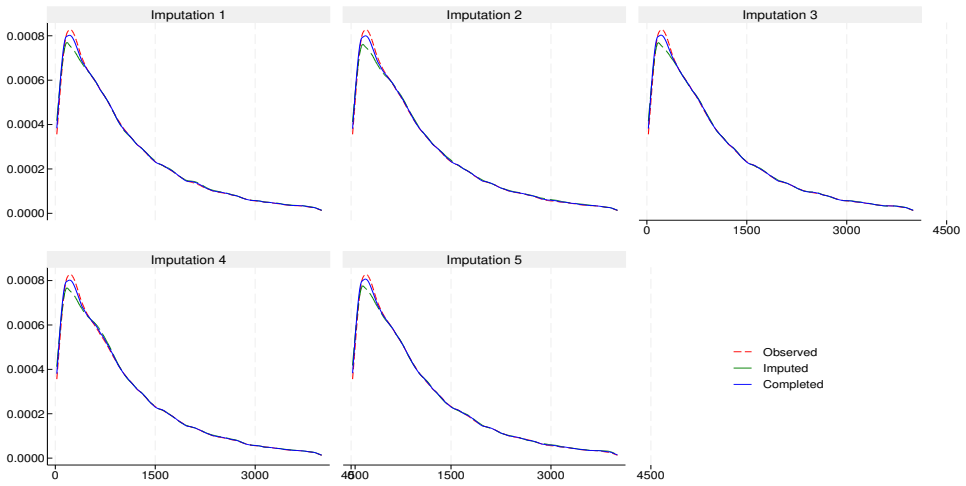
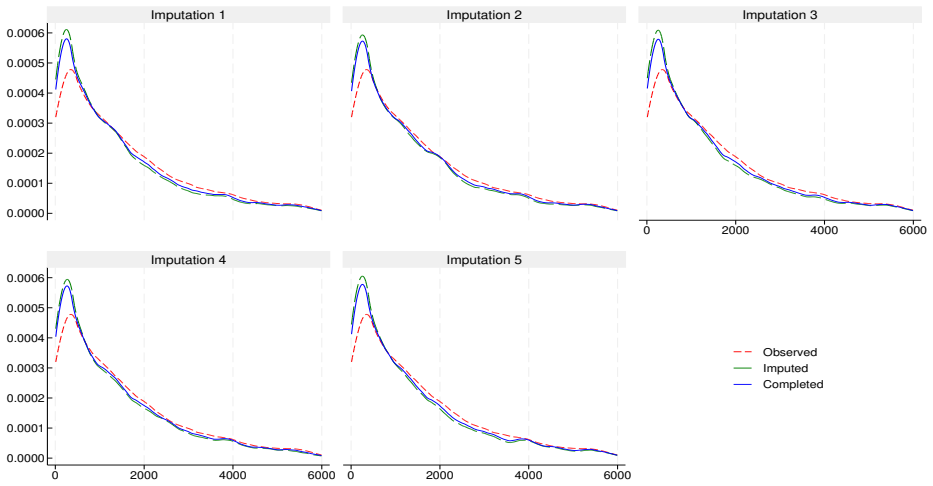
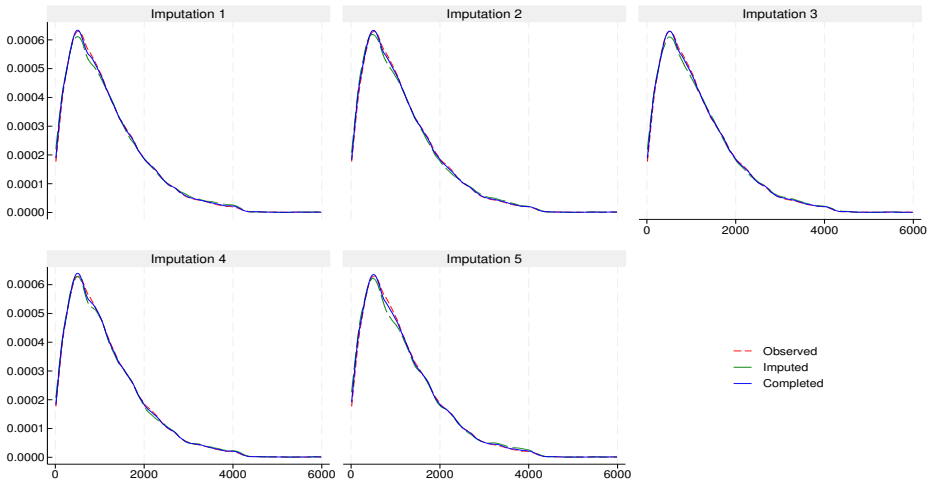
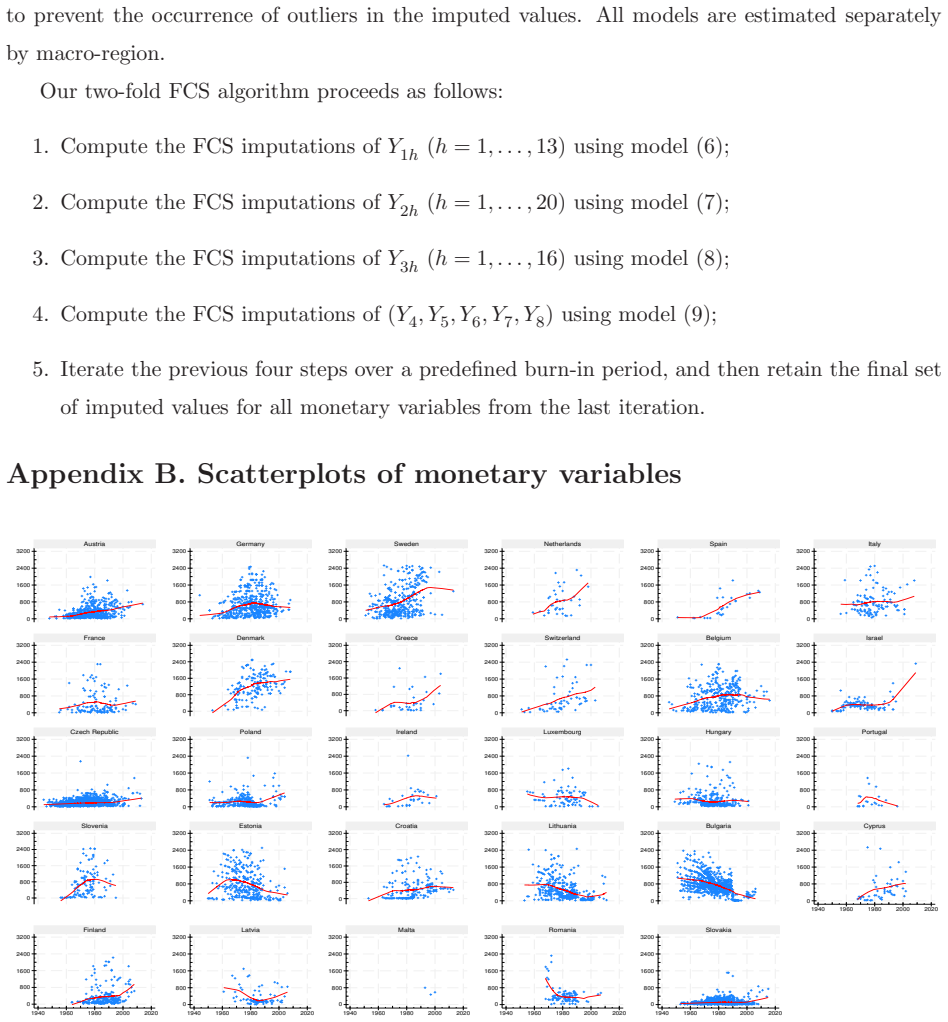
This report describes the SHARELIFE-MI project, which aims to generate multiple imputations for missing values in the life-course data collected in SHARELIFE Waves 3 and 7. The SHARELIFE study reconstructs individual life histories through retrospective questions covering key biographical domains such as partnerships, fertility, employment, and residence. As in the regular SHARE waves, item nonresponse represents an important source of nonsampling error - particularly for monetary variables, which require conversions across multiple currencies and long time periods. We document the preliminary data recoding and harmonization steps, as well as the design, specification, and implementation of an imputation model based on the fully conditional specification approach. Finally, we assess the internal and external validity of the resulting imputations through comparisons with the observed data, alternative nonresponse adjustments based on inverse propensity weighting, and external benchmarks from the regular SHARE waves.
Editorial analysis
A structured set of objections, weighed in public.
Referee Report
Summary. The manuscript describes the SHARELIFE-MI project, which generates multiple imputations for item nonresponse in retrospective life-course data from SHARELIFE Waves 3 and 7. It details data recoding and harmonization, specifies an imputation model via fully conditional specification (FCS), and evaluates the resulting imputations for internal and external validity through comparisons with observed data, inverse propensity weighting adjustments, and external benchmarks from regular SHARE waves.
Significance. If the validity assessments hold, the work supplies a practical resource that can reduce bias from nonresponse in analyses of partnerships, fertility, employment, and residence histories, thereby increasing the usability of SHARELIFE for life-course research.
major comments (2)
- [Imputation model specification and internal validity assessment] The FCS imputation design imputes each variable from its own conditional model without built-in rejection sampling or post-processing to enforce temporal and logical constraints across interdependent events (e.g., child birth year must follow parent birth year + 15 and precede the survey year; partnership end dates must follow start dates). The internal validity checks compare only univariate or low-order moments with observed cases or IPW-adjusted estimates and therefore cannot detect joint violations. If the fraction of inconsistent imputed trajectories exceeds the near-zero rate observed in complete cases, the claim that the imputations match the true conditional distribution under the MAR assumption fails regardless of marginal agreement. (Imputation model specification and internal validity assessment sections.)
- [Validation approaches] No model equations, convergence diagnostics, fraction of missing information, or quantitative comparison metrics (e.g., standardized differences, overlap statistics) are reported, leaving the central claim of 'good internal and external validity' only partially supported by the described validation approaches. (Validation approaches section.)
minor comments (2)
- [Abstract] The abstract outlines the three validation approaches but does not summarize any numerical findings from them.
- [References] Add explicit references to standard FCS literature (van Buuren & Groothuis-Oudshoorn) and to SHARELIFE documentation for the harmonization steps.
Simulated Author's Rebuttal
We thank the referee for the constructive and detailed comments on our manuscript. We address each major comment below and indicate the revisions that will be incorporated in the next version.
read point-by-point responses
-
Referee: [Imputation model specification and internal validity assessment] The FCS imputation design imputes each variable from its own conditional model without built-in rejection sampling or post-processing to enforce temporal and logical constraints across interdependent events (e.g., child birth year must follow parent birth year + 15 and precede the survey year; partnership end dates must follow start dates). The internal validity checks compare only univariate or low-order moments with observed cases or IPW-adjusted estimates and therefore cannot detect joint violations. If the fraction of inconsistent imputed trajectories exceeds the near-zero rate observed in complete cases, the claim that the imputations match the true conditional distribution under the MAR assumption fails regardless of marginal agreement. (Imputation model specification and internal validity assessment sections.)
Authors: We agree that the absence of explicit rejection sampling or post-processing for all temporal and logical constraints represents a limitation of the current FCS implementation. While the imputation sequence and predictor choices incorporated some basic ordering constraints (e.g., parent birth years before child birth years), comprehensive enforcement across all interdependent events was not applied. We will revise the internal validity assessment section to report the proportion of imputed trajectories that violate key logical constraints (such as birth order and date sequencing) and compare this rate directly to the near-zero rate observed in complete cases. This addition will allow readers to evaluate whether joint inconsistencies remain negligible. revision: yes
-
Referee: [Validation approaches] No model equations, convergence diagnostics, fraction of missing information, or quantitative comparison metrics (e.g., standardized differences, overlap statistics) are reported, leaving the central claim of 'good internal and external validity' only partially supported by the described validation approaches. (Validation approaches section.)
Authors: The referee is correct that the manuscript currently provides only a high-level description of the validation approaches without the requested quantitative details. In the revised version we will add the conditional model specifications (including predictor lists and link functions for key variables), convergence diagnostics from the FCS iterations, fraction of missing information values, and quantitative metrics such as standardized mean differences and propensity score overlap statistics for the IPW comparisons. These elements will be placed in the validation approaches section to provide stronger, more transparent support for the validity claims. revision: yes
Circularity Check
Standard FCS imputation procedure is self-contained with no circular reductions
full rationale
The paper applies fully conditional specification to impute missing SHARELIFE life-course variables under the MAR assumption, then validates via direct comparisons to observed cases, IPW adjustments, and external SHARE benchmarks. No equations or steps reduce outputs to fitted inputs by construction, no self-citations carry the central validity claim, and no ansatz or uniqueness theorems are smuggled in. The derivation chain rests on established imputation methods and empirical checks that remain falsifiable against external data.
Axiom & Free-Parameter Ledger
axioms (1)
- domain assumption Missing data are missing at random (MAR) conditional on observed covariates.
Reference graph
Works this paper leans on
-
[1]
Journal of the Royal Statistical Society Series C: Applied Statistics , volume=
Diagnostics for multivariate imputations , author=. Journal of the Royal Statistical Society Series C: Applied Statistics , volume=. 2008 , publisher=
2008
-
[2]
International statistical review , volume=
A review of hot deck imputation for survey non-response , author=. International statistical review , volume=. 2010 , publisher=
2010
-
[3]
1999 , publisher=
Conditional specification of statistical models , author=. 1999 , publisher=
1999
-
[4]
Statistical Science , volume=
Conditionally specified distributions: an introduction (with comments and a rejoinder by the authors) , author=. Statistical Science , volume=. 2001 , publisher=
2001
-
[5]
2021 , publisher=
SHARE Wave 8 Methodology: Collecting cross-national survey data in times of COVID-19 , author=. 2021 , publisher=
2021
-
[6]
2024 , publisher=
SHARE wave 9 methodology: From the SHARE corona survey 2 to the SHARE main wave 9 interview , author=. 2024 , publisher=
2024
-
[7]
International journal of epidemiology , volume=
Data resource profile: the Survey of Health, Ageing and Retirement in Europe (SHARE) , author=. International journal of epidemiology , volume=. 2013 , publisher=
2013
-
[8]
2013 , howpublished =
Brugiavini, Agar and Cavapozzi, Danilo and Pasini, Giacomo and Trevisan, Elisabetta , title =. 2013 , howpublished =
2013
-
[9]
2019 , howpublished=
Combining the retrospective interviews of wave 3 and wave 7: the third release of the SHARE Job Episodes Panel , author=. 2019 , howpublished=
2019
-
[10]
2022 , publisher=
Microeconometrics using stata (second edition) , author=. 2022 , publisher=
2022
-
[11]
Statistical methods in medical research , volume=
Sensitivity analysis after multiple imputation under missing at random: a weighting approach , author=. Statistical methods in medical research , volume=. 2007 , publisher=
2007
-
[12]
Dynamics of the Official Exchange Rates: USD/RUB (code R01235) , year =
-
[13]
Journal of Econometrics , volume=
Regression with imputed covariates: A generalized missing-indicator approach , author=. Journal of Econometrics , volume=. 2011 , publisher=
2011
-
[14]
Journal of Econometrics , volume=
Model averaging estimation of generalized linear models with imputed covariates , author=. Journal of Econometrics , volume=. 2015 , publisher=
2015
-
[15]
and Bergmann, M
Douhou, S. and Bergmann, M. and Pettinicchi, Y. and Otero, M. C. and Bethmann, A. and De Luca, G. and and B\"orsch-Supan, A.\ , title =. 2025 , note =
2025
-
[16]
The Stata Journal , volume=
Diagnostics for multiple imputation in Stata , author=. The Stata Journal , volume=. 2012 , publisher=
2012
-
[17]
Penn World Table---Exchange Rate Series (Assorted Countries) , year =
-
[18]
Journal of the American Statistical Association , volume=
Sampling-based approaches to calculating marginal densities , author=. Journal of the American Statistical Association , volume=. 1990 , publisher=
1990
-
[19]
1995 , publisher=
Bayesian data analysis , author=. 1995 , publisher=
1995
-
[20]
Biometrics , volume=
Multiple imputation for model checking: Completed-data plots with missing and latent data , author=. Biometrics , volume=. 2005 , publisher=
2005
-
[21]
European Journal of Population , volume=
Can we trust older people’s statements on their childhood circumstances? Evidence from SHARELIFE , author=. European Journal of Population , volume=. 2015 , publisher=
2015
-
[22]
2025 , howpublished =
International Monetary Fund , title =. 2025 , howpublished =
2025
-
[23]
Statistical methods in medical research , volume=
Multiple imputation: current perspectives , author=. Statistical methods in medical research , volume=. 2007 , publisher=
2007
-
[24]
American journal of epidemiology , volume=
Multiple imputation for missing data: fully conditional specification versus multivariate normal imputation , author=. American journal of epidemiology , volume=. 2010 , publisher=
2010
-
[25]
Journal of Business & Economic Statistics , volume=
Missing-data adjustments in large surveys , author=. Journal of Business & Economic Statistics , volume=. 1988 , publisher=
1988
-
[26]
Cliometrica , year =
Ljungberg, Jonas , title =. Cliometrica , year =
-
[27]
2011 , note=
A note on how to perform multiple-imputation diagnostics in Stata , author=. 2011 , note=
2011
-
[28]
and Williamson, Samuel H
Officer, Lawrence H. and Williamson, Samuel H. , title =. 2025 , howpublished =
2025
-
[29]
Statistical science , pages=
Multiple-imputation inferences with uncongenial sources of input (with discussion) , author=. Statistical science , pages=. 1994 , publisher=
1994
-
[30]
Statistics in medicine , volume=
Missing values in longitudinal dietary data: a multiple imputation approach based on a fully conditional specification , author=. Statistics in medicine , volume=. 2009 , publisher=
2009
-
[31]
, title =
Officer, Lawrence H. , title =. 2025 , howpublished =
2025
-
[32]
Survey methodology , volume=
A multivariate technique for multiply imputing missing values using a sequence of regression models , author=. Survey methodology , volume=
-
[33]
The Stata Journal , volume=
Multiple imputation of missing values , author=. The Stata Journal , volume=. 2004 , publisher=
2004
-
[34]
The Stata Journal , volume=
Multiple imputation of missing values: update , author=. The Stata Journal , volume=. 2005 , publisher=
2005
-
[35]
The Stata Journal , volume=
Multiple imputation of missing values: update of ice , author=. The Stata Journal , volume=. 2005 , publisher=
2005
-
[36]
The Stata Journal , volume=
Multiple imputation of missing values: further update of ice, with an emphasis on interval censoring , author=. The Stata Journal , volume=. 2007 , publisher=
2007
-
[37]
The Stata Journal , volume=
Multiple imputation of missing values: further update of ice, with an emphasis on categorical variables , author=. The Stata Journal , volume=. 2009 , publisher=
2009
-
[38]
Biometrika , volume=
Inference and missing data , author=. Biometrika , volume=. 1976 , publisher=
1976
-
[39]
Journal of Business & Economic Statistics , volume=
Statistical matching using file concatenation with adjusted weights and multiple imputations , author=. Journal of Business & Economic Statistics , volume=. 1986 , publisher=
1986
-
[40]
1987 , publisher=
Multiple Imputation for Nonresponse in Surveys , author=. 1987 , publisher=
1987
-
[41]
Journal of the American Statistical Association , volume=
Multiple imputation after 18+ years , author=. Journal of the American Statistical Association , volume=. 1996 , publisher=
1996
-
[42]
1997 , publisher=
Analysis of incomplete multivariate data , author=. 1997 , publisher=
1997
-
[43]
Computational statistics & data analysis , volume=
Partially parametric techniques for multiple imputation , author=. Computational statistics & data analysis , volume=. 1996 , publisher=
1996
-
[44]
SHARELIFE Methodology , author=
Retrospective Data Collection in the Survey of Health, Ageing and Retirement in Europe. SHARELIFE Methodology , author=. 2011 , publisher=
2011
-
[45]
Population and Development Review , volume =
Is lowest-low fertility in Europe explained by the postponement of childbearing? , author =. Population and Development Review , volume =. 2004 , publisher =
2004
-
[46]
2011 , howpublished =
Cross-country comparison of monetary values from SHARELIFE , author=. 2011 , howpublished =
2011
-
[47]
Statistical methods in medical research , volume=
Multiple imputation of discrete and continuous data by fully conditional specification , author=. Statistical methods in medical research , volume=. 2007 , publisher=
2007
-
[48]
Statistics in medicine , volume=
Multiple imputation of missing blood pressure covariates in survival analysis , author=. Statistics in medicine , volume=. 1999 , publisher=
1999
-
[49]
Journal of statistical computation and simulation , volume=
Fully conditional specification in multivariate imputation , author=. Journal of statistical computation and simulation , volume=. 2006 , publisher=
2006
-
[50]
The Stata Journal , volume=
Application of multiple imputation using the two-fold fully conditional specification algorithm in longitudinal clinical data , author=. The Stata Journal , volume=. 2014 , publisher=
2014
-
[51]
Computational statistics & data analysis , volume=
Avoiding bias due to perfect prediction in multiple imputation of incomplete categorical variables , author=. Computational statistics & data analysis , volume=. 2010 , publisher=
2010
-
[52]
Statistics in medicine , volume=
Multiple imputation using chained equations: issues and guidance for practice , author=. Statistics in medicine , volume=. 2011 , publisher=
2011
-
[53]
2016 , publisher=
Introductory econometrics a modern approach (sixth edition) , author=. 2016 , publisher=
2016
-
[54]
Statistica Sinica , pages=
Dissecting multiple imputation from a multi-phase inference perspective: what happens when god's, imputer's and analyst's models are uncongenial? (with discussion) , author=. Statistica Sinica , pages=. 2017 , publisher=
2017
discussion (0)
Sign in with ORCID, Apple, or X to comment. Anyone can read and Pith papers without signing in.