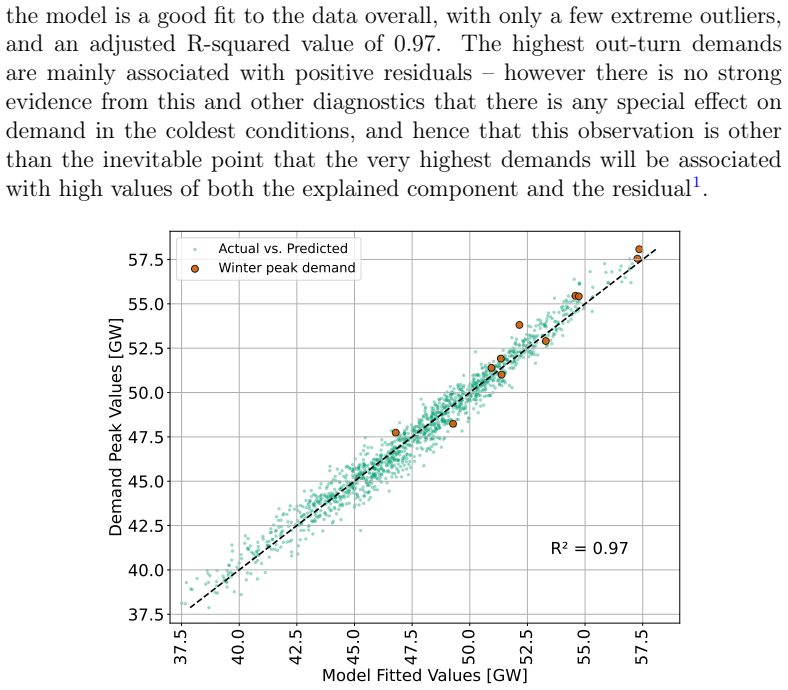
Recognition: unknown
Assessing the Shortfall Risk of GB Electricity Grid using Shifts in Winter Weather Conditions
Pith reviewed 2026-05-09 23:00 UTC · model grok-4.3
The pith
Shifting winter weather data relative to the calendar can make the same year either the most or least severe for Great Britain electricity shortfall risk.
A machine-rendered reading of the paper's core claim, the machinery that carries it, and where it could break.
Core claim
By time-shifting weather series within the peak winter period and adjusting the relevant terms in the statistical demand model, the analysis demonstrates that the security-of-supply consequences of a given weather year vary substantially with calendar alignment. In the Great Britain case, winter 2010-11 can appear as the most severe event in the dataset or as negligible, solely according to whether its weather falls on weekdays, weekends, or holiday periods.
What carries the argument
Time-shifting of weather data within the peak season through adjustment of the statistical demand model terms to reflect calendar effects on demand.
If this is right
- In any electricity system, assessment of a weather year's severity is incomplete without considering day-of-week alignment.
- The need for longer holiday-related shifts depends on whether a major holiday falls inside the peak demand season.
- Winter 2010-11's position in risk rankings changes from most severe to insignificant under different alignments.
- Statistical interpretation of day-of-week shifts is straightforward when all seven alignments are treated as equiprobable.
Where Pith is reading between the lines
- The same shifting technique could be tested on systems without a Christmas holiday to isolate pure day-of-week effects.
- Integration with longer climate projections would show whether the sensitivity to alignment grows as weather-dependent demand increases.
Load-bearing premise
All seven day-of-week alignments are equally likely for statistical purposes, and a realistic maximum length exists for shifting weather relative to Christmas without the shift becoming physically unrealistic.
What would settle it
Direct comparison of the model's predicted demand reduction against measured demand on a documented weekend or holiday period with extreme cold would test the adjustment; systematic mismatch would falsify the shift procedure's accuracy.
Figures


read the original abstract
Extreme weather events during peak winter periods drive resource adequacy risk in Great Britain (GB), with weather sensitivity of the supply-demand balance increasing through additional electric heating and wind generation. This work develops an approach of time-shifting weather within the peak season, through adjustment of the relevant terms in a statistical model for demand. This allows more complete consideration of the security of supply consequences of a weather series, as there will be relevant conditions where demand is suppressed due to weather occurring at a weekend or during the Christmas holiday. Results on a GB example show that consideration of this counterfactual is indeed important, and specifically that winter 2010-11 can either be the most severe in the dataset, or insignificant within the resource adequacy model, depending on the alignment of day-of-week with the weather series. Statistical interpretation of the shift model is discussed, which is straightforward for alignment of day-of-week with weather assuming that all seven alignments are equiprobable; but is more subtle for shifting weather in and out of Christmas, as there is no natural maximum on the realistic length of shift, but too large a shift may be physically unrealistic. It is likely that in all systems, assessment of a weather year's severity is incomplete without such consideration of the day-of-week effect; however, whether longer shifts of weather with respect to date need to be considered will depend on the presence of a major holiday (such as Christmas in GB) in the peak season.
Editorial analysis
A structured set of objections, weighed in public.
Referee Report
Summary. The manuscript develops a method for time-shifting weather series within the GB winter peak season by adjusting terms in a statistical demand model. This generates counterfactuals that account for day-of-week and Christmas holiday effects on demand. Applied to a GB dataset, the approach shows that winter 2010-11 can rank as the most severe year or as insignificant for resource adequacy depending on the day-of-week alignment of the weather data. The paper discusses statistical interpretation under an equiprobability assumption for the seven alignments and notes subtleties for holiday shifts.
Significance. If the modeling choices and assumptions are validated, the work demonstrates that omitting calendar alignments can materially alter severity rankings in weather-driven resource adequacy assessments. This has potential value for systems with high weather sensitivity in demand and supply, as it provides a way to explore a fuller set of plausible demand outcomes from a given weather series without requiring new data.
major comments (2)
- [Abstract] Abstract and discussion of statistical interpretation: the headline finding that 2010-11 severity ranking flips from most severe to insignificant rests on treating the seven day-of-week alignments as equiprobable for statistical purposes. No validation against the empirical joint distribution of weather events and calendar dates in the dataset is provided, nor is sensitivity to non-uniform probabilities reported; if alignments are not equiprobable, the reported change in ranking may not be robust.
- [Abstract] Abstract: the treatment of Christmas shifts states there is 'no natural maximum on the realistic length of shift' but that 'too large a shift may be physically unrealistic,' yet no explicit bound, justification, or sensitivity analysis for plausible shift lengths is given. This assumption is load-bearing for interpreting holiday-related counterfactuals and for the claim that longer shifts may or may not need consideration.
minor comments (1)
- [Abstract] The abstract refers to 'adjustment of the relevant terms in a statistical model for demand' without specifying which terms or providing the model equation; adding this would improve clarity for readers.
Simulated Author's Rebuttal
We thank the referee for their constructive and insightful comments on the manuscript. We address each major comment point by point below, providing honest responses and indicating revisions where the concerns are valid and can be addressed through clarification or additional analysis.
read point-by-point responses
-
Referee: [Abstract] Abstract and discussion of statistical interpretation: the headline finding that 2010-11 severity ranking flips from most severe to insignificant rests on treating the seven day-of-week alignments as equiprobable for statistical purposes. No validation against the empirical joint distribution of weather events and calendar dates in the dataset is provided, nor is sensitivity to non-uniform probabilities reported; if alignments are not equiprobable, the reported change in ranking may not be robust.
Authors: We acknowledge that the statistical interpretation in the abstract and discussion relies on the equiprobability assumption for the seven day-of-week alignments, which is presented as a reasonable baseline given that weather events are not systematically tied to specific weekdays over multi-year periods. However, the manuscript does not provide validation against the empirical joint distribution of weather and calendar dates in the GB dataset, nor does it include sensitivity to non-uniform probabilities. This is a fair observation. In the revised manuscript, we will expand the statistical interpretation section to include a sensitivity analysis. This will explore results under alternative probability distributions (e.g., uniform perturbations around 1/7 or weights informed by historical alignment frequencies where feasible) to demonstrate the robustness of the 2010-11 ranking change. We believe this addition will strengthen the claim without altering the core method. revision: yes
-
Referee: [Abstract] Abstract: the treatment of Christmas shifts states there is 'no natural maximum on the realistic length of shift' but that 'too large a shift may be physically unrealistic,' yet no explicit bound, justification, or sensitivity analysis for plausible shift lengths is given. This assumption is load-bearing for interpreting holiday-related counterfactuals and for the claim that longer shifts may or may not need consideration.
Authors: The abstract notes the inherent subtlety for holiday shifts, where no fixed maximum exists but physical realism constrains large shifts due to seasonal weather stationarity. We agree that the current wording lacks an explicit bound, justification, or sensitivity analysis, which limits interpretability of the holiday counterfactuals. In the revision, we will specify a plausible maximum shift length (e.g., 14-21 days, justified by the typical autocorrelation length of winter temperature series in GB) and add a sensitivity analysis varying this bound to assess effects on demand suppression and shortfall risk rankings. This will provide clearer guidance on when longer shifts warrant consideration, depending on the presence of major holidays in the peak season. revision: yes
Circularity Check
No significant circularity
full rationale
The paper applies time shifts to external observed weather series as counterfactual inputs to a pre-existing statistical demand model; the resulting severity rankings (e.g., 2010-11 most severe or insignificant) are computed outputs from those shifted series rather than quantities defined or fitted by the paper's own equations. The equiprobability assumption for the seven day-of-week alignments is invoked only for post-hoc statistical interpretation of the shifts and does not enter the demand-model equations or force the severity result by construction. No self-citations are load-bearing for the central claim, no ansatz is smuggled, and the derivation remains self-contained against the independent weather data.
Axiom & Free-Parameter Ledger
free parameters (1)
- statistical demand model coefficients
axioms (2)
- domain assumption All seven day-of-week alignments are equiprobable
- domain assumption Shifts of weather with respect to date have a realistic maximum length
Reference graph
Works this paper leans on
-
[1]
Published 17 December 2025
Department for Energy Security and Net Zero and Ofgem, Statutory security of supply report: 2025, Statutory Report HC1464, presented to Parliament pursuant to Section172 of the Energy Act 2004 (as amended). Published 17 December 2025. (2025)
2025
-
[2]
Stephen, S
G. Stephen, S. H. Tindemans, J. Fazio, C. Dent, A. F. Acevedo, B. Bagen, A. Crawford, A. Klaube, D. Logan, D. Burke, Clarifying the Interpretation and Use of the LOLE Resource Adequacy Metric, in: 2022 17th International Conference on Probabilistic Methods Applied to Power Systems (PMAPS), 2022, pp. 1–4
2022
-
[3]
Keane, Andrew and Milligan, Michael and Dent, Chris J. and Hasche, Bernhard and D’Annunzio, Claudine and Dragoon, Ken and Holttinen, Hannele and Samaan, Nader and Soder, Lennart and O’Malley, Mark, Capacity Value of Wind Power, IEEE Transactions on Power Systems 26 (2) (2011) 564–572.doi:10.1109/TPWRS.2010.2062543
-
[4]
D. Stenclik, A. Bloom, W. Cole, G. Stephen, A. F. Acevedo, R. Gram- lich, C. Dent, N. Schlag, M. Milligan, Quantifying Risk in an Uncertain Future: The Evolution of Resource Adequacy, IEEE Power and Energy Magazine 19 (6) (2021) 29–36.doi:10.1109/MPE.2021.3104076
-
[5]
C. J. Dent, N. Sanchez, A. Shevni, J. Q. Smith, A. L. Wilson, X. Yu, Resource adequacy and capacity Procurement: Metrics and decision supportanalysis, ProceedingsoftheInstitutionofMechanicalEngineers, Part A 239 (1) (2025) 199–209.doi:10.1177/09576509241292100
-
[6]
rep., Energy Systems Integration Group, Reston, VA, a Report of the Redefining Resource Adequacy Task Force (2021)
Energy Systems Integration Group, Redefining Resource Adequacy for Modern Power Systems, Tech. rep., Energy Systems Integration Group, Reston, VA, a Report of the Redefining Resource Adequacy Task Force (2021). URLhttps://www.esig.energy/reports-briefs
2021
-
[7]
rep., UK Government, London, UK, accessed: 16 March 2026 (2025)
Department for Energy Security and Net Zero, Clean power 2030 action plan: A new era of clean electricity: Main report, Tech. rep., UK Government, London, UK, accessed: 16 March 2026 (2025). URLhttps://www.gov.uk/government/ publications/clean-power-2030-action-plan/ clean-power-2030-action-plan-a-new-era-of-clean-electricity-main-report 26
2030
-
[8]
D. Quiggin, R. Buswell, The implications of heat electrification on na- tional electrical supply-demand balance under published 2050 energy scenarios, Energy 98 (2016) 253–270.doi:10.1016/j.energy.2015. 11.060
-
[9]
C. McGarry, J. Dixon, J. Flower, W. Bukhsh, C. Brand, K. Bell, S. Gal- loway, Electrified heat and transport: Energy demand futures, their impacts on power networks and what it means for system flexibility, Applied Energy 360 (2024) 122836.doi:https://doi.org/10.1016/ j.apenergy.2024.122836
-
[10]
M. Peacock, A. Fragaki, B. J. Matuszewski, The impact of heat elec- trification on the seasonal and interannual electricity demand of Great Britain, Applied Energy 337 (2023) 120885.doi:https://doi.org/10. 1016/j.apenergy.2023.120885
-
[11]
S. Eggimann, W. Usher, N. Eyre, J. Hall, How weather affects energy demand variability in the transition towards sustainable heating, Energy (2020).doi:10.1016/j.energy.2020.116947
-
[12]
L. J. Lücke, C. J. Dent, G. C. Hegerl, A. L. Wilson, A. P. Schurer, Severe compound events of low wind and cold temperature for the British power system, Meteorological Applications 31 (4) (2024) e2219.doi:10.1002/ met.2219
2024
-
[13]
Clements, A
A. Clements, A. Hurn, Z. Li, Forecasting day-ahead electricity load us- ing a multiple equation time series approach, European Journal of Op- erational Research 251 (2) (2016) 522–530.doi:https://doi.org/10. 1016/j.ejor.2015.12.030
2016
-
[14]
S. Fan, R. J. Hyndman, Short-term load forecasting based on a semi- parametric additive model, IEEE Transactions on Power Systems 27 (1) (2012) 134–141.doi:10.1109/TPWRS.2011.2162082
-
[15]
P. G. Gould, A. B. Koehler, J. K. Ord, R. D. Snyder, R. J. Hyndman, F.Vahid-Araghi, Forecastingtimeserieswithmultipleseasonalpatterns, European Journal of Operational Research 191 (1) (2008) 207–222.doi: https://doi.org/10.1016/j.ejor.2007.08.024
-
[16]
K. G. Boroojeni, M. H. Amini, S. Bahrami, S. S. Iyengar, A. I. Sarwat, O. Karabasoglu, A novel multi-time-scale modeling for electric power 27 demand forecasting: From short-term to medium-term horizon, Electric PowerSystemsResearch142(2017)58–73.doi:10.1016/j.epsr.2016. 08.031
-
[17]
T. Hong, J. Wilson, J. Xie, Long term probabilistic load forecasting and normalization with hourly information, IEEE Transactions on Smart Grid 5 (1) (2014) 456–462.doi:10.1109/TSG.2013.2274373
-
[18]
C.-L. Hor, S. Watson, S. Majithia, Analyzing the impact of weather variables on monthly electricity demand, IEEE Transactions on Power Systems 20 (4) (2005) 2078–2085.doi:10.1109/TPWRS.2005.857397
-
[19]
S. Mirasgedis, Y. Sarafidis, E. Georgopoulou, D. Lalas, M. Moschovits, F. Karagiannis, D. Papakonstantinou, Models for mid-term electric- ity demand forecasting incorporating weather influences, Energy 31 (2) (2006) 208–227.doi:https://doi.org/10.1016/j.energy.2005.02. 016
-
[20]
A. Groß, A. Lenders, F. Schwenker, D. A. Braun, D. Fischer, Com- parison of short-term electrical load forecasting methods for different building types, Energy Informatics 4 (3) (2021) 13.doi:10.1186/ s42162-021-00172-6
2021
-
[21]
M. A. Alduailij, I. Petri, O. Rana, M. A. Alduailij, A. S. Alda- wood, Forecasting peak energy demand for smart buildings, The Journal of Supercomputing 77 (6) (2021) 6356–6380.doi:10.1007/ s11227-020-03540-3
2021
-
[22]
doi:10.1109/TPWRS.2009.2036017
R.J.Hyndman, S.Fan, Densityforecastingforlong-termpeakelectricity demand, IEEE Transactions on Power Systems 25 (2) (2010) 1142–1153. doi:10.1109/TPWRS.2009.2036017
-
[23]
L. B. S. Morais, G. Aquila, V. A. D. de Faria, L. M. M. Lima, J. W. M. Lima, A. R. de Queiroz, Short-term load forecasting us- ing neural networks and global climate models: An application to a large-scale electrical power system, Applied Energy 348 (2023) 121439. doi:https://doi.org/10.1016/j.apenergy.2023.121439
-
[24]
J. Bedi, D. Toshniwal, Deep learning framework to forecast electricity demand, Applied Energy 238 (2019) 1312–1326.doi:https://doi. org/10.1016/j.apenergy.2019.01.113. 28
-
[25]
A. O. Aderibigbe, E. C. Ani, P. E. Ohenhen, N. C. Ohalete, D. O. Daraojimba, Enhancing energy efficiency with AI: a review of machine learning models in electricity demand forecasting, Engineering Science & Technology Journal 4 (6) (2023) 341–356
2023
-
[26]
Y. Liu, J. Li, Annual Electricity and Energy Consumption Forecasting for the UK Based on Back Propagation Neural Network, Multiple Linear Regression, and Least Square Support Vector Machine, Processes 11 (1) (2023).doi:10.3390/pr11010044
-
[27]
S. N. De Silva, B. K. Mishra, W. Sayers, Z. Loukil, Predicting Long- Term Electricity Consumption Using Time Series Data: Use Case of the UK Electricity Data, in: K. Dahal, R. J. V. R., S. K. G. A. E. (Eds.), Intelligent Systems with Applications in Communications, Computing and IoT, Springer Nature Switzerland, Cham, 2026, pp. 37–58
2026
- [28]
-
[29]
J. V. Ringwood, D. Bofelli, F. T. Murray, Forecasting electricity demand on short, medium and long time scales using neural networks, Journal of Intelligent and Robotic Systems 31 (2001) 129–147.doi:10.1023/A: 1012046824237
work page doi:10.1023/a: 2001
-
[30]
H. C. Bloomfield, D. J. Brayshaw, L. C. Shaffrey, P. J. Coker, H. E. Thornton, Quantifying the increasing sensitivity of power systems to cli- mate variability, Environmental Research Letters 11 (12) (2016) 124025. doi:10.1088/1748-9326/11/12/124025
-
[31]
M. Deakin, H. Bloomfield, D. Greenwood, S. Sheehy, S. Walker, P. C. Taylor, Impacts of heat decarbonization on system adequacy considering increased meteorological sensitivity, Applied Energy 298 (2021) 117261. doi:https://doi.org/10.1016/j.apenergy.2021.117261
-
[32]
Wheatcroft, C
E. Wheatcroft, C. Dent, A. L. Wilson, Rescaling of Historic Electricity Demand Series for Forward-Looking Risk Calculations, in: 2022 17th International Conference on Probabilistic Methods Applied to Power Systems (PMAPS), 2022, pp. 1–6. 29
2022
-
[33]
A. L. Wilson, S. Zachary, C. J. Dent, Use of meteorological data for improved estimation of risk in capacity adequacy studies, in: 2018 IEEE International Conference on Probabilistic Methods Applied to Power Systems (PMAPS), 2018, pp. 1–6
2018
-
[34]
H. C. Bloomfield, D. J. Brayshaw, M. Deakin, D. Greenwood, Hourly historical and near-future weather and climate variables for energy sys- tem modelling, Earth System Science Data 14 (6) (2022) 2749–2766. doi:10.5194/essd-14-2749-2022
-
[35]
E. Doxsey-Whitfield, K. MacManus, S. B. Adamo, L. Pistolesi, J. Squires, O. Borkovska, S. R. B. and, Taking Advantage of the Im- proved Availability of Census Data: A First Look at the Gridded Popu- lation of the World, Version 4, Papers in Applied Geography 1 (3) (2015) 226–234.doi:10.1080/23754931.2015.1014272
-
[36]
TheWindPower.net, Wind energy database — TheWindPower.net, https://www.thewindpower.net/, accessed: 2025-10-20 (2025)
2025
-
[37]
National Grid, Home - Connected Data Portal | National Grid, https://connecteddata.nationalgrid.co.uk/, accessed: 2025-10-20 (2025)
2025
-
[38]
N. Sanchez, C. J. Dent, A. L. Wilson, Statistical modelling of depen- dence between net demands and deficits in two area power systems, Sustainable Energy, Grids and Networks 36 (2023) 101151.doi:https: //doi.org/10.1016/j.segan.2023.101151
-
[39]
doi: https://doi.org/10.1016/j.apenergy
M. Pullinger, E. Zapata-Webborn, J. Kilgour, S. Elam, J. Few, N. God- dard, C. Hanmer, E. McKenna, T. Oreszczyn, L. Webb, Capturing variation in daily energy demand profiles over time with cluster anal- ysis in British homes (September 2019 – August 2022), Applied En- ergy 360 (2024) 122683.doi:https://doi.org/10.1016/j.apenergy. 2024.122683. 30
discussion (0)
Sign in with ORCID, Apple, or X to comment. Anyone can read and Pith papers without signing in.