Recognition: unknown
Designing a Visualization Atlas: Lessons & Reflections from The UK Co-Benefits Atlas for Climate Mitigation
Pith reviewed 2026-05-09 23:16 UTC · model grok-4.3
The pith
Five driving forces shape the design of visualization atlases across different stages.
A machine-rendered reading of the paper's core claim, the machinery that carries it, and where it could break.
Core claim
Reflecting on our design process, we identify five driving forces in atlas design -- data, people, stories, context, and the atlas itself -- whose shifting dynamics influence different stages of visualization atlas design in different ways. Grounded in our case study, we discuss using these forces as a conceptual starting point for structuring and reflecting on future atlas design processes.
What carries the argument
The five driving forces framework consisting of data, people, stories, context, and the atlas itself, which interact dynamically to steer design decisions at successive stages.
If this is right
- Atlas designers must expect the relative importance of the five forces to change between early scoping, prototyping, and final refinement.
- The framework helps anticipate stakeholder frictions when users navigate large collections of visualizations.
- Continuous reflection during the process reveals concrete usage scenarios for explanatory and exploratory modes.
- The forces provide a way to structure decisions about how much explanatory text and interactive guidance to include.
- Similar projects can use the same set of forces to organize workshops and onboarding sessions with domain experts.
Where Pith is reading between the lines
- The same five forces may help structure design work for other large-scale data platforms that combine maps, charts, and narrative.
- Design teams could track the forces explicitly in project logs to decide when to add new data layers or revise stories.
- The framework suggests that atlas development benefits from treating the final product itself as an active force rather than a fixed endpoint.
- Future climate atlases might test whether balancing these forces improves how users connect mitigation actions to co-benefits.
Load-bearing premise
Lessons drawn from building one specific climate atlas can serve as a useful starting framework for designing visualization atlases on other topics.
What would settle it
A published account of another visualization atlas project whose design stages show no measurable influence from the shifting balance of data, people, stories, context, and the atlas itself.
Figures


read the original abstract
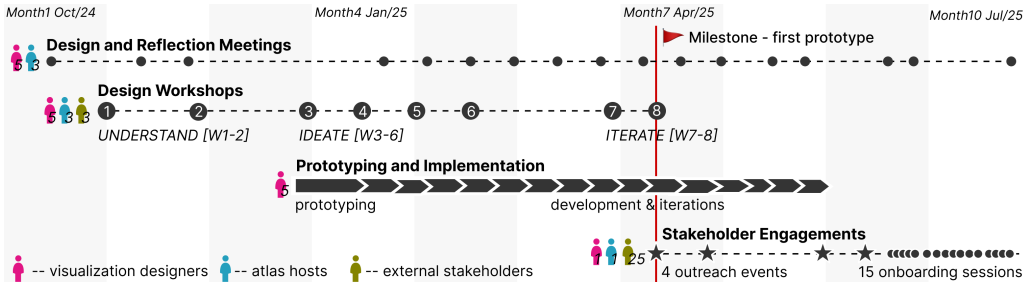
This paper reports on the process of designing the UK Co-Benefits Atlas, which communicates and publicizes data for climate mitigation. Visualization atlases -- an emerging type of platform to make data about complex topics comprehensive through interactive visualizations and explanatory content -- pose challenges beyond traditional visualization projects. Atlases must address diverse and often uncertain audiences and use cases, support both explanatory and guided exploration, and accommodate complex, evolving data. Over 10 months, our team of visualization and domain experts conducted 8 design workshops, iterative prototyping, 15 stakeholder onboarding sessions, and continuous reflection. These intertwined processes informed the development of the Atlas, comprising over 400 pages of visualizations and explanations. They also enabled a deeper understanding of how stakeholders may critically engage with the atlas in practice, in terms of interests, potential frictions when navigating huge amounts of data, and envisioned usage scenarios. Reflecting on our design process, we identify five driving forces in atlas design -- data, people, stories, context, and the atlas itself -- whose shifting dynamics influence different stages of visualization atlas design in different ways. Grounded in our case study, we discuss using these forces as a conceptual starting point for structuring and reflecting on future atlas design processes.
Editorial analysis
A structured set of objections, weighed in public.
Referee Report
Summary. This paper reports on the 10-month design process for the UK Co-Benefits Atlas, a visualization platform communicating climate mitigation data through over 400 pages of interactive visualizations and explanatory content. Drawing on 8 design workshops, iterative prototyping, 15 stakeholder onboarding sessions, and continuous reflection, the authors identify five driving forces—data, people, stories, context, and the atlas itself—whose shifting dynamics shape different stages of atlas design. The five-force framework is presented explicitly as a conceptual starting point for structuring and reflecting on future visualization atlas projects rather than a validated general model.
Significance. If the reflections hold, the paper offers a useful conceptual lens for the HCI and visualization communities on the distinctive challenges of atlas-scale projects, which must accommodate diverse/uncertain audiences, support both explanation and exploration, and manage evolving complex data. The grounding in concrete activities (workshops, prototyping, stakeholder sessions) and the modest framing as a 'starting point' rather than a transferable theory are strengths; the absence of circular derivations or invented parameters further supports its value as a reflective contribution.
minor comments (3)
- [Abstract] Abstract: the description of activities is lengthy and could be condensed to foreground the emergence of the five forces and their claimed influence on design stages.
- [Discussion] The manuscript would benefit from a summary table or diagram in the discussion section that maps the five forces to specific stages or examples from the workshops/prototyping, making the dynamics more concrete and easier to apply as a starting point.
- A brief related-work subsection situating visualization atlases against prior work on data dashboards, narrative visualization, or co-design in HCI would help readers assess novelty.
Simulated Author's Rebuttal
We thank the referee for their positive and constructive assessment of our manuscript, including the recognition of its grounding in concrete design activities and its modest framing as a conceptual starting point. We appreciate the recommendation for minor revision and will incorporate any editorial or formatting suggestions in the revised version.
Circularity Check
No significant circularity in reflective case study
full rationale
The paper is a scoped design-reflection case study that documents workshops, prototyping, and stakeholder sessions for the UK Co-Benefits Atlas and then reflects on that process to identify five driving forces (data, people, stories, context, atlas). These forces are explicitly presented as emerging from the authors' own documented activities and offered only as 'a conceptual starting point' for future reflection, not as a validated model, theorem, or prediction. No equations, parameter fittings, quantitative claims, or self-citations appear in the provided text that would reduce the central claim to its inputs by construction. The argument structure is self-contained as observational reflection grounded in the described process.
Axiom & Free-Parameter Ledger
axioms (1)
- domain assumption Insights from a single extended design case study involving workshops and stakeholder engagement can be generalized as a conceptual starting point for other visualization atlas projects.
Reference graph
Works this paper leans on
-
[1]
F. Amini, N. Henry Riche, B. Lee, C. Hurter, and P. Irani. Understanding data videos: Looking at narrative visualization through the cinematography lens. InProceedings of the 33rd Annual ACM Conference on Human Factors in Computing Systems, CHI ’15, pp. 1459–1468. Association for Computing Machinery, New York, NY , USA, 2015. doi: 10.1145/2702123 .2702431 2
-
[2]
B. Bach, E. Freeman, A. Abdul-Rahman, C. Turkay, S. Khan, Y . Fan et al. Dashboard design patterns.IEEE transactions on visualization and computer graphics, 29(1):342–352, 2022. doi: 10.1109/TVCG.2022. 3209448 1, 2, 8
-
[3]
Braun and V
V . Braun and V . Clarke. Using thematic analysis in psychology. Qualitative research in psychology, 3(2):77–101, 2006. doi: 10.1191/ 1478088706qp063oa 6
2006
-
[4]
: A multi-level typology of abstract visualization tasks
M. Brehmer and T. Munzner. A multi-level typology of abstract visual- ization tasks.IEEE transactions on visualization and computer graphics, 19(12):2376–2385, 2013. doi: 10.1109/TVCG.2013.124 2
-
[5]
N. T. T. Dinh, J. Tran, and M. Hensher. Measuring and valuing the health co-benefits of climate change mitigation: a scoping review.The Lancet Planetary Health, 8(6):e402–e409, 2024. doi: 10.1016/S2542-5196(24) 00095-0 2
-
[6]
Edelsbrunner, J
V . Edelsbrunner, J. Wang, A. Pister, T. Vancisin, S. Phillips, M. Chen et al. Visualization badges: Communicating design and provenance through graphical labels alongside visualizations.IEEE Transactions on Visualiza- tion and Computer Graphics, 2026. doi: hal-05199752 4
2026
-
[7]
S. C. S. for Climate Action and Energy. Scotland’s climate change plan – 2026-2040, 2025. 9
2026
-
[8]
S. Goodwin, T. Saunders, J. Aitken, P. Baade, U. Chandrasiri, D. Cook et al. Designing the australian cancer atlas: visualizing geostatistical model uncertainty for multiple audiences.Journal of the American Medical Informatics Association, 31(11):2447–2454, 2024. doi: 10.1093/jamia/ ocae212 1, 2
-
[9]
K. W. Hall, A. J. Bradley, U. Hinrichs, S. Huron, J. Wood, C. Collins et al. Design by Immersion: A Transdisciplinary Approach to Problem- Driven Visualizations.IEEE Transactions on Visualization and Computer Graphics, 26(1):109–118, Jan. 2020. doi: 10.1109/tvcg.2019.2934790 2
-
[10]
S. Hao, Z. Wang, B. Bach, and L. Pschetz. Design patterns for data- driven news articles. InProceedings of the 2024 CHI Conference on Human Factors in Computing Systems, CHI ’24, art. no. 231, 16 pages. Association for Computing Machinery, New York, NY , USA, 2024. doi: 10.1145/3613904.3641916 1, 2
-
[11]
W. Hart, D. Albarracín, A. H. Eagly, I. Brechan, M. J. Lindberg, and L. Merrill. Feeling validated versus being correct: a meta-analysis of selective exposure to information.Psychological bulletin, 135(4):555,
-
[12]
doi: 10.1037/a0015701 9
-
[13]
U. Hinrichs, S. Forlini, and B. Moynihan. In defense of sandcastles: Research thinking through visualization in digital humanities.Digital Scholarship in the Humanities, 34:i80–i99, Dec. 2019. doi: 10.1093/llc/ fqy051 1, 9
-
[14]
Iturbide, J
M. Iturbide, J. Fernández, J. M. Gutiérrez, A. Pirani, D. Huard, A. Al Khourdajie et al. Implementation of fair principles in the ipcc: the wgi ar6 atlas repository.Scientific Data, 9(1):629, 2022. doi: 10. 1038/s41597-022-01739-y 1, 2
2022
-
[15]
Climate Policy17(sup1), 111–130 (2017) https://doi.org/10.1080/14693062
M. Karlsson, E. Alfredsson, and N. Westling. Climate policy co-benefits: a review.Climate Policy, 20(3):292–316, 2020. doi: 10.1080/14693062. 2020.1724070 2
-
[16]
E. Kerzner, S. Goodwin, J. Dykes, S. Jones, and M. Meyer. A Framework for Creative Visualization-Opportunities Workshops.IEEE Transactions on Visualization and Computer Graphics, 25(1):748–758, Jan. 2019. doi: 10.1109/TVCG.2018.2865241 2, 4, 8
-
[17]
Z. Kunda. The case for motivated reasoning.Psychological bulletin, 108(3):480, 1990. doi: 10.1037/0033-2909.108.3.480 9
-
[18]
B. Latour. Visualization and cognition: Thinking with eyes and hands. Knowledge and Society: Studies in the Sociology of Culture Past and Present, 6:1–40, 1986. 9
1986
-
[19]
B. Lee, N. H. Riche, P. Isenberg, and S. Carpendale. More than telling a story: Transforming data into visually shared stories.IEEE computer graphics and applications, 35(5):84–90, 2015. doi: 10.1109/MCG.2015. 99 1
-
[20]
Levin, B
K. Levin, B. Cashore, S. Bernstein, and G. Auld. Overcoming the tragedy of super wicked problems: constraining our future selves to ameliorate global climate change.Policy sciences, 45(2):123–152, 2012. doi: 10. 1007/s11077-012-9151-0 2
2012
-
[21]
C. G. Lord, L. Ross, and M. R. Lepper. Biased assimilation and attitude polarization: The effects of prior theories on subsequently considered evidence.Journal of personality and social psychology, 37(11):2098,
2098
-
[22]
doi: 10.1037/0022-3514.37.11.2098 9
-
[23]
T. Luciani, A. Burks, C. Sugiyama, J. Komperda, and G. E. Marai. Details- first, show context, overview last: supporting exploration of viscous fingers in large-scale ensemble simulations.IEEE transactions on visualization and computer graphics, 25(1):1225–1235, 2018. doi: 10.1109/TVCG. 2018.2864849 6
-
[24]
N. McCurdy, J. Dykes, and M. Meyer. Action Design Research and Visualization Design. InProceedings of the Sixth Workshop on Beyond Time and Errors on Novel Evaluation Methods for Visualization, pp. 10–18. ACM, Baltimore MD USA, Oct. 2016. doi: 10.1145/2993901.2993916 2
-
[25]
S. McKenna, D. Mazur, J. Agutter, and M. Meyer. Design Activity Framework for Visualization Design.IEEE Transactions on Visualization and Computer Graphics, 20(12):2191–2200, Dec. 2014. doi: 10.1109/ TVCG.2014.2346331 2, 8
-
[26]
Meyer and J
M. Meyer and J. Dykes. Criteria for Rigor in Visualization Design Study. IEEE Transactions on Visualization and Computer Graphics, pp. 1–1,
-
[27]
doi: 10.1109/TVCG.2019.2934539 2
-
[28]
T. Munzner. A Nested Model for Visualization Design and Validation. IEEE Transactions on Visualization and Computer Graphics, 15(6):921– 928, Nov. 2009. doi: 10.1109/TVCG.2009.111 1, 2, 8
-
[29]
R. S. Nickerson. Confirmation bias: A ubiquitous phenomenon in many guises.Review of general psychology, 2(2):175–220, 1998. doi: 10.1037/ 1089-2680.2.2.175 9
1998
-
[30]
M. Oppermann and T. Munzner. Data-first visualization design stud- ies. In2020 IEEE Workshop on Evaluation and Beyond-Methodological Approaches to Visualization (BELIV), pp. 74–80. IEEE, 2020. doi: 10. 1109/beliv51497.2020.00016 1, 2
-
[31]
M. Oppermann, T. Möller, and M. Sedlmair. Bike Sharing Atlas: Visual Analysis of Bike-Sharing Networks.International Journal of Transporta- tion, 6(1):1–14, Apr. 2018. doi: 10.14257/ijt.2018.6.1.01 1
- [32]
-
[33]
A. F. Pirlea, U. Serajuddin, D. Wadhwa, and M. Welch. Atlas of sustainable development goals 2023, 2023. License: Creative Commons Attribution CC BY 3.0 IGO. 1, 2, 9
2023
-
[34]
J. Pruitt and J. Grudin. Personas: practice and theory. InProceedings of the 2003 conference on Designing for user experiences, pp. 1–15, 2003. doi: 10.1145/997078.997089 8
-
[35]
N. H. Riche, C. Hurter, N. Diakopoulos, and S. Carpendale.Data-driven storytelling. CRC Press, 2018. doi: 10.1201/9781315281575 6
-
[36]
H. W. Rittel and M. M. Webber. Dilemmas in a general theory of planning. Policy sciences, 4(2):155–169, 1973. doi: 10.1007/BF01405730 2
- [37]
-
[38]
E. B.-N. Sanders and P. J. Stappers. Co-creation and the new landscapes of design.Co-design, 4(1):5–18, 2008. doi: 10.1080/15710880701875068 2, 8
-
[39]
Scotland’s climate change plan 2026–2040
Scottish Government. Scotland’s climate change plan 2026–2040. https://www.gov.scot/publications/ scotlands-climate-change-plan-2026-2040, 2025. 6, 8
2026
-
[40]
Sedlmair, M
M. Sedlmair, M. Meyer, and T. Munzner. Design study methodology: Reflections from the trenches and the stacks.IEEE transactions on vi- sualization and computer graphics, 18(12):2431–2440, 2012. doi: 10. 1109/TVCG.2012.213 1, 2, 8
2012
-
[41]
A. Sudmant, D. Boyle, R. Higgins-Lavery, A. Gouldson, A. Boyle, J. Fulker et al. Climate policy as social policy? a comprehensive as- sessment of the economic impact of climate action in the uk.Journal of Environmental Studies and Sciences, pp. 1–15, 2024. doi: 10.1007/s13412 -024-00955-9 1, 2, 3
-
[42]
The atlas of economic complexity
The Growth Lab at Harvard University. The atlas of economic complexity. http://www.atlas.cid.harvard.edu. Last accessed: 2024-03-13. 1, 2
2024
-
[43]
Rare diseases observatory, 2024
The Jožef Stefan Institute. Rare diseases observatory, 2024. https: //rarediseases.ijs.si/index. Last accessed: 2024-03-31. 9
2024
-
[44]
N. Tuzcu, A. White, B. Leonard, and S. Geofrey. Unraveling the com- plexity: A user-centered design process for narrative visualization. In Extended Abstracts of the 2023 CHI Conference on Human Factors in Computing Systems, CHI EA ’23, art. no. 403, 7 pages. Association for Computing Machinery, New York, NY , USA, 2023. doi: 10.1145/3544549 .3573866 1
-
[45]
In Proceedings of the SIGCHI Conference on Human Factors in Computing Systems (CHI ’13)
J. Vines, R. Clarke, P. Wright, J. McCarthy, and P. Olivier. Configuring participation: on how we involve people in design. InProceedings of the SIGCHI Conference on Human Factors in Computing Systems, pp. 429–438. ACM, Paris France, Apr. 2013. doi: 10.1145/2470654.2470716 1
-
[46]
J. Walny, C. Frisson, M. West, D. Kosminsky, S. Knudsen, S. Carpendale et al. Data Changes Everything: Challenges and Opportunities in Data Visualization Design Handoff.IEEE Transactions on Visualization and Computer Graphics, 26(1):12–22, Jan. 2020. doi: 10.1109/TVCG.2019. 2934538 1, 2, 8
-
[47]
J. Wang, X. Shu, B. Bach, and U. Hinrichs. Visualization Atlases: Ex- plaining and Exploring Complex Topics Through Data, Visualization, and Narration.IEEE Transactions on Visualization and Computer Graphics, 31(1):437–447, Jan. 2025. doi: 10.1109/tvcg.2024.3456311 1, 2, 3, 4, 7, 8, 9
- [48]
-
[49]
In: Proceedings of the 2018 CHI Conference on Human Factors in Computing Systems
E. Zgraggen, Z. Zhao, R. Zeleznik, and T. Kraska. Investigating the effect of the multiple comparisons problem in visual analysis. InProceedings of the 2018 CHI Conference on Human Factors in Computing Systems, CHI ’18, pp. 1–12. Association for Computing Machinery, New York, NY , USA, 2018. doi: 10.1145/3173574.3174053 9 APPENDIX OF Designing a Visualiza...
discussion (0)
Sign in with ORCID, Apple, or X to comment. Anyone can read and Pith papers without signing in.