Recognition: unknown
Flexible Bayesian Models for Time-Varying Income Distributions
Pith reviewed 2026-05-08 13:12 UTC · model grok-4.3
The pith
Bayesian models with random-walk dynamics on income parameters deliver coherent and more precise inference for time-varying distributions, inequality, and dominance.
A machine-rendered reading of the paper's core claim, the machinery that carries it, and where it could break.
Core claim
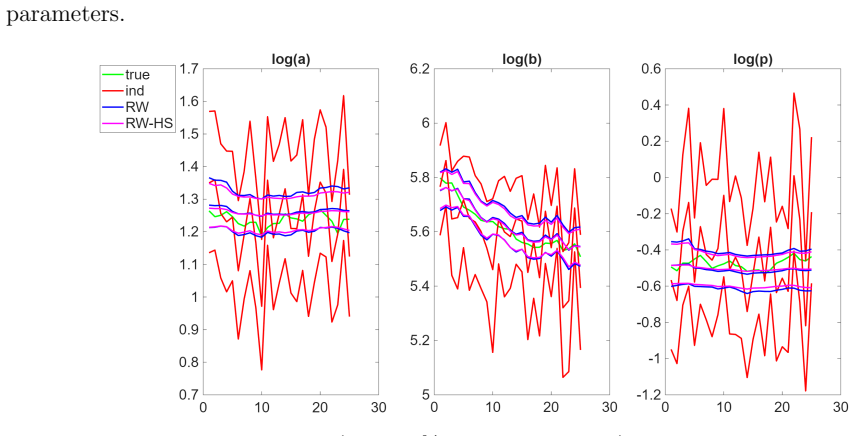
Flexible Bayesian models in which the parameters of the income distribution follow a random walk (or random walk plus shrinkage) across time periods enable coherent posterior inference for the evolving income distributions and associated welfare measures, with gains in precision and stability over independent annual estimation.
What carries the argument
Bayesian model with random-walk dynamics on the parameters of the income distribution (optionally augmented with shrinkage priors).
If this is right
- Joint posterior distributions are obtained for the entire time path of income distributions and derived quantities.
- Estimates for subgroups with small samples become more precise through temporal borrowing of strength.
- Posterior probabilities of distributional dominance exhibit less spurious year-to-year variation.
- More reliable tracking of changes in inequality and poverty over time is possible.
Where Pith is reading between the lines
- Extending the model to include time-varying covariates could link distribution changes to economic factors.
- The approach may improve analysis of other repeated cross-sectional surveys where sample sizes limit precision per period.
- Policy conclusions based on independent yearly estimates of inequality trends may be less stable than previously thought.
Load-bearing premise
The true evolution of the income distribution parameters is well approximated by a random walk process, and any misspecification does not systematically affect the posterior probabilities of dominance.
What would settle it
A simulation study where the true parameter path follows a linear trend or other non-random-walk process, and the dynamic model's dominance probabilities are compared to the known truth.
Figures


read the original abstract
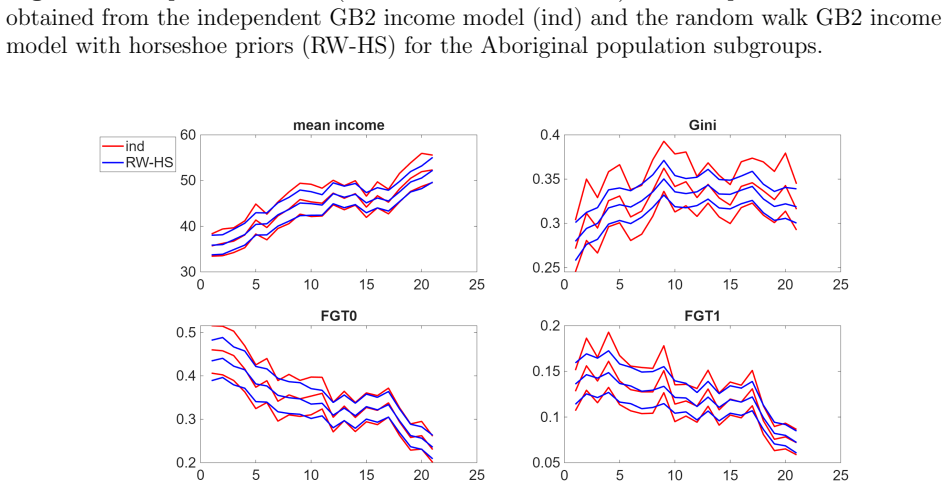
Survey data are widely used to study how income inequality, poverty, and welfare evolve over time. A common practice is to estimate the income distribution separately for each year, treating annual observations as independent cross-sections. For population subgroups with relatively small sample sizes, however, this approach can produce unstable parameter estimates, imprecise inference for inequality and poverty measures, and potentially misleading posterior probabilities of Lorenz and stochastic dominance. This paper develops flexible Bayesian models for time-varying income distributions that borrow strength across adjacent years by allowing the parameters of income distributions to evolve dynamically. We consider a random walk specification and an extended model with shrinkage priors. The proposed framework yields coherent inference for the full income distributions over time, as well as for associated inequality measures, poverty indices, and dominance probabilities. Simulation studies show that, relative to independent year-by-year models, the proposed approach produces substantially more precise and stable inference, while avoiding spurious variation in welfare comparisons. An application to the Aboriginal and residents of the Australian Capital Territory (ACT) population subgroups in the Household, Income and Labour Dynamics in Australia survey shows that the dynamic models deliver improved inference for income distributions and related welfare measures, and can change conclusions about distributional dominance over time.
Editorial analysis
A structured set of objections, weighed in public.
Referee Report
Summary. The paper develops flexible Bayesian models for time-varying income distributions in which the parameters of the income distribution (e.g., for log-normal or other parametric families) follow a random walk or a random walk augmented with shrinkage priors. This allows borrowing of strength across adjacent years rather than treating each cross-section independently. The framework is used to obtain joint posterior inference on the full distributions, inequality and poverty functionals, and probabilities of Lorenz and first-order stochastic dominance. Simulation studies compare the dynamic models against independent year-by-year estimation, and an application to Aboriginal and ACT subgroups in the HILDA survey illustrates changes in dominance conclusions.
Significance. If the random-walk (or shrinkage) specification adequately approximates the true time path of the income-distribution parameters, the approach supplies a coherent Bayesian method for stabilizing inference on welfare measures in small-sample subgroups, a common practical problem in applied distributional analysis. The simulation evidence of precision gains and reduced spurious variation, together with the joint treatment of dominance probabilities, represents a concrete methodological contribution that could be adopted in empirical work on inequality dynamics.
major comments (2)
- [§4 (Simulation Studies)] §4 (Simulation Studies): The Monte Carlo design generates data exclusively from the random-walk or shrinkage data-generating processes that match the proposed priors. While this correctly shows precision improvements relative to independent estimation, it provides no evidence on performance under misspecification (jumps, regime shifts, or non-smooth evolution). Because the central claim is that the dynamic models avoid spurious variation in welfare comparisons without introducing bias, the absence of such robustness checks is load-bearing for the reported simulation conclusions.
- [§5 (Application)] §5 (Application): The paper reports that the dynamic models alter some posterior probabilities of Lorenz and stochastic dominance relative to the independent-year benchmark. Without supplementary diagnostics—such as sensitivity to the shrinkage hyperprior, comparison with alternative smoothers, or direct inspection of the implied smoothing on the Lorenz curves—it is impossible to determine whether these changes arise from genuine data features or from prior-induced temporal averaging. This directly affects the interpretability of the empirical results.
minor comments (2)
- [Notation and Model Section] The notation for the income-distribution parameters and the associated inequality functionals is introduced piecemeal; a single table collecting all symbols and their definitions would improve readability.
- [Figures] Figures displaying time paths of posterior means or dominance probabilities should include the corresponding independent-year credible intervals for direct visual comparison of precision gains.
Simulated Author's Rebuttal
We thank the referee for the detailed and constructive comments on our manuscript. We address each of the major comments below, indicating the revisions we plan to make to strengthen the paper.
read point-by-point responses
-
Referee: [§4 (Simulation Studies)] §4 (Simulation Studies): The Monte Carlo design generates data exclusively from the random-walk or shrinkage data-generating processes that match the proposed priors. While this correctly shows precision improvements relative to independent estimation, it provides no evidence on performance under misspecification (jumps, regime shifts, or non-smooth evolution). Because the central claim is that the dynamic models avoid spurious variation in welfare comparisons without introducing bias, the absence of such robustness checks is load-bearing for the reported simulation conclusions.
Authors: We agree with the referee that robustness checks under misspecification are important for validating the central claims. The current simulation design focuses on the case where the data-generating process aligns with the model assumptions to isolate the benefits of borrowing strength across time. However, to address this concern, we will expand the simulation studies in the revised manuscript to include scenarios with abrupt jumps, regime shifts, and non-smooth parameter evolution. This will provide evidence on how the dynamic models perform when the random walk or shrinkage assumptions are violated, and whether they still offer advantages over independent estimation without introducing substantial bias. revision: yes
-
Referee: [§5 (Application)] §5 (Application): The paper reports that the dynamic models alter some posterior probabilities of Lorenz and stochastic dominance relative to the independent-year benchmark. Without supplementary diagnostics—such as sensitivity to the shrinkage hyperprior, comparison with alternative smoothers, or direct inspection of the implied smoothing on the Lorenz curves—it is impossible to determine whether these changes arise from genuine data features or from prior-induced temporal averaging. This directly affects the interpretability of the empirical results.
Authors: We appreciate this point and acknowledge that additional diagnostics would enhance the interpretability of the application results. In the revised version, we will include sensitivity analyses varying the shrinkage hyperprior parameters, comparisons with alternative smoothing approaches such as kernel-based or spline methods, and additional figures illustrating the impact of the dynamic modeling on the estimated Lorenz curves over time. These additions should help clarify whether the changes in dominance probabilities reflect underlying data patterns or the effect of temporal smoothing. revision: yes
Circularity Check
No circularity: dynamic prior and simulations are independent of target welfare measures
full rationale
The paper defines its random-walk and shrinkage priors on income-distribution parameters as a modeling choice separate from the downstream welfare quantities (Lorenz dominance, stochastic dominance, inequality indices). Simulations compare the proposed dynamic model against an independent year-by-year baseline under data generated exactly from the assumed process; the reported precision gains are therefore a direct consequence of the prior structure rather than a tautological re-expression of fitted inputs. No load-bearing step reduces by construction to a self-citation, an ansatz smuggled via prior work, or a fitted parameter renamed as a prediction. The derivation chain remains self-contained against external benchmarks.
Axiom & Free-Parameter Ledger
Reference graph
Works this paper leans on
-
[1]
B., and Turley, R
Bandourian, R., McDonald, J. B., and Turley, R. S. (2003). A comparison of parametric models of income distribution across countries and over time. Estad \' stica , 55:135--152
2003
-
[2]
Barrett, G. F. and Donald, S. G. (2003). Consistent tests for stochastic dominance. Econometrica , 71(1):71--104
2003
-
[3]
F., Donald, S
Barrett, G. F., Donald, S. G., and Bhattacharya, D. (2014). Consistent nonparametric tests for L orenz dominance. Journal of Business & Economic Statistics , 32(1):1--13
2014
-
[4]
M., Polson, N
Carvalho, C. M., Polson, N. G., and Scott, J. G. (2010). The horseshoe estimator for sparse signals. Biometrika , 97(2):465--480
2010
-
[5]
Chotikapanich, D. (2008). Modeling Income Distributions and Lorenz Curves . Economic Studies in Inequality, Social Exclusion and Well-Being. Springer, New York, NY
2008
-
[6]
Cowell, F. A. (2011). Measuring Inequality . Oxford University Press, Oxford, third edition
2011
-
[7]
Dagum, C. (1977). A new model of personal income distribution: Specification and estimation. Economie Appliqu \'e e , 30(3):413--437
1977
-
[8]
Foster, J., Greer, J., and Thorbecke, E. (1984). A class of decomposable poverty measures. Econometrica , 52(3):761--766
1984
-
[9]
H., Fan, Y., and Sisson, S
Garthwaite, P. H., Fan, Y., and Sisson, S. A. (2016). Adaptive optimal scaling of M etropolis-- H astings algorithms using the R obbins-- M onro process. Communications in Statistics-Theory and Methods , 45(17):5098--5111
2016
-
[10]
Gastwirth, J. L. (1971). A general definition of the L orenz curve. Econometrica , 39(6):1037--1039
1971
-
[11]
and Raftery, A
Gneiting, T. and Raftery, A. E. (2007). Strictly proper scoring rules, prediction, and estimation. Journal of the American Statistical Association , 102(477):359--378
2007
-
[12]
E., and Chotikapanich, D
Gunawan, D., Griffiths, W. E., and Chotikapanich, D. (2021). Posterior probabilities for L orenz and stochastic dominance of A ustralian income distributions. Economic Record , 97(319):504--524
2021
-
[13]
and Kotz, S
Kleiber, C. and Kotz, S. (2003). Statistical Size Distributions in Economics and Actuarial Sciences . John Wiley & Sons, Hoboken, NJ
2003
-
[14]
Knaus, P. and Fruhwirth-Schnatter, S. (2023). The dynamic triple gamma prior as a shrinkage process prior for time-varying parameter models. arXiv preprint arXiv:2312.10487
-
[15]
R., Matteson, D
Kowal, D. R., Matteson, D. S., and Ruppert, D. (2019). Dynamic shrinkage processes. Journal of the Royal Statistical Society Series B: Statistical Methodology , 81(4):781--804
2019
-
[16]
Lander, D., Gunawan, D., Griffiths, W., and Chotikapanich, D. (2020). Bayesian assessment of L orenz and stochastic dominance. Canadian Journal of Economics/Revue canadienne d' \'e conomique , 53(2):767--799
2020
-
[17]
and Schmidt, D
Makalic, E. and Schmidt, D. F. (2015). A simple sampler for the horseshoe estimator. IEEE Signal Processing Letters , 23(1):179--182
2015
-
[18]
McDonald, J. B. (1984). Some generalized functions for the size distribution of income. Econometrica , 52(3):647--663
1984
-
[19]
McDonald, J. B. and Xu, Y. J. (1995). A generalization of the B eta distribution with applications. Journal of Econometrics , 66(1-2):133--152
1995
-
[20]
A., Schoeni, R
McGonagle, K. A., Schoeni, R. F., Sastry, N., and Freedman, V. A. (2012). The P anel S tudy of I ncome D ynamics: Overview, recent innovations, and potential for life course research. Longitudinal and Life Course Studies , 3(2):188--209
2012
-
[21]
Robert, C. P. and Casella, G. (2004). Monte C arlo S tatistical M ethods . Springer, New York, second edition
2004
-
[22]
and Dugain, V
Sila, U. and Dugain, V. (2019). Income, wealth and earnings inequality in A ustralia: Evidence from the HILDA survey. Working Paper 1538, OECD Economics Department, Paris
2019
-
[23]
Singh, S. K. and Maddala, G. S. (1976). A function for the size distribution of incomes. Econometrica , 44(5):963--970
1976
-
[24]
and Wooden, M
Watson, N. and Wooden, M. (2012). The HILDA survey: A case study in the design and development of a successful household panel survey. Longitudinal and Life Course Studies , 3(3):369--381
2012
discussion (0)
Sign in with ORCID, Apple, or X to comment. Anyone can read and Pith papers without signing in.