Recognition: unknown
Weighted complement graphs of spatial networks with functional connections reveal nodes with high potential for new links
Pith reviewed 2026-05-08 13:38 UTC · model grok-4.3
The pith
Weighted complement graphs identify geographically central but disconnected nodes as having the highest potential for new links in public transport networks.
A machine-rendered reading of the paper's core claim, the machinery that carries it, and where it could break.
Core claim
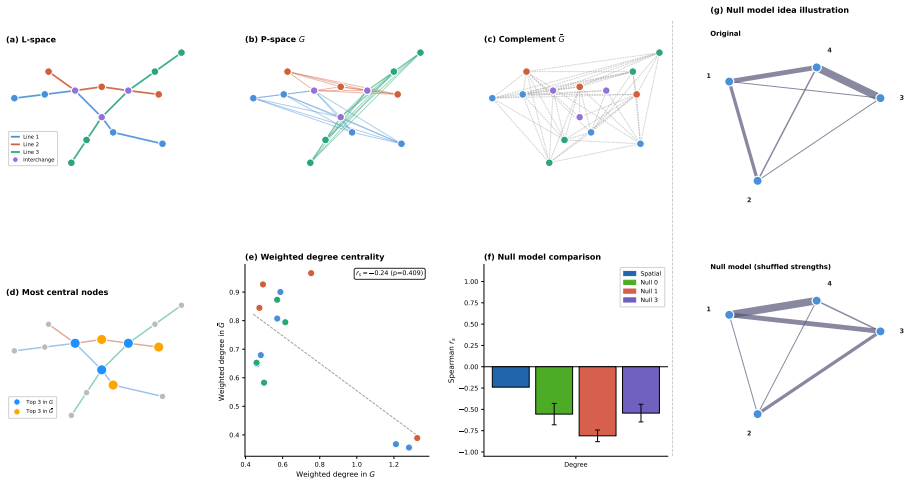
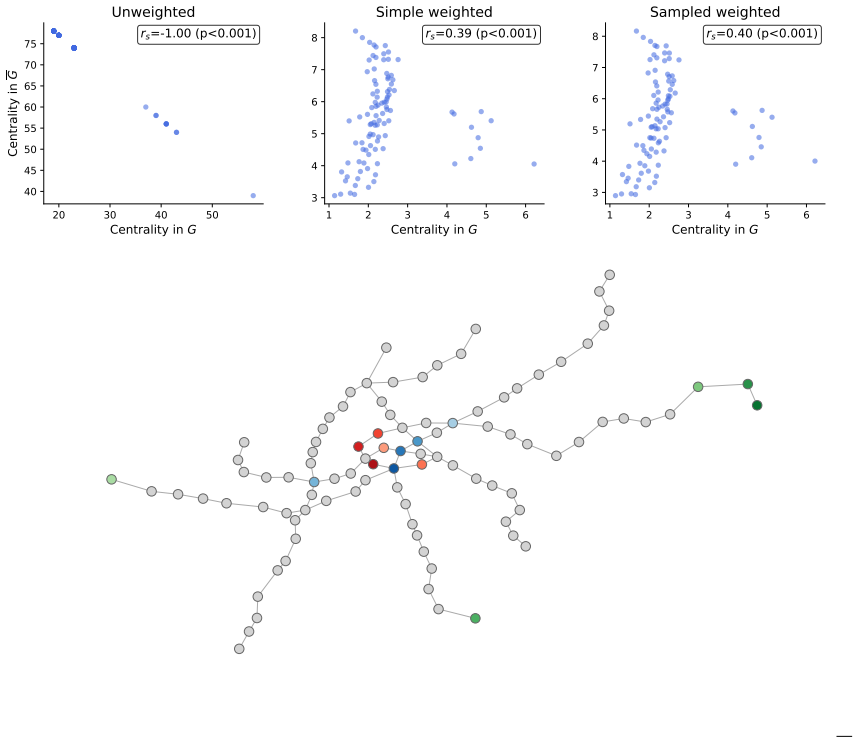
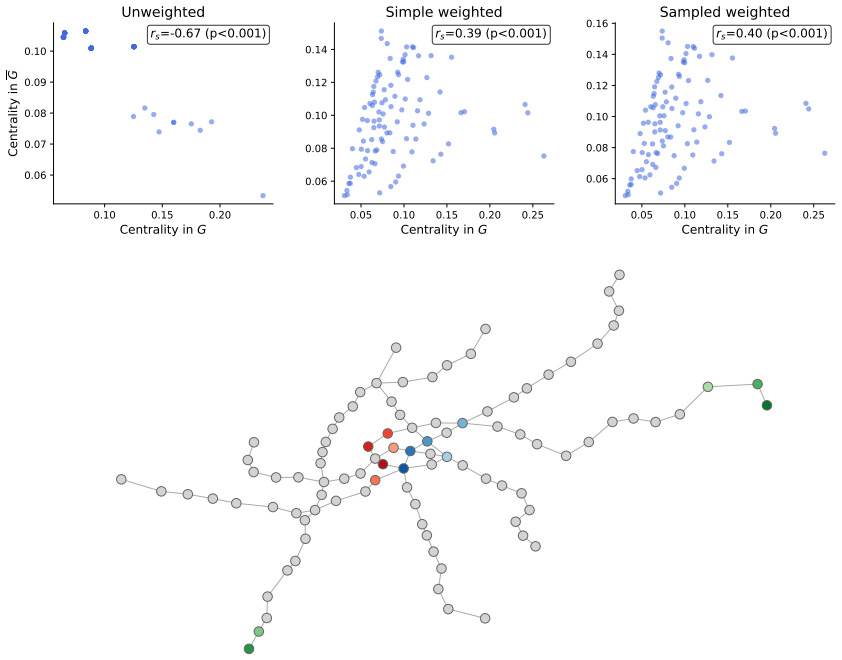
The key finding is that the most central nodes in the weighted complement graph of a public transport network are the geographically central nodes that lack topological connectedness, rather than the least central nodes from the original network, and that this is fundamentally a spatial effect as validated through null model testing on 31 metro systems.
What carries the argument
The weighted complement graph of the operational PTN, constructed by weighting missing edges according to geographical distances combined with network-specific effective velocity and waiting time distributions; this graph quantifies the unrealised connection potential across the network.
If this is right
- Planners can prioritize adding links incident to geographically central but topologically isolated stops to improve overall network performance.
- The approach requires only existing network data on distances, velocities, and waits, making it applicable where demand data is unavailable.
- Null model tests isolate the spatial contribution, showing that random networks without spatial embedding do not exhibit the same central node pattern.
- Centrality in the complement graph provides a direct measure of a node's potential for new links without simulating each possible addition.
Where Pith is reading between the lines
- The same weighted-complement construction could be applied to other spatially embedded networks such as road systems or utility grids to identify high-potential additions.
- Tracking changes in complement centrality as a network grows over time could provide a way to anticipate which nodes will become high-potential targets for future links.
- If velocity or waiting-time distributions shift markedly between peak and off-peak periods, the resulting complement centralities and priority rankings could change accordingly.
Load-bearing premise
Plausible weights for missing edges can be assigned using only geographical distances together with the network's existing distributions of effective velocities and waiting times.
What would settle it
A counterexample would be any metro network in which the nodes of highest centrality in the weighted complement graph are not those in the geographical center with low original connectivity, or in which null models that destroy spatial information still reproduce the same centrality pattern.
Figures


read the original abstract
In this study, we take a systematic look at the unrealised part of public transport networks (PTNs) with functional connections. We consider their complement graphs and study their structure. The complement graph $\bar G$ of an unweighted graph $G$ is a straightforward concept, yielding a graph on the same set of nodes, and an edge exists in $\bar G$ if and only if it is not present in $G$. In contrast, a weighted complement graph cannot be uniquely determined. However, if we consider PTNs with travel times as edge weights, there are physical constraints on the possible weight ranges. We propose a method to construct weighted complement graphs of operational PTN graph representations based on the geographical distances between nodes (representing stops) and assign weights to edges based on distance, combined with network-specific distributions of effective velocities and waiting times. We observe that the most central nodes in the weighted complement graph do not correspond to the least central nodes in the original network but are, remarkably, those in the geographical centre of the network that lack topological connectedness. Testing against null models on a dataset of 31 metro networks worldwide confirms that this is a fundamentally spatial effect.
Editorial analysis
A structured set of objections, weighed in public.
Referee Report
Summary. The manuscript proposes a method to construct weighted complement graphs for public transport networks (PTNs) by assigning weights to missing edges based on Euclidean distances between stops combined with network-specific empirical distributions of effective velocities and waiting times extracted from the observed network. It reports that the nodes of highest centrality in these weighted complement graphs are those in the geographical center of the network that lack topological connectedness in the original graph, rather than the least central nodes by standard measures. Using null-model tests on a dataset of 31 metro networks worldwide, the authors conclude that this pattern reflects a fundamentally spatial effect.
Significance. If the weighting procedure accurately proxies the potential for new functional links, the result identifies a non-trivial spatial signature in PTN structure that standard topological centrality misses. The large empirical dataset and null-model controls are strengths that could make the finding useful for urban planning applications aimed at identifying high-impact locations for network expansion. The approach of constraining complement weights by physical travel-time considerations is a reasonable extension of complement-graph ideas to spatial networks.
major comments (3)
- [Abstract and Methods] Abstract and Methods (weight assignment procedure): the construction applies observed velocity and waiting-time distributions directly to missing edges using only distance, without any demand, land-use, or route-feasibility validation for unrealized links. This assumption is load-bearing for the claim that complement centrality measures 'potential for new links' rather than an artifact of short-distance bias in central areas; the skeptic's concern that this inflates centrality precisely for geographically central nodes therefore requires explicit testing or sensitivity analysis.
- [Abstract] Abstract (null-model tests): the claim that the pattern is 'a fundamentally spatial effect' rests on null models that randomize spatial positions but do not appear to test the realism of the distance-plus-distribution weighting itself. Without details on how the nulls interact with the fitted velocity/waiting-time distributions, or reported p-values, error bars, or robustness checks, it remains unclear whether the result survives alternative weight models.
- [Abstract and Results] Abstract and Results: centrality in the weighted complement is computed from weights derived from the same network's empirical distributions used to define the original graph; this creates a potential circularity in which the 'high potential' nodes are partly defined by the data that built the observed network, undermining the interpretation that the finding reveals new structural insight independent of the modeling choices.
minor comments (2)
- [Abstract] The abstract states the method and conclusion at a high level but supplies no equations for the weight formula or statistical details on the null-model tests; adding a concise methods paragraph or equation in the abstract would improve accessibility.
- [Introduction] Notation for the complement graph (denoted G-bar) and the precise definition of 'functional connections' versus standard edges should be introduced earlier and used consistently to avoid ambiguity when discussing weighted versus unweighted cases.
Simulated Author's Rebuttal
We thank the referee for the detailed and constructive report. We address each of the major comments below, providing clarifications and indicating revisions made to the manuscript.
read point-by-point responses
-
Referee: [Abstract and Methods] Abstract and Methods (weight assignment procedure): the construction applies observed velocity and waiting-time distributions directly to missing edges using only distance, without any demand, land-use, or route-feasibility validation for unrealized links. This assumption is load-bearing for the claim that complement centrality measures 'potential for new links' rather than an artifact of short-distance bias in central areas; the skeptic's concern that this inflates centrality precisely for geographically central nodes therefore requires explicit testing or sensitivity analysis.
Authors: We agree that the weighting procedure is a key assumption and does not incorporate demand or land-use factors, which would require additional data not available in our dataset. Our approach focuses on the structural potential based on spatial distances and network-specific travel parameters to highlight locations where new links could be feasible from a physical perspective. To address the potential short-distance bias concern, we have added a sensitivity analysis in the revised Methods section, testing alternative distributions and confirming that the identification of geographically central nodes as high-potential remains robust. We have also expanded the discussion to note this limitation. revision: partial
-
Referee: [Abstract] Abstract (null-model tests): the claim that the pattern is 'a fundamentally spatial effect' rests on null models that randomize spatial positions but do not appear to test the realism of the distance-plus-distribution weighting itself. Without details on how the nulls interact with the fitted velocity/waiting-time distributions, or reported p-values, error bars, or robustness checks, it remains unclear whether the result survives alternative weight models.
Authors: The null models preserve the topological structure while randomizing node positions, and the weighting is applied consistently using the same empirical distributions fitted to each network. We have revised the manuscript to include explicit details on the null model construction, how the distributions are applied to the randomized networks, and statistical measures such as p-values and error bars from the 31 networks. Additional robustness checks with alternative weighting schemes have been added to the supplementary material. revision: yes
-
Referee: [Abstract and Results] Abstract and Results: centrality in the weighted complement is computed from weights derived from the same network's empirical distributions used to define the original graph; this creates a potential circularity in which the 'high potential' nodes are partly defined by the data that built the observed network, undermining the interpretation that the finding reveals new structural insight independent of the modeling choices.
Authors: We clarify that the empirical distributions are extracted from the observed edges to characterize the typical velocity and waiting times specific to each PTN, and then extrapolated to missing edges based on their Euclidean distances. This is not circular as the original graph's edges use actual measured times, while the complement uses modeled times for potential additions. The insight is that, given the city's observed travel characteristics, certain central but sparsely connected nodes stand out. Nevertheless, to strengthen independence, we have included a new subsection discussing alternative modeling choices and their impact on the results. revision: partial
Circularity Check
No significant circularity; construction is explicit modeling choice with external null-model validation.
full rationale
The paper proposes an explicit method to assign weights to missing edges in the complement graph using Euclidean distances plus empirical distributions of velocities and waiting times extracted from the observed PTN. Centrality is then computed on this constructed graph, and the key observation (geographically central nodes being most central in the complement) is tested for spatial origin via null models across 31 networks. No step reduces a claimed result to its inputs by definition, renames a fitted quantity as a prediction, or relies on a self-citation chain for a uniqueness theorem. The weighting is a transparent modeling assumption whose consequences are checked against randomization baselines rather than being tautological.
Axiom & Free-Parameter Ledger
free parameters (1)
- network-specific velocity and waiting-time distributions
axioms (1)
- domain assumption Physical constraints limit possible travel times between stops to functions of distance, speed, and waiting time.
Reference graph
Works this paper leans on
-
[1]
Spatial networks,
M. Barth´ elemy, “Spatial networks,”Physics reports, vol. 499, no. 1-3, pp. 1–101, 2011
2011
-
[2]
Recognition and vulnerability analysis of key nodes in power grid based on complex network centrality,
B. Liu, Z. Li, X. Chen, Y. Huang, and X. Liu, “Recognition and vulnerability analysis of key nodes in power grid based on complex network centrality,”IEEE Transactions on Circuits and Systems II: Express Briefs, vol. 65, no. 3, pp. 346–350, 2017
2017
-
[3]
Graph vulnerability and robustness: A survey,
S. Freitas, D. Yang, S. Kumar, H. Tong, and D. H. Chau, “Graph vulnerability and robustness: A survey,”IEEE Transactions on Knowledge and Data Engineering, vol. 35, no. 6, pp. 5915–5934, 2022
2022
-
[4]
Robustness assessment of public transport networks in various graph representations: Systematic review, decision support, and case study,
M. Palk, S. Voß, and R. Jovanovic, “Robustness assessment of public transport networks in various graph representations: Systematic review, decision support, and case study,”Networks, 2026
2026
-
[5]
Ranking the spreading influence in complex networks,
J.-G. Liu, Z.-M. Ren, and Q. Guo, “Ranking the spreading influence in complex networks,”Physica A: Statistical Mechanics and its Applications, vol. 392, no. 18, pp. 4154–4159, 2013
2013
-
[6]
Spreading dynamics in complex networks,
S. Pei and H. A. Makse, “Spreading dynamics in complex networks,”Journal of Statistical Mechanics: Theory and Experiment, vol. 2013, no. 12, p. P12002, 2013
2013
-
[7]
Using node centrality and optimal control to maximize information diffusion in social networks,
K. Kandhway and J. Kuri, “Using node centrality and optimal control to maximize information diffusion in social networks,”IEEE Transactions on Systems, Man, and Cybernetics: Systems, vol. 47, no. 7, pp. 1099–1110, 2016
2016
-
[8]
Can passenger flow distribution be estimated solely based on network properties in public transport systems?,
D. Luo, O. Cats, and H. van Lint, “Can passenger flow distribution be estimated solely based on network properties in public transport systems?,”Transportation, vol. 47, no. 6, pp. 2757–2776, 2020
2020
-
[9]
Node importance corresponds to passenger demand in public transport networks,
T. ˇSfiligoj, A. Peperko, P. Bajec, and O. Cats, “Node importance corresponds to passenger demand in public transport networks,”Physica A: Statistical Mechanics and its Applications, vol. 659, p. 130354, 2025
2025
-
[10]
Node centrality in weighted networks: Generalizing degree and shortest paths,
T. Opsahl, F. Agneessens, and J. Skvoretz, “Node centrality in weighted networks: Generalizing degree and shortest paths,”Social networks, vol. 32, no. 3, pp. 245–251, 2010
2010
-
[11]
Consistency and dif- ferences between centrality measures across distinct classes of networks,
S. Oldham, B. Fulcher, L. Parkes, A. Arnatkevicˇ ci¯ ut˙ e, C. Suo, and A. Fornito, “Consistency and dif- ferences between centrality measures across distinct classes of networks,”PloS one, vol. 14, no. 7, p. e0220061, 2019
2019
-
[12]
The effects of spatial constraints on the evolution of weighted complex networks,
A. Barrat, M. Barth´ elemy, and A. Vespignani, “The effects of spatial constraints on the evolution of weighted complex networks,”Journal of Statistical Mechanics: Theory and Experiment, vol. 2005, no. 05, p. P05003, 2005
2005
-
[13]
Shortest paths along urban road network peripheries,
R. C. Batac and M. T. Cirunay, “Shortest paths along urban road network peripheries,”Physica A: Statistical Mechanics and its Applications, vol. 597, p. 127255, 2022
2022
-
[14]
Evolution of the periphery of a self-organized road network,
M. T. Cirunay and R. C. Batac, “Evolution of the periphery of a self-organized road network,”Physica A: Statistical Mechanics and its Applications, vol. 617, p. 128629, 2023
2023
-
[15]
Public transport networks: empirical analysis and modeling,
C. Von Ferber, T. Holovatch, Y. Holovatch, and V. Palchykov, “Public transport networks: empirical analysis and modeling,”The European Physical Journal B, vol. 68, no. 2, pp. 261–275, 2009. 21
2009
-
[16]
Networks containing negative ties,
M. G. Everett and S. P. Borgatti, “Networks containing negative ties,”Social networks, vol. 38, pp. 111– 120, 2014
2014
-
[17]
Transport network design problem under uncertainty: a review and new developments,
A. Chen, Z. Zhou, P. Chootinan, S. Ryu, C. Yang, and S. Wong, “Transport network design problem under uncertainty: a review and new developments,”Transport Reviews, vol. 31, no. 6, pp. 743–768, 2011
2011
-
[18]
Line planning in public transportation: models and methods,
A. Sch¨ obel, “Line planning in public transportation: models and methods,”OR spectrum, vol. 34, no. 3, pp. 491–510, 2012
2012
-
[19]
50 years of operations research in public transport,
O. Cats, K. Gkiotsalitis, and A. Sch¨ obel, “50 years of operations research in public transport,”EURO Journal on Transportation and Logistics, vol. 14, p. 100160, 2025
2025
-
[20]
Origin-destination demand prediction of public transit using graph convolutional neural network,
N. K. Shanthappa, R. H. Mulangi, and H. M. Manjunath, “Origin-destination demand prediction of public transit using graph convolutional neural network,”Case Studies on Transport Policy, vol. 17, p. 101230, 2024
2024
-
[21]
Modeling the public transport networks: A study of their efficiency,
M. L. Mouronte-Lopez, “Modeling the public transport networks: A study of their efficiency,”Com- plexity, vol. 2021, no. 1, p. 3280777, 2021
2021
-
[22]
Efficient behavior of small-world networks,
V. Latora and M. Marchiori, “Efficient behavior of small-world networks,”Physical review letters, vol. 87, no. 19, p. 198701, 2001
2001
-
[23]
Network accessibility as the emergence of cliques,
T. ˇSfiligoj, A. Peperko, and O. Cats, “Network accessibility as the emergence of cliques,”Scientific Reports, 2026
2026
-
[24]
The complexity and robustness of metro networks,
S. Derrible and C. Kennedy, “The complexity and robustness of metro networks,”Physica A: Statistical Mechanics and its Applications, vol. 389, no. 17, pp. 3678–3691, 2010
2010
-
[25]
Metropolitan rail network robustness,
O. Cats and P. Krishnakumari, “Metropolitan rail network robustness,”Physica A: statistical mechanics and its applications, vol. 549, p. 124317, 2020
2020
-
[26]
A curated data set of l-space representations for 51 metro networks worldwide,
S. Vijlbrief, O. Cats, P. Krishnakumari, S. van Cranenburgh, and R. Massobrio, “A curated data set of l-space representations for 51 metro networks worldwide,” 2022
2022
-
[27]
A curated data set of p-space representations for 51 metro networks worldwide,
S. Vijlbrief, O. Cats, P. Krishnakumari, S. van Cranenburgh, and R. Massobrio, “A curated data set of p-space representations for 51 metro networks worldwide,” 2022
2022
-
[28]
Faster greedy optimization of resistance-based graph ro- bustness,
M. Predari, R. Kooij, and H. Meyerhenke, “Faster greedy optimization of resistance-based graph ro- bustness,” in2022 IEEE/ACM International Conference on Advances in Social Networks Analysis and Mining (ASONAM), pp. 1–8, IEEE, 2022
2022
-
[29]
Efficient algorithms for minimizing the kirchhoff index via adding edges,
X. Zhou, A. N. Zehmakan, and Z. Zhang, “Efficient algorithms for minimizing the kirchhoff index via adding edges,”IEEE Transactions on Knowledge and Data Engineering, 2025
2025
-
[30]
Specificity and stability in topology of protein networks,
S. Maslov and K. Sneppen, “Specificity and stability in topology of protein networks,”Science, vol. 296, no. 5569, pp. 910–913, 2002
2002
-
[31]
Constrained randomization of weighted networks,
G. Ansmann and K. Lehnertz, “Constrained randomization of weighted networks,”Physical Review E-Statistical, Nonlinear, and Soft Matter Physics, vol. 84, no. 2, p. 026103, 2011. 22
2011
discussion (0)
Sign in with ORCID, Apple, or X to comment. Anyone can read and Pith papers without signing in.