An RXTE Search for the Sterile Neutrino Decay in Galaxy Clusters
Pith reviewed 2026-05-09 20:30 UTC · model grok-4.3
The pith
A marginal excess at 3.55 keV in RXTE spectra of galaxy clusters may be due to sterile neutrino decay.
A machine-rendered reading of the paper's core claim, the machinery that carries it, and where it could break.
Core claim
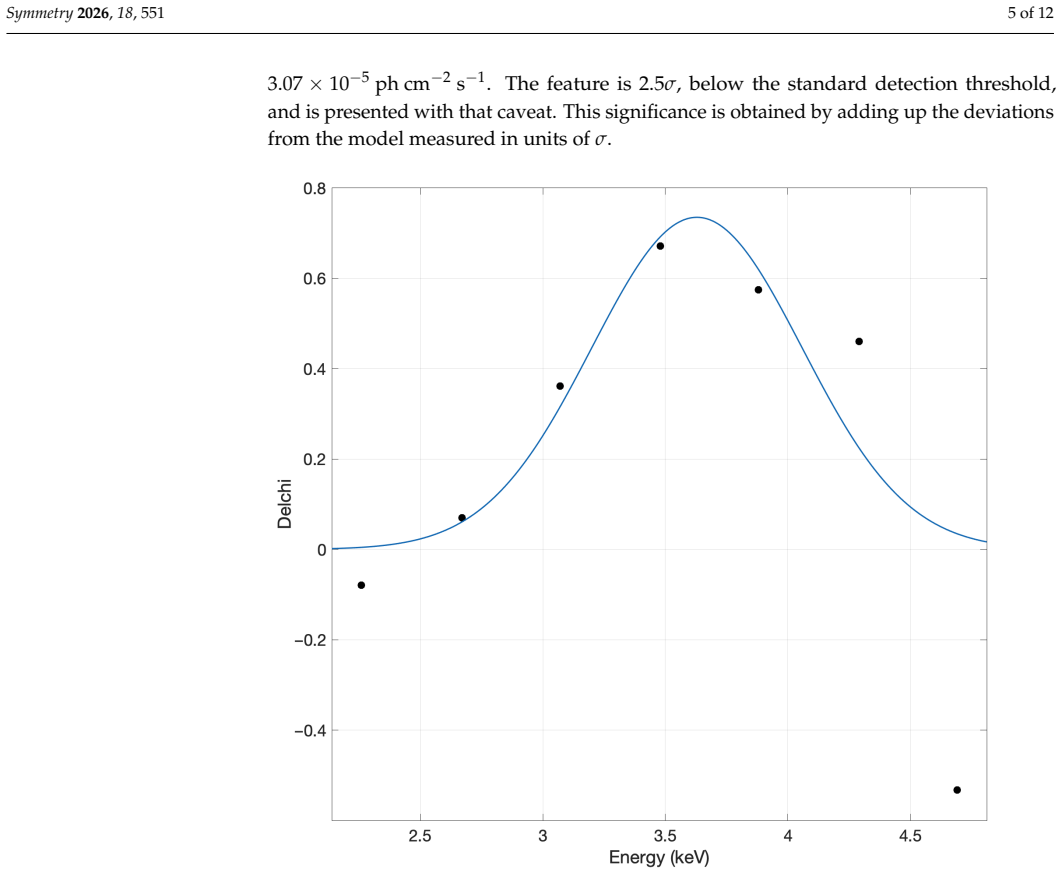
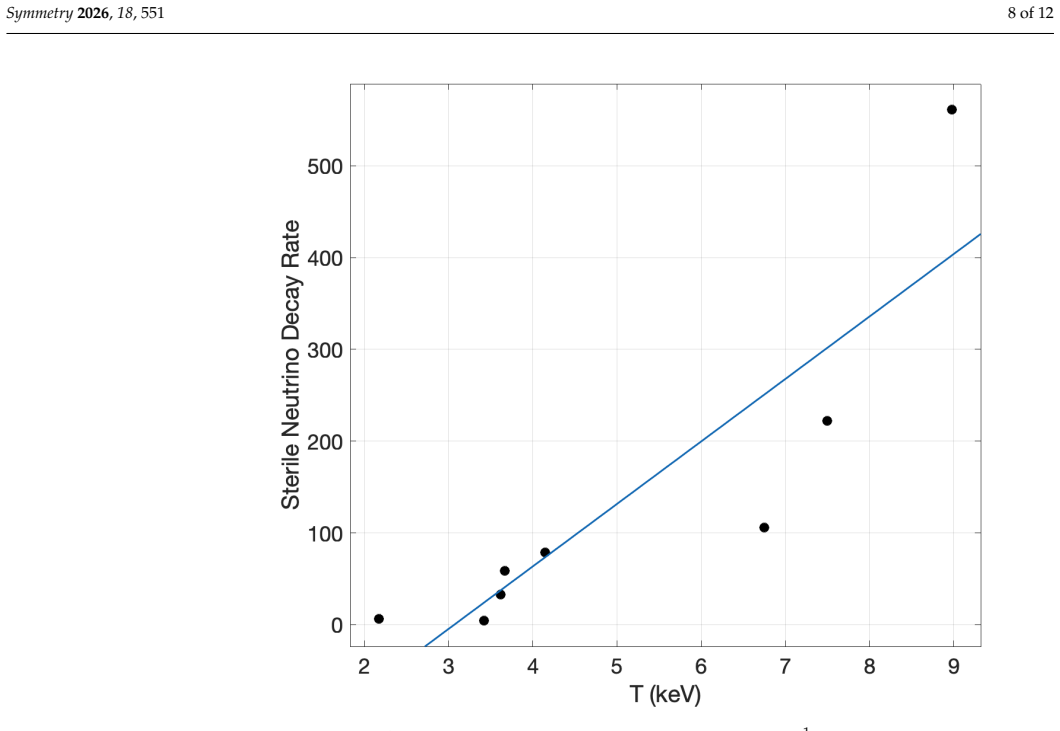
Using 3.1 megaseconds of RXTE data, the analysis identifies a 2.5 sigma excess in the combined spectra of eight clusters. Modeling this with a Gaussian at 3.6 keV gives a flux of 3.07 x 10^{-5} ph cm^{-2} s^{-1}, with mixing angles from 0.35 to 6.2 x 10^{-10}. The decay rate correlates strongly with cluster temperature (r=0.87), and half the flux is from Coma. Fits to Coma show the Gaussian better accounts for soft residuals than an extra thermal component. The fluxes do not overproduce dark matter, so some fraction of the excess could be the decay line.
What carries the argument
The Gaussian profile fitted to the combined residual spectrum to represent the sterile neutrino decay line, after subtracting thermal models from RXTE PCA data.
If this is right
- The decay line flux is strongly correlated with cluster temperature due to hotter clusters having more dark matter.
- About half of the total decay line flux originates from the Coma cluster.
- The derived mixing angles range between 0.35 and 6.2 times 10 to the -10.
- The line fluxes are consistent with not overproducing the observed dark matter density.
- Low-temperature thermal emission and systematics do not fully account for the excess, leaving room for the decay contribution.
Where Pith is reading between the lines
- If the line is real, it would indicate sterile neutrinos as a viable dark matter candidate with specific mixing parameters.
- Future observations with better energy resolution could separate the narrow decay line from broader thermal features.
- The temperature correlation provides a way to test the dark matter origin in other cluster samples.
- Similar searches in other X-ray datasets could confirm or refute this marginal detection.
Load-bearing premise
The observed excess around 3.55 keV cannot be completely explained by low-temperature thermal emission or instrumental systematics.
What would settle it
A high-resolution X-ray spectrum of the Coma cluster or the combined sample that fully accounts for all residuals in the 3-4 keV band using only known thermal plasmas and instrument responses, without any additional line component.
Figures

read the original abstract
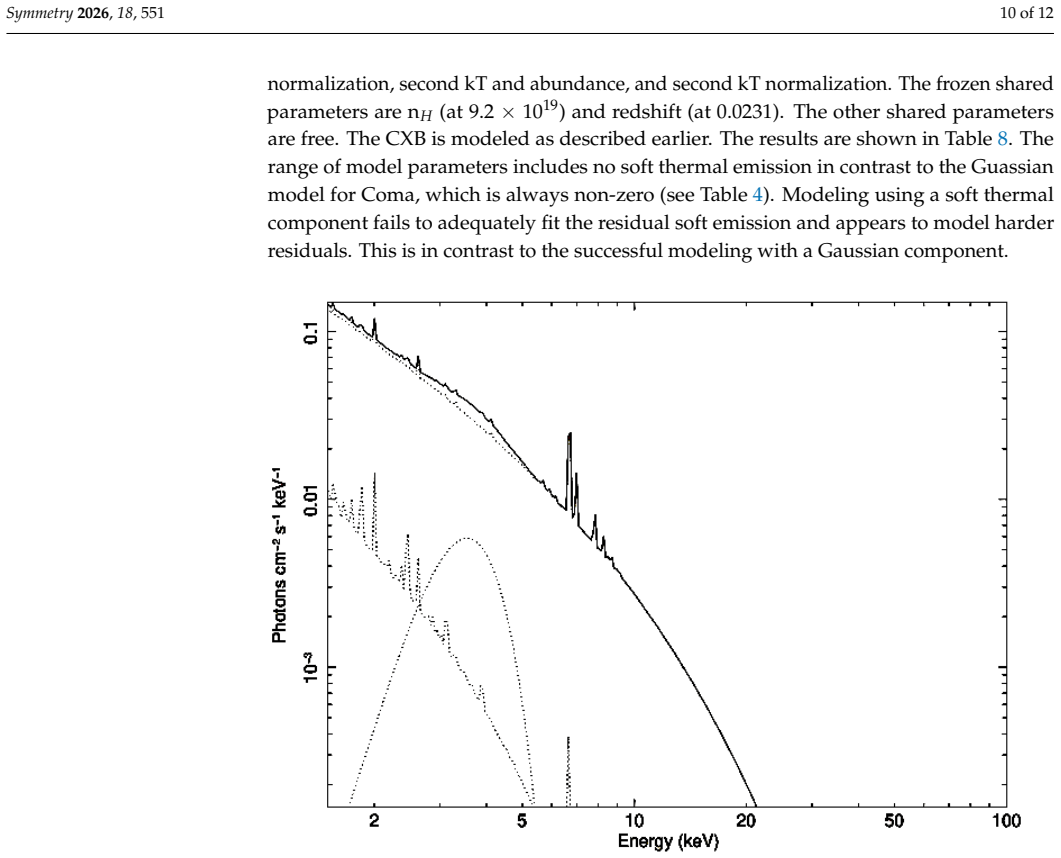
We have searched for the 3.55 keV line from sterile neutrino decay using 3.1 megaseconds of RXTE cluster data. A 2.5$\sigma$ excess of emission over a thermal model is found over the energy span of the 3.55 keV line in the combined spectra of the eight clusters that individually have an excess. The residuals are added to increase the signal to noise ratio of the excess, which is then modeled with a Gaussian to simulate the instrumental spectral response. We find a significant correlation (r = 0.76) for a line centered at 3.6 keV with a model flux of 3.07 x 10$^{-5}$ ph cm$^{-2}$ s$^{-1}$. Mixing angle for detected clusters ranges from 0.35 to 6.2 x 10$^{-10}$. The decay rate inferred from the line flux is strongly correlated (r = 0.87) with cluster temperature, which is due to hotter, more massive clusters having a larger amount of dark matter. Approximately half of the decay line total flux comes from the Coma cluster. We fit the Coma cluster spectrum with two different three-component models. The first includes a Gaussian fixed at 3.55 keV to model soft emission. The second three-component model uses a second thermal component to model soft emission. The model fit parameters indicate that the second thermal component is modeling high-energy residuals rather than low ones, where the Gaussian is. Though our line fluxes exceed most reported detections and upper limits, they do not overproduce the dark matter. We conclude that some fraction of the marginally detected excess could be attributed to the decay line since low-temperature thermal emission and systematics fail to model it completely.
Editorial analysis
A structured set of objections, weighed in public.
Referee Report
Summary. The paper reports a search for the 3.55 keV sterile neutrino decay line in 3.1 Ms of RXTE galaxy cluster observations. It identifies a 2.5σ excess over thermal models in the stacked residuals of eight clusters pre-selected for showing individual excesses, fits the excess with a Gaussian centered at 3.6 keV, reports a line flux of 3.07×10^{-5} ph cm^{-2} s^{-1} and correlations (r=0.76 with flux, r=0.87 with temperature), derives mixing angles, and concludes that low-temperature thermal emission and systematics cannot fully account for the excess, so some fraction may be the decay line. Fluxes exceed some prior limits but do not overproduce dark matter.
Significance. If the excess survives correction for selection effects and is shown to be robust against background modeling, the result would add a cluster-based constraint to the 3.55 keV line debate and demonstrate the utility of RXTE archival data for line searches. The explicit check that the inferred decay rate does not overproduce the dark matter content is a positive feature. At present the marginal significance and data-dependent sample selection limit the strength of the claim.
major comments (2)
- The procedure of first identifying the eight clusters that individually show an excess and then stacking their residuals (abstract and main analysis description) conditions the combined 2.5σ detection, the Gaussian fit parameters, and the reported correlations (r = 0.76 and r = 0.87) on the presence of the very feature under test. This post-selection bias means the significance and temperature correlation are not independent of the selection step and require either a pre-defined sample or explicit quantification of the selection effect (e.g., via Monte Carlo trials on the full cluster list).
- Spectral fitting and background subtraction (abstract and Coma cluster section): the manuscript states that a second thermal component fails to model the low-energy residuals while a Gaussian at 3.55 keV succeeds, but provides no quantitative comparison (Δχ², residual plots, or degrees of freedom) between the two three-component models. Without these details the claim that “low-temperature thermal emission and systematics fail to model it completely” cannot be evaluated.
minor comments (2)
- The abstract reports the line flux without specifying the exact energy band or normalization convention used in the Gaussian fit; this should be stated explicitly.
- The paper should include a table or figure showing the individual cluster residuals and fit statistics before stacking to allow readers to assess the selection.
Simulated Author's Rebuttal
We thank the referee for their careful and constructive review of our manuscript. We address each major comment point by point below, outlining the revisions we will implement to improve the robustness of the analysis.
read point-by-point responses
-
Referee: The procedure of first identifying the eight clusters that individually show an excess and then stacking their residuals (abstract and main analysis description) conditions the combined 2.5σ detection, the Gaussian fit parameters, and the reported correlations (r = 0.76 and r = 0.87) on the presence of the very feature under test. This post-selection bias means the significance and temperature correlation are not independent of the selection step and require either a pre-defined sample or explicit quantification of the selection effect (e.g., via Monte Carlo trials on the full cluster list).
Authors: We agree that selecting the eight clusters based on the presence of individual excesses introduces a post-selection bias that affects the stacked significance, Gaussian parameters, and reported correlations. To address this rigorously, we will revise the manuscript to either adopt a pre-defined sample of clusters selected independently of the line feature or perform Monte Carlo simulations on the full RXTE cluster catalog to quantify and correct for the selection effects. The revised analysis will report bias-adjusted significances and correlation coefficients, with full details added to the methods and results sections. revision: yes
-
Referee: Spectral fitting and background subtraction (abstract and Coma cluster section): the manuscript states that a second thermal component fails to model the low-energy residuals while a Gaussian at 3.55 keV succeeds, but provides no quantitative comparison (Δχ², residual plots, or degrees of freedom) between the two three-component models. Without these details the claim that “low-temperature thermal emission and systematics fail to model it completely” cannot be evaluated.
Authors: We acknowledge that the current manuscript lacks the quantitative metrics needed to fully evaluate the model comparison. In the revised version, we will include explicit Δχ² values, degrees of freedom for each fit, and comparative residual plots for the two three-component models applied to the Coma cluster. These additions will demonstrate that the Gaussian component provides a statistically superior description of the low-energy residuals relative to the additional thermal component, supporting our conclusion while allowing readers to assess the fits directly. revision: yes
Circularity Check
No significant circularity; derivation is self-contained observational analysis
full rationale
The paper selects eight clusters showing individual excesses, combines their residuals to report a 2.5σ excess, fits a Gaussian to model the line, infers decay rates and mixing angles, and computes empirical correlations (r=0.76 for flux, r=0.87 for decay rate vs. temperature) directly from those data. These steps are standard post-processing of fitted results rather than any reduction to inputs by construction. The temperature correlation is attributed to an external physical expectation (hotter clusters contain more dark matter), not derived tautologically from the selection. Model comparisons for Coma (Gaussian vs. second thermal component) test alternatives without self-referential loops. No self-citations, uniqueness theorems, or ansatzes are invoked as load-bearing. The chain remains independent of the target claims.
Axiom & Free-Parameter Ledger
free parameters (2)
- Line flux =
3.07 x 10^{-5} ph cm^{-2} s^{-1}
- Mixing angle =
0.35 to 6.2 x 10^{-10}
axioms (1)
- domain assumption The background and thermal emission models accurately describe the cluster spectra except for the potential line.
Reference graph
Works this paper leans on
-
[1]
Lepton Asymmetries in Cosmology
Lattanzi, M.; Moretti, M. Lepton Asymmetries in Cosmology. Symmetry 2024, 16, 1657. [CrossRef]
work page 2024
-
[2]
New Dark Matter Candidate: Nonthermal Sterile Neutrinos
Shi, X.-D.; Fuller, G.M. New Dark Matter Candidate: Nonthermal Sterile Neutrinos. Phys. Rev. Lett. 1999, 82, 2832. [CrossRef]
work page 1999
-
[3]
Sterile neutrino hot, warm, and cold dark matter
Abazajian, K.; Fuller, G.M.; Patel, M. Sterile neutrino hot, warm, and cold dark matter. Phys. Rev. D 2001, 64, 23501. [CrossRef]
work page 2001
-
[4]
Hofmann, F.; Sanders, J.S.; Nandra, K.; Clerc, N.; Gaspari, M. 7.1 keV sterile neutrino constraints from X-ray observations of 33 clusters of galaxies with Chandra ACIS. Astron. Astrophys. 2016, 592, A112. [CrossRef]
work page 2016
-
[5]
Detection of an Unidentified Emission Line in the Stacked X-ray Spectrum of Galaxy Clusters
Bulbul, E.; Markevitch, M.; Foster, A.; Smith, R.K.; Loewenstein, M.; Randall, S.W. Detection of an Unidentified Emission Line in the Stacked X-ray Spectrum of Galaxy Clusters. Astrophys. J. 2014, 789, 13. [CrossRef]
work page 2014
-
[6]
A Suzaku search for dark matter emission lines in the X-ray brightest galaxy clusters
Urban, O.; Werner, N.; Allen, S.W.; Simionescu, A.; Kaastra, J.S.; Strigari, L.E. A Suzaku search for dark matter emission lines in the X-ray brightest galaxy clusters. Mon. Not. R. Astron. Soc. 2015, 451, 2447. [CrossRef]
work page 2015
-
[7]
M.; Jahoda, K.; Angelini, L.; Kaaret, P .; Zajczyk, A.; LaRocca, D.M.; Ringuette, R.; Richardson, J
Silich, E. M.; Jahoda, K.; Angelini, L.; Kaaret, P .; Zajczyk, A.; LaRocca, D.M.; Ringuette, R.; Richardson, J. A Search for the 3.5 keV Line from the Milky Way’s Dark Matter Halo with HaloSat. Astrophys. J. 2021, 916, 2. [CrossRef]
work page 2021
-
[8]
Improvements to the PCA Response
Shaposhnikov, N.; Jahoda, K.; Markwardt, C.B. Improvements to the PCA Response. Online Document. 2009. Available online: https://heasarc.gsfc.nasa.gov/docs/xte/pca/doc/rmf/pcarmf-11.7/ (accessed on 16 March 2026)
work page 2009
-
[9]
The spectrum of the cosmic X-ray background observed by RTXE/PCA
Revnivtsev, M.; Gilfanov, M.; Sunyaev, R.; Jahoda, K.; Markwardt, C. The spectrum of the cosmic X-ray background observed by RTXE/PCA. Astron. Astrophys. 2003, 411, 329. [CrossRef]
work page 2003
-
[11]
The Abundances of the Elements: Meteoritic and Solar
Anders, E.; Grevesse, N. The Abundances of the Elements: Meteoritic and Solar. Geochim. Cosmochim. Acta 1989, 53, 197. [CrossRef]
work page 1989
-
[12]
Calibration of the Rossi X-Ray Timing Explorer Proportional Counter Array
Jahoda, K.; Markwardt, C.B.; Radeva, Y.; Rots, A.H.; Stark, M.J.; Swank, J.H.; Strohmayer, T.E.; Zhang, W. Calibration of the Rossi X-Ray Timing Explorer Proportional Counter Array. Astrophys. J. Suppl. Ser. 2006, 163, 401. [CrossRef]
work page 2006
-
[13]
The Baryonic Fraction in Groups of Galaxies from X-Ray Measurements
Henriksen, M.J.; Mamon, G.A. The Baryonic Fraction in Groups of Galaxies from X-Ray Measurements. Astrophys. J. 1994, 421, L63. [CrossRef]
work page 1994
-
[14]
Comparisons of Cluster Mass Determinations by X-ray Observations and Gravitational Lensing.Astrophys
Wu, X.-P .; Fang, L.-Z. Comparisons of Cluster Mass Determinations by X-ray Observations and Gravitational Lensing.Astrophys. J. Lett. 1996, 467, L45. [CrossRef]
work page 1996
-
[15]
Soft X-ray emission from warm gas in IllustrisTNG circum-cluster environments
Gouin, C.; Bonamente, M.; Galárraga-Espinosa, D.; Walker, S.; Mirakhor, M. Soft X-ray emission from warm gas in IllustrisTNG circum-cluster environments. Astron. Astrophys. 2023, 680, A94. [CrossRef]
work page 2023
-
[16]
Dark X-Ray Galaxies in the A1367 Galaxy Cluster
Henriksen, M.J.; Dusek, S. Dark X-Ray Galaxies in the A1367 Galaxy Cluster. Astrophys. J. Lett. 2021, 917, L33. [CrossRef]
work page 2021
-
[17]
Russell, H.R.; McNamara, B.R.; Edge, A.C.; Hogan, M.T.; Main, R.A.; Vantyghem, A.N. Radiative efficiency, variability and Bondi accretion on to massive black holes: The transition from radio AGN to quasars in brightest cluster galaxies. Mon. Not. R. Astron. Soc. 2013, 432, 530. [CrossRef]
work page 2013
-
[18]
Bhargava, S.; Giles, P .A.; Romer, A.K.; Jeltema, T.; Mayers, J.; Bermeo, A.; Hilton, M.; Wilkinson, R.; Vergara, C.; Collins, C.A.; et al. The XMM Cluster Survey: New evidence for the 3.5-keV feature in clusters is inconsistent with a dark matter origin. Mon. Not. R. Astron. Soc. 2020, 497, 656. [CrossRef]
work page 2020
-
[19]
Next decade of sterile neutrino studies
Boyarsky, A.; Iakubovskyi, D.; Ruchayskiy, O. Next decade of sterile neutrino studies. Phys. Dark Universe 2012, 1, 136. [CrossRef]
work page 2012
-
[20]
Sterile neutrinos in cosmology
Abazajian, K. Sterile neutrinos in cosmology. Phys. Rep. 2017, 711–712, 1–28. [CrossRef] Disclaimer/Publisher’s Note: The statements, opinions and data contained in all publications are solely those of the individual author(s) and contributor(s) and not of MDPI and/or the editor(s). MDPI and/or the editor(s) disclaim responsibility for any injury to peopl...
discussion (0)
Sign in with ORCID, Apple, or X to comment. Anyone can read and Pith papers without signing in.