Recognition: unknown
GFlowState: Visualizing the Training of Generative Flow Networks Beyond the Reward
Pith reviewed 2026-05-09 21:54 UTC · model grok-4.3
The pith
GFlowState visualizes GFlowNet training to reveal sampling trajectories and policy evolution.
A machine-rendered reading of the paper's core claim, the machinery that carries it, and where it could break.
Core claim
GFlowState is a visual analytics system whose coordinated views—candidate ranking charts, state projections, trajectory networks, and transition heatmaps—make the construction of samples and the evolution of the sampling policy observable, thereby supporting the identification of underexplored regions and sources of training failure in GFlowNets.
What carries the argument
The GFlowState system, which combines a node-link diagram of the trajectory network with a transition heatmap to track how the model builds complete samples step by step and how its action probabilities shift.
If this is right
- Users can compare the distribution of generated samples to reference datasets to measure coverage of the target space.
- Trajectory and transition views expose whether the model is concentrating on narrow paths or exploring broadly.
- Case studies across domains show the views help debug models that standard reward tracking misses.
- Overall training interpretability increases by surfacing structural dynamics beyond scalar metrics.
Where Pith is reading between the lines
- These visualization patterns could transfer to other sequential generative models to expose their own exploration shortfalls.
- Embedding the views inside the training loop might allow automatic alerts when new regions stop being sampled.
- Extending the approach to larger state spaces would test whether the same views remain scalable for complex applications.
Load-bearing premise
The specific visualizations chosen actually yield information that developers can interpret and act on to improve their GFlowNet models.
What would settle it
If developers who use GFlowState in the reported case studies still cannot locate training failures or underexplored regions that remain invisible without the tool, the utility claim would be refuted.
Figures


read the original abstract
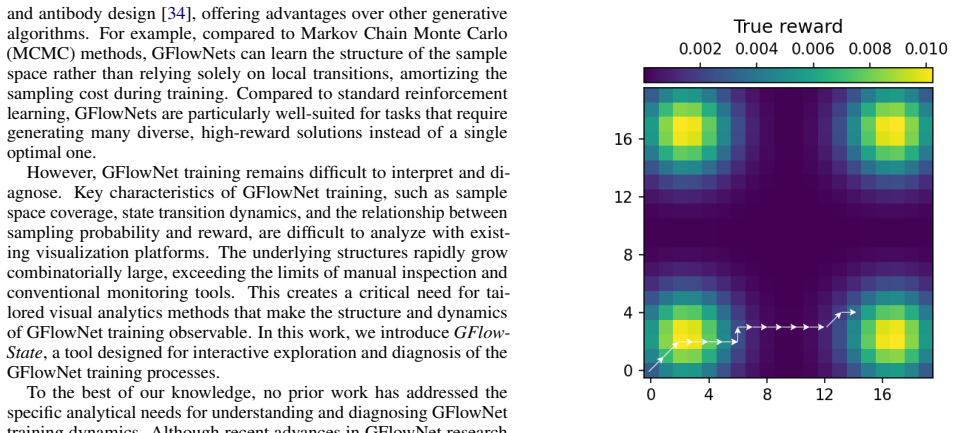
We present GFlowState, a visual analytics system designed to illuminate the training process of Generative Flow Networks (GFlowNets or GFNs). GFlowNets are a probabilistic framework for generating samples proportionally to a reward function. While GFlowNets have proved to be powerful tools in applications such as molecule and material discovery, their training dynamics remain difficult to interpret. Standard machine learning tools allow metric tracking but do not reveal how models explore the sample space, construct sample trajectories, or shift sampling probabilities during training. Our solution, GFlowState, allows users to analyze sampling trajectories, compare the sample space relative to reference datasets, and analyze the training dynamics. To this end, we introduce multiple views, including a chart of candidate rankings, a state projection, a node-link diagram of the trajectory network, and a transition heatmap. These visualizations enable GFlowNet developers and users to investigate sampling behavior and policy evolution, and to identify underexplored regions and sources of training failure. Case studies demonstrate how the system supports debugging and assessing the quality of GFlowNets across application domains. By making the structural dynamics of GFlowNets observable, our work enhances their interpretability and can accelerate GFlowNet development in practice.
Editorial analysis
A structured set of objections, weighed in public.
Referee Report
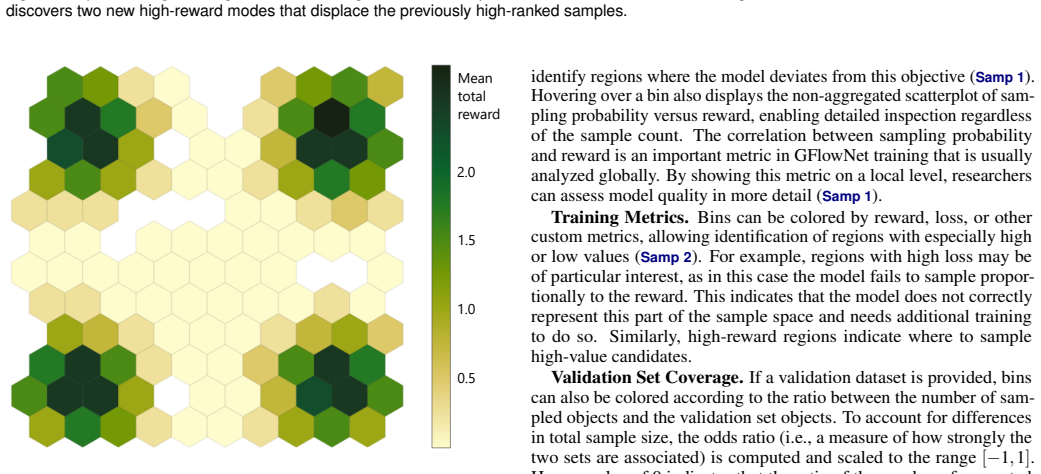
Summary. The paper presents GFlowState, a visual analytics system for Generative Flow Networks (GFlowNets) that introduces four visualizations—candidate rankings, state projection, trajectory network, and transition heatmap—to analyze sampling trajectories, compare the explored sample space against reference datasets, and inspect training dynamics. The central claim is that these views enable identification of underexplored regions and sources of training failure, thereby supporting debugging and quality assessment of GFlowNets, as illustrated through case studies across application domains.
Significance. If the visualizations reliably surface actionable structure missed by scalar metrics and lead to verifiable model improvements, the work would meaningfully advance interpretability for GFlowNets, a framework used in molecule and material discovery. The system design itself is a strength, but the current evidence base of descriptive case studies without quantitative validation limits the demonstrated practical impact.
major comments (1)
- [Case Studies] Case Studies section: the descriptions show how the four visualizations surface issues such as biased transitions or missing flow paths, yet supply no before/after quantitative comparisons on GFlowNet-specific quantities (e.g., reward-weighted coverage, trajectory diversity, or flow-matching error) after users act on the insights. This leaves the claim that the system enables improved models unsupported by measurable gains.
minor comments (1)
- [Abstract] The abstract and introduction could more explicitly state the evaluation methodology (e.g., whether any user study or controlled comparison was performed) to set expectations for the case-study evidence.
Simulated Author's Rebuttal
We thank the referee for their constructive feedback on our manuscript. We address the single major comment below.
read point-by-point responses
-
Referee: [Case Studies] Case Studies section: the descriptions show how the four visualizations surface issues such as biased transitions or missing flow paths, yet supply no before/after quantitative comparisons on GFlowNet-specific quantities (e.g., reward-weighted coverage, trajectory diversity, or flow-matching error) after users act on the insights. This leaves the claim that the system enables improved models unsupported by measurable gains.
Authors: We thank the referee for this observation. The case studies are intended to illustrate how the visualizations can surface training issues (e.g., biased transitions or missing flow paths) that scalar metrics do not readily reveal. However, the manuscript does not claim that GFlowState enables improved models or produces measurable gains on GFlowNet-specific quantities such as reward-weighted coverage, trajectory diversity, or flow-matching error. The contribution centers on the design of the visual analytics system and its use for interpretability, debugging, and quality assessment, with the case studies serving as qualitative demonstrations of these capabilities. Because no such performance-improvement claim is made, before-and-after quantitative comparisons fall outside the paper's scope. We therefore see no need to revise the manuscript on this point. revision: no
Circularity Check
No circularity: descriptive visualization system paper with no derivations
full rationale
The manuscript introduces a visual analytics tool (GFlowState) consisting of four views for inspecting GFlowNet training trajectories and sampling behavior. It contains no equations, no parameter fitting, no predictions derived from inputs, and no load-bearing self-citations that reduce claims to prior work by the same authors. All support comes from descriptive case studies across domains; the central claim that the visualizations aid debugging is presented as an empirical observation rather than a mathematical derivation that could close on itself. This is a standard system-description paper whose reasoning chain is self-contained and externally verifiable through the described interfaces.
Axiom & Free-Parameter Ledger
Reference graph
Works this paper leans on
-
[1]
Bengio, M
E. Bengio, M. Jain, M. Korablyov, D. Precup, and Y . Bengio. Flow network based generative models for non-iterative diverse candi- date generation. InAdvances in Neural Information Processing Systems, vol. 34, pp. 27381–27394. Red Hook, NY , USA, 2021. https://proceedings.neurips.cc/paper_files/paper/2021/ hash/e614f646836aaed9f89ce58e837e2310-Abstract.html. 1, 2
2021
-
[2]
Bengio, S
Y . Bengio, S. Lahlou, T. Deleu, E. J. Hu, M. Tiwari, and E. Bengio. GFlowNet foundations.Journal of Machine Learning Research, 24(210):1– 55, 2023.http://jmlr.org/papers/v24/22-0364.html. 2
2023
-
[3]
L. Biewald. Experiment tracking with weights and biases, 2020. 3
2020
-
[4]
Lawrence Zit- nick, and Zachary Ulissi
L. Chanussot, A. Das, S. Goyal, T. Lavril, M. Shuaibi, M. Riviere et al. Open catalyst 2020 (OC20) dataset and community challenges.ACS Catalysis, 11(10):6059–6072, 2021. doi: 10.1021/acscatal.0c04525 1
-
[5]
S. Dara, S. Dhamercherla, S. S. Jadav, C. M. Babu, and M. J. Ahsan. Machine learning in drug discovery: A review.Artificial Intelligence Review, 55(3):1947–1999, 2022. doi: 10.1007/s10462-021-10058-4 1
-
[6]
T. Developers. TensorFlow, 2026. doi: 10.5281/ZENODO.4724125 3
-
[7]
K. Eckelt, A. Hinterreiter, P. Adelberger, C. Walchshofer, V . Dhanoa, C. Humer et al. Visual exploration of relationships and structure in low- dimensional embeddings.IEEE Transactions on Visualization and Com- puter Graphics, 2022. doi: 10.1109/TVCG.2022.3156760 6
-
[8]
A. Hinterreiter, P. Ruch, H. Stitz, M. Ennemoser, J. Bernard, H. Strobelt et al. ConfusionFlow: A model-agnostic visualization for temporal analysis of classifier confusion.IEEE Transactions on Visualization and Computer Graphics, 28(2):1222–1236, 2022. doi: 10.1109/TVCG.2020.3012063 3
- [9]
-
[10]
Holeczek
F. Holeczek. GFlowState. https://github.com/florianholeczek/ GFlowNet_Training_Vis_Pilot. 7
-
[11]
Holeczek, A
F. Holeczek, A. Hillisch, A. Hinterreiter, A. Hernandez-Garcia, M. Streit, and C. Humer. GFlowNet Playground - theory and examples for an intuitive understanding.Workshop on Visualization for AI Explainability, 2025.https://gfn-playground.jku-vds-lab.at/. 2, 3
2025
-
[12]
M. Jain, T. Deleu, J. Hartford, C.-H. Liu, A. Hernandez-Garcia, and Y . Ben- gio. GFlowNets for AI-driven scientific discovery.Digital Discovery, 2(3):557–577, 2023. doi: 10.1039/D3DD00002H 1, 2
-
[13]
M. Kahng, N. Thorat, D. H. Chau, F. B. Viégas, and M. Wattenberg. GAN Lab: Understanding complex deep generative models using interactive visual experimentation.IEEE Transactions on Visualization and Computer Graphics, 25(1):310–320, 2019. doi: 10.1109/TVCG.2018.2864500 3
-
[14]
B. Lee, C. Parr, B. Bederson, V . Veksler, W. Gray, C. Kotfila et al. TreePlus: Interactive exploration of networks with enhanced tree layouts.IEEE Transactions on Visualization and Computer Graphics, 12(6):1414–1426,
-
[15]
doi: 10.1109/TVCG.2006.106 3
-
[16]
Malkin, M
N. Malkin, M. Jain, E. Bengio, C. Sun, and Y . Bengio. Trajectory balance: Improved credit assignment in GFlowNets. In S. Koyejo, S. Mohamed, A. Agarwal, D. Belgrave, K. Cho, and A. Oh, eds.,Advances in Neural Information Processing Systems, vol. 35, pp. 5955–5967, 2022. https: //proceedings.neurips.cc/paper_files/paper/2022/file/ 27b51baca8377a0cf109f6ec...
2022
-
[17]
Y . Metz, E. Bykovets, L. Joos, D. Keim, and M. El-Assady. VISITOR: Visual interactive state sequence exploration for reinforcement learning. Computer Graphics Forum, 42(3):397–408, 2023. doi: 10.1111/cgf.14839 2, 3
-
[18]
Mishra, U
A. Mishra, U. Soni, J. Huang, and C. Bryan. Why? why not? when? visual explanations of agent behaviour in reinforcement learning. In2022 IEEE 15th Pacific Visualization Symposium (PacificVis), pp. 111–120,
-
[19]
doi: 10.1109/PacificVis53943.2022.00020 3
ISSN: 2165-8773. doi: 10.1109/PacificVis53943.2022.00020 3
-
[20]
Hernández-García, A
Mistal, A. Hernández-García, A. V olokhova, A. A. Duval, Y . Bengio, D. Sharma et al. Crystal-GFN: sampling materials with desirable prop- erties and constraints. InAI for Accelerated Materials Design, 2023. https://openreview.net/forum?id=l167FjdPOv. 2, 7
2023
-
[21]
C. Nobre, M. Streit, and A. Lex. Juniper: A tree+table approach to multivariate graph visualization.IEEE Transactions on Visualization and Computer Graphics, 25(1):544 – 554, Jan. 2019. doi: 10.1109/TVCG. 2018.2865149 3
-
[22]
Podina, A
L. Podina, A. Hernández-García, C. Humer, A. Duval, V . Schmidt, A. Ram- laoui et al. Catalyst GFlowNet for electrocatalyst design: A hydrogen evolution reaction case study. InAI for Accelerated Materials Design, 2025.https://openreview.net/forum?id=z80sbzFMBE. 1
2025
-
[23]
V . Prasad, H. van Gorp, C. Humer, R. J. G. van Sloun, A. Vilanova, and N. Pezzotti. EvolvED: Evolutionary embeddings to understand the generation process of diffusion models.Computer Graphics Forum, 2025. doi: 10.1111/cgf.70301 3
-
[24]
: Data visualization practitioners’ perspectives on chartjunk
M. Pühringer, A. Hinterreiter, and M. Streit. InstanceFlow: Visualizing the evolution of classifier confusion at the instance level. In2020 IEEE Visualization Conference (VIS), pp. 291–295. Salt Lake City, 2020. doi: 10.1109/VIS47514.2020.00065 3
-
[25]
D. Rolnick, P. L. Donti, L. H. Kaack, K. Kochanski, A. Lacoste, K. Sankaran et al. Tackling climate change with machine learning.ACM Computing Surveys, 55(2):42:1–42:96, 2022. doi: 10.1145/3485128 1
-
[26]
R. Sevastjanova, E. Cakmak, S. Ravfogel, R. Cotterell, and M. El-Assady. Visual comparison of language model adaptation.IEEE Transactions on Visualization and Computer Graphics, 29(1):1178–1188, 2023. doi: 10. 1109/TVCG.2022.3209458 2
-
[27]
M. W. Shen, E. Bengio, E. Hajiramezanali, A. Loukas, K. Cho, and T. Biancalani. Towards understanding and improving gflownet training. InProceedings of the International Conference on Machine Learning, pp. 30956–30975, 2023. https://proceedings.mlr.press/v202/ shen23a.html. 2, 3
2023
-
[28]
T. Spinner, R. Kehlbeck, R. Sevastjanova, T. Stähle, D. A. Keim, O. Deussen et al. -generAItor: Tree-in-the-loop text generation for lan- guage model explainability and adaptation.ACM Transactions on Interac- tive Intelligent Systems, 14(2):14:1–14:32, 2024. doi: 10.1145/3652028 3
-
[29]
T. Spinner, R. Sevastjanova, R. Kehlbeck, T. Stähle, D. A. Keim, O. Deussen et al. Revealing the unwritten: Visual investigation of beam search trees to address language model prompting challenges. InProceed- ings of the 63rd Annual Meeting of the Association for Computational Linguistics (Volume 3: System Demonstrations), pp. 295–306. Vienna, Austria, 20...
-
[30]
H. Strobelt, S. Gehrmann, M. Behrisch, A. Perer, H. Pfister, and A. M. Rush. Seq2seq-Vis: A visual debugging tool for sequence-to-sequence models.IEEE Transactions on Visualization and Computer Graphics, 25(1):353–363, 2019. doi: 10.1109/TVCG.2018.2865044 2
-
[31]
H. Strobelt, S. Gehrmann, H. Pfister, and A. M. Rush. LSTMVis: A tool for visual analysis of hidden state dynamics in recurrent neural networks. IEEE Transactions on Visualization and Computer Graphics, 24(1):667– 676, 2018. doi: 10.1109/TVCG.2017.2744158 2
-
[32]
von Landesberger, A
T. von Landesberger, A. Kuijper, T. Schreck, J. Kohlhammer, J. van Wijk, J.-D. Fekete et al. Visual analysis of large graphs: State-of-the-art and future research challenges.Computer Graphics Forum, 30(6):1719–1749,
-
[33]
doi: 10.1111/j.1467-8659.2011.01898.x 3
-
[34]
H. Wang, T. Fu, Y . Du, W. Gao, K. Huang, Z. Liu et al. Scientific discovery in the age of artificial intelligence.Nature, 620(7972):47–60, 2023. doi: 10.1038/s41586-023-06221-2 1
- [35]
-
[36]
Z. J. Wang, R. Turko, O. Shaikh, H. Park, N. Das, F. Hohman et al. CNN Explainer: Learning convolutional neural networks with interactive visualization.IEEE Transactions on Visualization and Computer Graphics, 27(2):1396–1406, 2021. doi: 10.1109/TVCG.2020.3030418 2
-
[37]
M. Yin, H. Zhou, Y . Zhu, J. Wu, W. Wu, M. Li et al. Synergy of GFlowNet and protein language model makes a diverse antibody designer. InPro- ceedings of the Thirty-Ninth AAAI Conference on Artificial Intelligence, vol. 39, pp. 22164–22172, 2025. doi: 10.1609/aaai.v39i21.34370 2
-
[38]
J. Yuan, C. Chen, W. Yang, M. Liu, J. Xia, and S. Liu. A survey of visual analytics techniques for machine learning.Computational Visual Media, 7(1):3–36, 2021. doi: 10.1007/s41095-020-0191-7 3
-
[39]
Zahavy, N
T. Zahavy, N. Ben-Zrihem, and S. Mannor. Graying the black box: Un- derstanding DQNs. InProceedings of the International Conference on Machine Learning, pp. 1899–1908, 2016. https://proceedings.mlr. press/v48/zahavy16.html. 2, 3
1908
discussion (0)
Sign in with ORCID, Apple, or X to comment. Anyone can read and Pith papers without signing in.