Recognition: unknown
The Effects of Complex Accretion Disk Geometry on Broadened Iron Kα Lines
Pith reviewed 2026-05-09 20:18 UTC · model grok-4.3
The pith
Non-negligible thickness in black hole accretion disks leads flat models to underestimate spin, corona height, and inclination.
A machine-rendered reading of the paper's core claim, the machinery that carries it, and where it could break.
Core claim
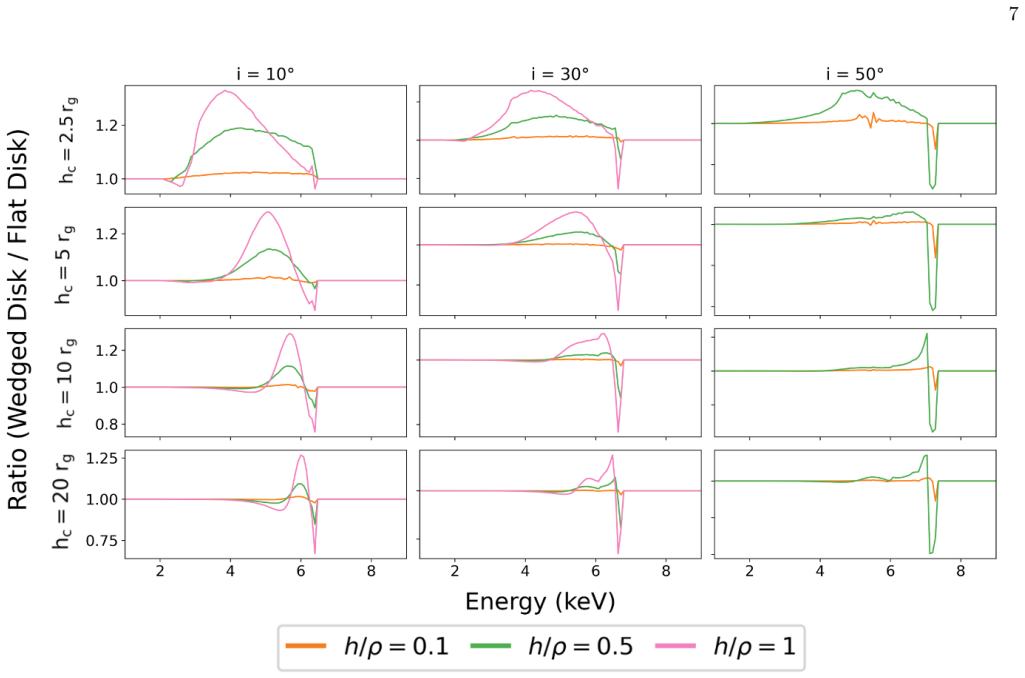
Using novel general relativistic ray tracing simulations, we investigate the effects of complex accretion disk geometries, including constant aspect ratio, radiation-pressure-dominated Shakura-Sunyaev, expanded inner disk, and warped disks, on the iron Kα line. We find that non-negligible thickness underestimates black hole spin, corona height, and inclination angle when fitted with a flat disk model using XRISM uncertainties, and that warped disk models cannot be fit with the flat disk approximation.
What carries the argument
General relativistic ray tracing simulations of X-ray illumination and reflection off accretion disks with varying geometries to model the broadened iron Kα line.
Load-bearing premise
That the differences in the iron line arise solely from the disk geometry and not from other factors such as turbulence, ionization structure, or the corona not being a point source.
What would settle it
Observe the iron Kα line profile in a source with independently measured disk thickness and compare the spin value from a flat model fit to the true spin to see if it matches the underestimation predicted by the simulations.
Figures


read the original abstract
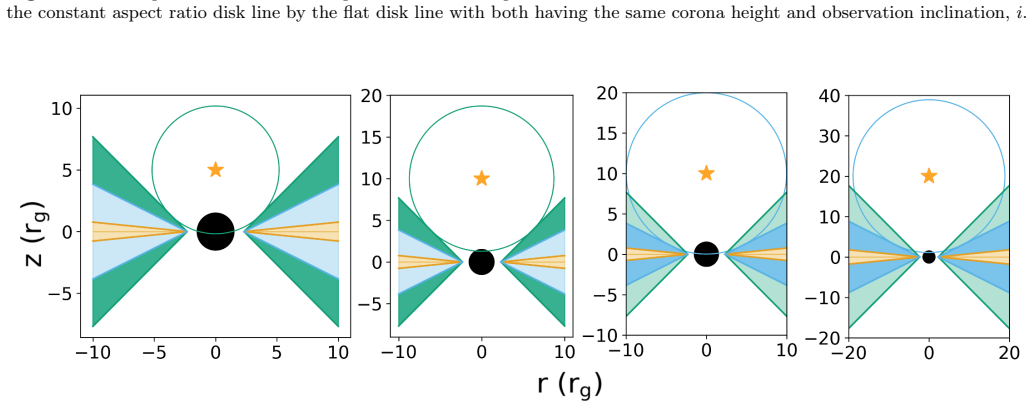
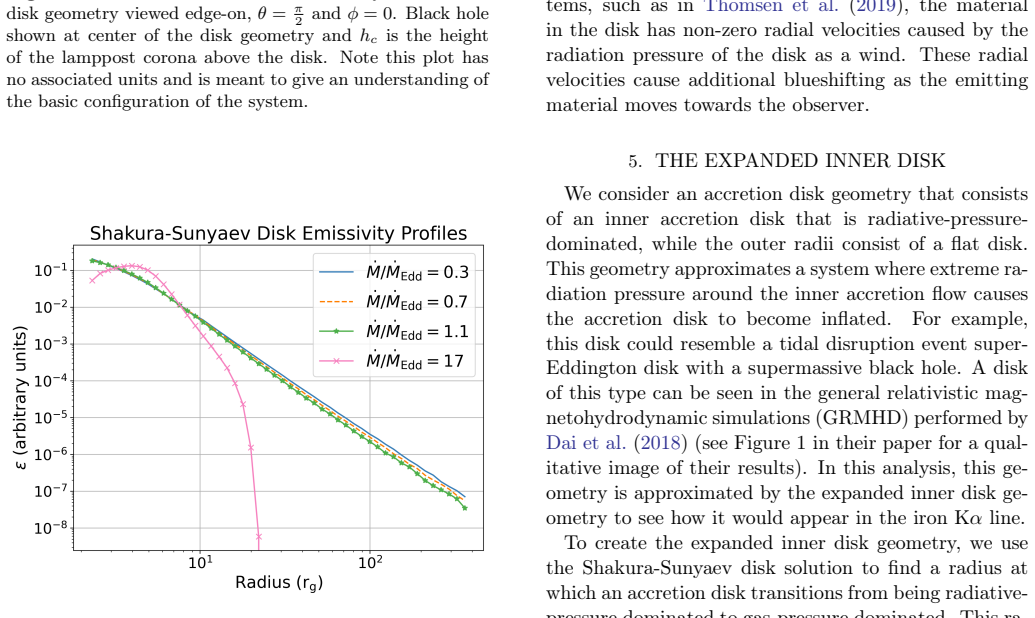
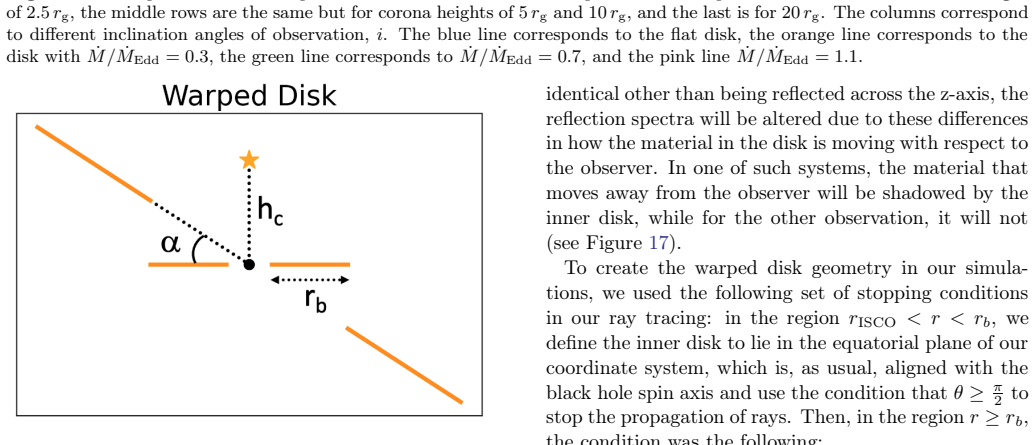
X-rays are emitted from the corona above the orbiting matter of the accretion disk and travel either directly to us or illuminate the disk. This illumination of the inner disk is enhanced by gravitational light bending, which focuses the rays towards the black hole and therefore towards the inner radii of the disk. These rays that hit the inner radii are reflected back to us, and we observe them in the X-ray reflection spectrum. In this work, we create novel general relativistic ray tracing simulations to investigate the effects of altering the geometry of the accretion disks of black holes on the most dominant part of the reflection spectrum, the iron K$\alpha$ line. Work demonstrating the effect of disk geometry on the iron line has been performed, though many previous analyses have assumed a simplistic system, consisting of a point-source corona with a flat and infinitesimally thin accretion disk. We extend these models to more realistic accretion disk approximations. These include a constant aspect ratio disk, a radiation-pressure-dominated Shakura-Sunyaev disk, an expanded inner disk that has a non-negligible scale height in its inner regions due to radiation pressure, as well as various warped disks. Using measurement uncertainties from XRISM, we find that non-negligible thickness in accretion disks underestimates the black hole spin, corona height, and inclination angle if fitted with a flat disk model. The warped disk model could not be fit with the flat disk approximation.
Editorial analysis
A structured set of objections, weighed in public.
Referee Report
Summary. The paper uses general relativistic ray-tracing simulations to model iron Kα line profiles from black hole accretion disks with non-flat geometries (constant aspect ratio, Shakura-Sunyaev, expanded inner, and warped disks) illuminated by a point-source corona. It reports that fitting the resulting spectra to a standard flat thin-disk model with XRISM-like uncertainties underestimates black hole spin, corona height, and inclination for thick disks, while warped disks cannot be adequately fit by the flat model.
Significance. If the results hold, the work demonstrates concrete biases in spin and geometry inferences from iron line profiles when disk thickness is ignored, with direct relevance to XRISM observations. The forward ray-tracing of multiple realistic geometries is a strength that provides falsifiable predictions for how thickness affects fitted parameters.
major comments (3)
- [§3] §3 (Simulation Setup): The ray-tracing retains a point-source corona and omits disk turbulence, radial ionization gradients, and non-point-source coronal illumination. This assumption is load-bearing for the central claim, as these effects can reshape the iron Kα profile in ways degenerate with geometric thickness, preventing attribution of the reported underestimates solely to disk geometry.
- [Results] Results (XRISM uncertainty fits): No error budgets or Monte Carlo realizations on the simulated spectra are shown, and there is no test that the biases in spin, height, and inclination persist when other assumptions (e.g., emissivity law or ionization) are varied. This limits the robustness of the observational implication stated in the abstract.
- [Warped disk results] Warped disk subsection: The statement that the warped disk 'could not be fit' with the flat model lacks quantitative details on the fitting statistic, parameter covariances, or residual structure, making it impossible to determine whether the failure is due to geometry or to other unmodeled aspects of the simulation.
minor comments (2)
- [Abstract] Abstract and §2: The specific warp parameters (radius, amplitude, orientation) and the exact definition of 'expanded inner disk' scale height should be stated explicitly for reproducibility.
- [Figures] Figure captions: Axis labels and units on the simulated spectra and residual plots should be clarified to distinguish between model and data.
Simulated Author's Rebuttal
We thank the referee for their constructive and detailed comments, which have helped us identify areas where the manuscript can be strengthened. We address each major comment below and describe the revisions we will implement.
read point-by-point responses
-
Referee: [§3] §3 (Simulation Setup): The ray-tracing retains a point-source corona and omits disk turbulence, radial ionization gradients, and non-point-source coronal illumination. This assumption is load-bearing for the central claim, as these effects can reshape the iron Kα profile in ways degenerate with geometric thickness, preventing attribution of the reported underestimates solely to disk geometry.
Authors: We acknowledge that the simulations employ a point-source corona and exclude turbulence, radial ionization gradients, and extended coronal illumination. These simplifications were chosen to isolate the effects of disk geometry, which is the primary focus of the work. We agree that the omitted physics can produce line-profile changes that are potentially degenerate with thickness effects. In the revised manuscript we will expand the discussion section to explicitly address these degeneracies, state the limitations of the current setup, and note that future modeling incorporating turbulence and ionization gradients will be required to fully disentangle the contributions. This addition will clarify the scope of our central claim without altering the reported geometric biases. revision: partial
-
Referee: [Results] Results (XRISM uncertainty fits): No error budgets or Monte Carlo realizations on the simulated spectra are shown, and there is no test that the biases in spin, height, and inclination persist when other assumptions (e.g., emissivity law or ionization) are varied. This limits the robustness of the observational implication stated in the abstract.
Authors: We thank the referee for highlighting the need for quantitative robustness checks. We will add Monte Carlo error analysis by generating multiple noisy realizations of each simulated spectrum using the reported XRISM uncertainties, refitting them, and reporting the resulting distributions and error budgets on the recovered spin, height, and inclination. We will also repeat the fitting exercise for a range of emissivity indices and ionization states to test whether the reported underestimates remain. These new results will be incorporated into the results section and will directly support the observational implications in the abstract. revision: yes
-
Referee: [Warped disk results] Warped disk subsection: The statement that the warped disk 'could not be fit' with the flat model lacks quantitative details on the fitting statistic, parameter covariances, or residual structure, making it impossible to determine whether the failure is due to geometry or to other unmodeled aspects of the simulation.
Authors: We agree that the current description lacks the necessary quantitative support. In the revised manuscript we will report the best-fit χ²/dof values, the recovered parameter values with 1σ uncertainties, and the covariance information for the attempted flat-disk fits to the warped-disk spectra. We will also include residual plots that illustrate the systematic mismatches. These additions will demonstrate that the poor fits arise from the inability of the flat-disk model to reproduce the complex line profile produced by the warp. revision: yes
Circularity Check
No circularity: results from independent forward simulations fitted to separate model
full rationale
The paper generates iron Kα line profiles via general relativistic ray-tracing simulations for thick, Shakura-Sunyaev, expanded-inner, and warped disks, then fits those synthetic spectra with an independent flat thin-disk model under XRISM uncertainties. No equation, ansatz, or self-citation reduces the reported biases in spin, height, or inclination to a fitted parameter by construction; the central claim remains an empirical outcome of the simulation-plus-fitting pipeline rather than a definitional or self-referential tautology.
Axiom & Free-Parameter Ledger
axioms (2)
- standard math General relativity governs photon trajectories and gravitational redshift in the strong-field regime near the black hole.
- domain assumption The corona can be approximated as a point source whose illumination pattern is modified only by light bending.
Reference graph
Works this paper leans on
-
[1]
2021, The Astrophysical Journal, 906, 28, doi: 10.3847/1538-4357/abc826
Abarr, Q., & Krawczynski, H. 2021, The Astrophysical Journal, 906, 28, doi: 10.3847/1538-4357/abc826
-
[2]
B., Ayzenberg, D., Bambi, C., et al
Abdikamalov, A. B., Ayzenberg, D., Bambi, C., et al. 2020, The Astrophysical Journal, 899, 80, doi: 10.3847/1538-4357/aba625
-
[3]
Baker, F. J. E., & Young, A. J. 2025, Monthly Notices of the Royal Astronomical Society, 545, staf1770, doi: 10.1093/mnras/staf1770
-
[4]
Bardeen, J. M., & Petterson, J. A. 1975, ApJL, 195, L65, doi: 10.1086/181711
-
[5]
Basko, M. M. 1978, ApJ, 223, 268, doi: 10.1086/156260
-
[6]
Begelman, M. C. 1978, MNRAS, 184, 53, doi: 10.1093/mnras/184.1.53
-
[7]
Brandt, W. N., & Podsiadlowski, P. 1994, The Effects of High-Velocity Supernova Kicks on the Orbital Properties and Sky Distributions of Neutron Star Binaries. https://arxiv.org/abs/astro-ph/9412023
work page internal anchor Pith review arXiv 1994
-
[8]
Brenneman, L. W., & Reynolds, C. S. 2006, ApJ, 652, 1028, doi: 10.1086/508146
-
[9]
Brenneman, L. W., Wilkins, D. R., Ogorzałek, A., et al. 2025, A Sharper View of the X-ray Spectrum of MCG–6-30-15 with XRISM, XMM-Newton and NuSTAR. https://arxiv.org/abs/2510.08926
-
[10]
Cackett, E. M., Bentz, M. C., & Kara, E. 2021, iScience, 24, 102557, doi: https://doi.org/10.1016/j.isci.2021.102557
-
[11]
1976, ApJ, 208, 534, doi: 10.1086/154636
Cunningham, C. 1976, ApJ, 208, 534, doi: 10.1086/154636
-
[12]
Cunningham, C. T. 1975, ApJ, 202, 788, doi: 10.1086/154033
-
[13]
Miller, M. C. 2018, The Astrophysical Journal Letters, 859, L20, doi: 10.3847/2041-8213/aab429
-
[14]
Fabian, A. C., Parker, M. L., Wilkins, D. R., et al. 2014, MNRAS, 439, 2307, doi: 10.1093/mnras/stu045
-
[15]
Fabian, A. C., Rees, M. J., Stella, L., & White, N. E. 1989, MNRAS, 238, 729, doi: 10.1093/mnras/238.3.729
-
[16]
Fabian, A. C., Wilkins, D. R., Miller, J. M., et al. 2012, MNRAS, 424, 217, doi: 10.1111/j.1365-2966.2012.21185.x
-
[17]
Galeev, A. A., Rosner, R., & Vaiana, G. S. 1979, ApJ, 229, 318, doi: 10.1086/156957
-
[18]
George, I. M., & Fabian, A. C. 1991, MNRAS, 249, 352, doi: 10.1093/mnras/249.2.352
-
[19]
Gonzalez, A. G., Wilkins, D. R., & Gallo, L. C. 2017, Monthly Notices of the Royal Astronomical Society, 472, 1932, doi: 10.1093/mnras/stx2080
-
[20]
Hunter, J. D. 2007, Computing in Science & Engineering, 9, 90, doi: 10.1109/MCSE.2007.55
-
[21]
Ichimaru, S. 1977, ApJ, 214, 840, doi: 10.1086/155314
-
[22]
Jiang, J., Abdikamalov, A. B., Bambi, C., & Reynolds, C. S. 2022, Monthly Notices of the Royal Astronomical Society, 514, 3246, doi: 10.1093/mnras/stac1369
-
[23]
Jiang, Y.-F., Stone, J. M., & Davis, S. W. 2014, The Astrophysical Journal, 796, 106, doi: 10.1088/0004-637x/796/2/106
-
[24]
Kara, E., Alston, W. N., Fabian, A. C., et al. 2016, MNRAS, 462, 511, doi: 10.1093/mnras/stw1695
-
[25]
Luminet, J. P. 1979, A&A, 75, 228
1979
-
[26]
Marco, B. D., & Ponti, G. 2016, The Astrophysical Journal, 826, 70, doi: 10.3847/0004-637X/826/1/70
-
[27]
2014, Monthly Notices of the Royal Astronomical Society, 441, 3177, doi: 10.1093/mnras/stu762
Narayan, R. 2014, Monthly Notices of the Royal Astronomical Society, 441, 3177–3208, doi: 10.1093/mnras/stu762
-
[28]
2022, Monthly Notices of the Royal Astronomical Society, 518, 1656–1671, doi: 10.1093/mnras/stac2754
Ingram, A. 2022, Monthly Notices of the Royal Astronomical Society, 518, 1656–1671, doi: 10.1093/mnras/stac2754
-
[29]
2009, Publications of the Astronomical Society of Japan, 61, L7–L11, doi: 10.1093/pasj/61.3.l7
Ohsuga, K., Mineshige, S., Mori, M., & Kato, Y. 2009, Publications of the Astronomical Society of Japan, 61, L7–L11, doi: 10.1093/pasj/61.3.l7
-
[30]
Pringle, J. E. 1981, ARA&A, 19, 137, doi: 10.1146/annurev.aa.19.090181.001033
-
[31]
2003, Physics Reports, 377, 389–466, doi: 10.1016/s0370-1573(02)00584-7
Reynolds, C. 2003, Physics Reports, 377, 389–466, doi: 10.1016/s0370-1573(02)00584-7
-
[32]
I., & Sunyaev, R
Shakura, N. I., & Sunyaev, R. A. 1973, A&A, 24, 337
1973
-
[33]
Shapiro, S. L., Lightman, A. P., & Eardley, D. M. 1976, ApJ, 204, 187, doi: 10.1086/154162
-
[34]
Shashank, S., Abdikamalov, A. B., Liu, H., et al. 2025a, The Astrophysical Journal, 996, 51, doi: 10.3847/1538-4357/ae2614 —. 2025b, Phys. Rev. D, 112, 123030, doi: 10.1103/4sth-rnwv Sądowski, A., Narayan, R., McKinney, J. C., &
-
[35]
, archivePrefix = "arXiv", eprint =
Tchekhovskoy, A. 2014, MNRAS, 439, 503, doi: 10.1093/mnras/stt2479
-
[36]
Svensson, R., & Zdziarski, A. A. 1994, ApJ, 436, 599, doi: 10.1086/174934
-
[37]
Taylor, C., & Reynolds, C. S. 2018a, The Astrophysical Journal, 855, 120, doi: 10.3847/1538-4357/aaad63 —. 2018b, Astrophys. J., 855, 120, doi: 10.3847/1538-4357/aaad63
-
[38]
2019, The Astrophysical Journal Letters, 884, L21, doi: 10.3847/2041-8213/ab4518
Reynolds, C. 2019, The Astrophysical Journal Letters, 884, L21, doi: 10.3847/2041-8213/ab4518
-
[39]
Tremaine, S., & Davis, S. W. 2014, Monthly Notices of the Royal Astronomical Society, 441, 1408–1434, doi: 10.1093/mnras/stu663 22
-
[40]
Virtanen, P., Gommers, R., Oliphant, T. E., et al. 2020, Nature Methods, 17, 261, doi: 10.1038/s41592-019-0686-2
-
[41]
Wilkins, D. R., Cackett, E. M., Fabian, A. C., & Reynolds, C. S. 2016, Monthly Notices of the Royal Astronomical Society, 458, 200–225, doi: 10.1093/mnras/stw276
-
[42]
Wilkins, D. R., & Fabian, A. C. 2012, Monthly Notices of the Royal Astronomical Society, 424, 1284–1296, doi: 10.1111/j.1365-2966.2012.21308.x
-
[43]
Wilkins, D. R., García, J. A., Dauser, T., & Fabian, A. C. 2020, Monthly Notices of the Royal Astronomical Society, 498, 3302–3319, doi: 10.1093/mnras/staa2566
discussion (0)
Sign in with ORCID, Apple, or X to comment. Anyone can read and Pith papers without signing in.