Recognition: unknown
AI-based experts' knowledge visualization of cultural heritage: A case study of Terracotta Warriors
Pith reviewed 2026-05-08 10:36 UTC · model grok-4.3
The pith
AI analysis of a new Terracotta Warriors dataset shows the collection as one entity with shared attribute patterns.
A machine-rendered reading of the paper's core claim, the machinery that carries it, and where it could break.
Core claim
By constructing a dataset of attributes significant for identifying different Terracotta Warriors and applying generative adversarial networks and random forests to optimize the data, analyze distributions and relationships, and visualize the outcomes, the study presents the collection as a unified entity rather than isolated relics.
What carries the argument
An attribute dataset of Terracotta Warriors processed through a pipeline of generative adversarial networks for data augmentation and random forests for relationship analysis, followed by visualization of the results.
Load-bearing premise
The chosen attributes must be sufficient to capture meaningful differences and connections among the warriors, and the AI methods must accurately reveal real patterns in the data.
What would settle it
If the resulting visualizations reveal no distributions or relationships beyond what is already visible from descriptions of individual figures, the value of treating the collection as a unified entity would not be demonstrated.
Figures


read the original abstract
Advancements in 3D modeling,digital display technologies,and the growing availability of digital cultural heritage data have significantly improved the accuracy of heritage depictions and expanded opportunities for analysis.However,while many studies focus on presenting specific cultural heritage figurines,an often overlooked aspect is the visualization of the Terracotta Warriors as a unified entity.This involves concisely representing the distribution of features and their relationships,providing a clear and insightful presentation that engages practitioners, academics,and wider audiences.To tackle the challenges mentioned above,this research seeks to explore the application of AI methods in processing cultural heritage data.It aims to optimize and augment the dataset,analyze the distribution and relationships of various attributes, and interpret the analysis results through visualization techniques.The Terracotta Warriors,among China's most significant cultural heritages and renowned for their abundance,exquisite workmanship,and magnitude,are chosen as a case study.The contribution of this paper is primarily twofold.Firstly,we constructed a dataset of Terracotta Warriors from Pit No.1,detailing the attributes significant for identifying different Terracotta Warriors.Secondly,we employ various AI methods,such as generative adversarial network and random forest,to process and analyze these attributes,followed by visualizing the analysis results for an intuitive presentation.This study introduces a novel scheme for presenting information on a collection of cultural relics,offering a practical case for analyzing and visualizing the Terracotta Warriors'attributes as a whole entity,rather than showcasing individual relics'information in isolation.
Editorial analysis
A structured set of objections, weighed in public.
Referee Report
Summary. The paper claims to introduce a novel visualization scheme for cultural heritage by constructing a dataset of attributes for Terracotta Warriors from Pit No.1 and applying AI methods (GAN for data augmentation/optimization and random forest for analysis of distributions and relationships) to present the collection as a unified entity rather than isolated relics, with results interpreted through visualizations for practitioners, academics, and audiences.
Significance. If the AI pipeline produces verifiable non-trivial insights into attribute distributions and relationships that standard statistical methods do not, and if the visualizations demonstrably improve understanding of the collection as a whole, the work could provide a practical template for digital cultural heritage analysis and presentation in HCI and digital humanities.
major comments (2)
- [Abstract] Abstract: The manuscript states that GAN and random forest are used to optimize/augment the dataset and analyze attribute distributions/relationships, yet supplies no concrete attribute list, no augmentation metrics (e.g., fidelity or diversity scores), no feature-importance or clustering outputs from the random forest, no example visualizations, and no comparison against non-AI baselines such as histograms or pairwise plots. This absence makes it impossible to evaluate whether the claimed 'whole entity' insights are achieved or are load-bearing for the central contribution.
- [Abstract] Abstract and contribution statement: The claim that the approach 'optimizes and augments the dataset' and 'reveals relationships' for an intuitive presentation rests on the unshown assumption that the constructed attributes are sufficient for identifying different warriors and that the chosen AI methods surface meaningful patterns; without reported results or validation, the novelty of the scheme over conventional collection-level visualization cannot be assessed.
minor comments (2)
- [Abstract] Abstract: Typographical errors include missing spaces (e.g., '3D modeling,digital display technologies,and', 'heritage depictions and expanded opportunities for analysis.However,while').
- [Abstract] Abstract: The phrase 'various AI methods, such as generative adversarial network and random forest' is vague; the paper should specify the full pipeline, justify the selection of these two techniques, and clarify what other methods (if any) were employed.
Simulated Author's Rebuttal
We thank the referee for their thorough review and constructive feedback on our manuscript. We address the major comments below and will make revisions to strengthen the presentation of our contributions.
read point-by-point responses
-
Referee: [Abstract] Abstract: The manuscript states that GAN and random forest are used to optimize/augment the dataset and analyze attribute distributions/relationships, yet supplies no concrete attribute list, no augmentation metrics (e.g., fidelity or diversity scores), no feature-importance or clustering outputs from the random forest, no example visualizations, and no comparison against non-AI baselines such as histograms or pairwise plots. This absence makes it impossible to evaluate whether the claimed 'whole entity' insights are achieved or are load-bearing for the central contribution.
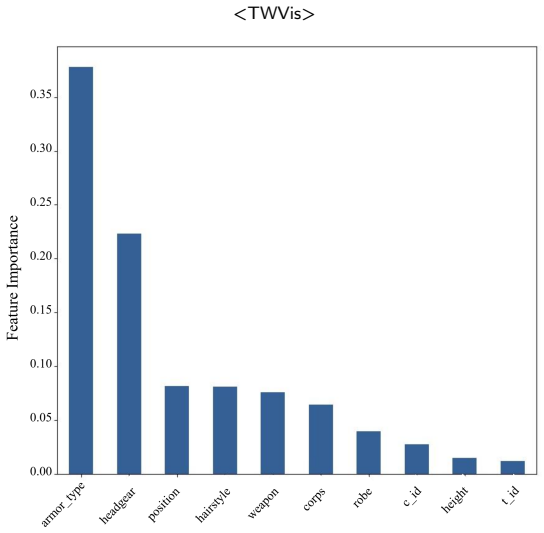
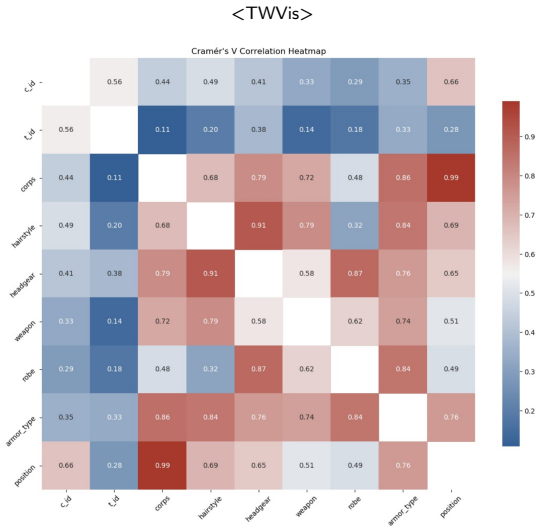
Authors: We agree that the abstract lacks these specific details, which are important for evaluating the work. In the revised version, we will update the abstract to include a summary of the key attributes in the dataset (such as physical measurements, armor styles, and facial features), report quantitative metrics for the GAN augmentation (including fidelity and diversity scores), include feature importance rankings from the random forest analysis, provide example visualizations, and add a brief comparison to traditional statistical visualizations to highlight the benefits of the AI approach. revision: yes
-
Referee: [Abstract] Abstract and contribution statement: The claim that the approach 'optimizes and augments the dataset' and 'reveals relationships' for an intuitive presentation rests on the unshown assumption that the constructed attributes are sufficient for identifying different warriors and that the chosen AI methods surface meaningful patterns; without reported results or validation, the novelty of the scheme over conventional collection-level visualization cannot be assessed.
Authors: The manuscript does provide some description of the attributes in the methods section, but we acknowledge that the abstract and contribution statement do not sufficiently detail the validation or results. We will revise the abstract and introduction to explicitly state the attributes used and how they enable identification of warriors. Additionally, we will include validation results, such as accuracy of the random forest in identifying patterns and examples of revealed relationships, to demonstrate the novelty over conventional methods. revision: yes
Circularity Check
No significant circularity; descriptive case study with no derivations
full rationale
The paper constructs a dataset of Terracotta Warriors attributes and applies standard off-the-shelf AI methods (GAN for augmentation, random forest for analysis) before visualization. No equations, predictions, or first-principles claims appear in the provided text. The central contribution is an empirical workflow rather than any derived result that could reduce to its inputs by construction. No self-citations, fitted parameters renamed as predictions, or uniqueness theorems are invoked. This is a normal non-circular application paper.
Axiom & Free-Parameter Ledger
Reference graph
Works this paper leans on
-
[1]
F. Bruno, S. Bruno, G. De Sensi, M.-L. Luchi, S. Mancuso, M. Muzzupappa, From 3d reconstruction to virtual reality: A complete methodology for digital archaeological exhibition, Journal of Cultural Heritage 11 (1) (2010) 42–49.doi:https: //doi.org/10.1016/j.culher.2009.02.006. URLhttps://www.sciencedirect.com/science/article/pii/ S1296207409000958
-
[2]
Scopigno, M
R. Scopigno, M. Callieri, P. Cignoni, M. Corsini, M. Dellepiane, F. Ponchio, G. Ranzuglia, 3d models for cultural heritage: Beyond plain visualization., Computer 44 (7) (2011) 48–55
2011
-
[3]
Zhang, W
L. Zhang, W. Qi, K. Zhao, L. Wang, X. Tan, L. Jiao, Vr games and thedisseminationofculturalheritage,in:N.Streitz,S.Konomi(Eds.), Distributed, Ambient and Pervasive Interactions: Understanding Hu- mans, Springer International Publishing, Cham, 2018, pp. 439–451
2018
-
[4]
Y. Ma, W. Li, N. An, Research on the digital exhibition of cultural relics for cross-culture communication: Case study on china-greece cooperation on terracotta warriors, ISPRS Annals of the Photogram- metry,RemoteSensingandSpatialInformationSciences(2023)187– 192
2023
-
[5]
C. Díaz-Marín, E. Vendrell-Vidal, E. Aura-Castro, A. F. Abate, C. Sánchez-Belenguer, F. Narducci, Virtual reconstruction and rep- resentation of an archaeological terracotta statue, in: 2015 Digital Heritage, Vol. 2, 2015, pp. 699–702.doi:10.1109/DigitalHeritage. 2015.7419602
-
[6]
F. Windhager, P. Federico, G. Schreder, K. Glinka, M. Dörk, S. Miksch, E. Mayr, Visualization of cultural heritage collection data: State of the art and future challenges, IEEE Transactions on VisualizationandComputerGraphics25(6)(2019)2311–2330.doi: 10.1109/TVCG.2018.2830759
-
[7]
Nickel, The first emperor and sculpture in china, Bulletin of the School of Oriental and African Studies 76 (3) (2013) 413–447
L. Nickel, The first emperor and sculpture in china, Bulletin of the School of Oriental and African Studies 76 (3) (2013) 413–447
2013
-
[8]
Towarek, L
A. Towarek, L. Halicz, S. Matwin, B. Wagner, Machine learning in analytical chemistry for cultural heritage: A comprehensive review, Journal of Cultural Heritage 70 (2024) 64–70
2024
-
[9]
3d digitizing of cultural heritage, Journal of Cultural Heritage 2 (1) (2001) 63–70.doi:https://doi.org/10.1016/S1296-2074(01)01108-6
-
[10]
Y. Hu, D. Lan, J. Wang, M. Hou, S. Li, X. Li, L. Zhu, Measurement and analysis of facial features of terracotta warriors based on high- precision 3d point clouds, Heritage Science 10 (1) (2022) 40
2022
-
[11]
D.Koller,B.Frischer,G.Humphreys,Researchchallengesfordigital archives of 3d cultural heritage models 2 (3) (2010).doi:10.1145/ 1658346.1658347. URLhttps://doi.org/10.1145/1658346.1658347 <Siyi Li et al.>:Preprint submitted to ElsevierPage 10 of 13 <TWVis>
-
[12]
Pavlidis, A
G. Pavlidis, A. Koutsoudis, F. Arnaoutoglou, V. Tsioukas, C. Chamzas, Methods for 3d digitization of cultural heritage, Journal of cultural heritage 8 (1) (2007) 93–98
2007
-
[13]
Y. Wang, X. Deng, K. Zhang, Y. Lang, The intangible cultural heritage show mode based on ar technology in museums - take the li nationality non-material cultural heritage as an example, in: 2018 IEEE 3rd International Conference on Image, Vision and Computing (ICIVC), 2018, pp. 936–940.doi:10.1109/ICIVC.2018.8492843
-
[14]
An integrated vr/ar framework for user-centric interactive experience of cultural heritage: The arkaevision project, Digital Applications in Archaeology and Cultural Heritage 15 (2019) e00124.doi:https: //doi.org/10.1016/j.daach.2019.e00124
-
[15]
Ruecker, M
S. Ruecker, M. Radzikowska, S. Sinclair, Visual interface design for digital cultural heritage: A guide to rich-prospect browsing, Ashgate Publishing, Ltd., 2011
2011
-
[16]
S. Bitgood, Museum fatigue: A critical review, Visitor Studies 12 (2) (2009) 93–111.doi:10.1080/10645570903203406
-
[17]
A. R. Shaikh, D. Koop, H. Alhoori, M. Sun, Toward systematic design considerations of organizing multiple views, in: 2022 IEEE Visualization and Visual Analytics (VIS), 2022, pp. 105–109.doi: 10.1109/VIS54862.2022.00030
-
[18]
Gleicher, D
M. Gleicher, D. Albers, R. Walker, I. Jusufi, C. D. Hansen, J. C. Roberts, Visual comparison for information visualization, Information Visualization 10 (4) (2011) 289–309.doi:10.1177/ 1473871611416549
2011
-
[19]
W. Javed, N. Elmqvist, Exploring the design space of composite visualization,in:2012IEEEPacificVisualizationSymposium,2012, pp. 1–8.doi:10.1109/PacificVis.2012.6183556
-
[21]
X. Liu, H.-W. Shen, The effects of representation and juxtaposition ongraphicalperceptionofmatrixvisualization,AssociationforCom- putingMachinery,NewYork,NY,USA,2015.doi:10.1145/2702123. 2702217. URLhttps://doi.org/10.1145/2702123.2702217
-
[23]
Z. Qu, J. Hullman, Keeping multiple views consistent: Constraints, validations,andexceptionsinvisualizationauthoring,IEEETransac- tionsonVisualizationandComputerGraphics24(1)(2018)468–477. doi:10.1109/TVCG.2017.2744198
-
[25]
I. Cho, W. Dou, D. X. Wang, E. Sauda, W. Ribarsky, Vairoma: A visual analytics system for making sense of places, times, and events in roman history, IEEE Transactions on Visualization and Computer Graphics 22 (1) (2016) 210–219.doi:10.1109/TVCG.2015.2467971
-
[26]
M. Wagner, D. Slijepcevic, B. Horsak, A. Rind, M. Zeppelzauer, W.Aigner,Kavagait:Knowledge-assistedvisualanalyticsforclinical gait analysis, IEEE Transactions on Visualization and Computer Graphics 25 (3) (2019) 1528–1542.doi:10.1109/TVCG.2017.2785271
-
[27]
D. Han, G. Parsad, H. Kim, J. Shim, O.-S. Kwon, K. A. Son, J. Lee, I. Cho, S. Ko, Hisva: A visual analytics system for studying history, IEEE Transactions on Visualization and Computer Graphics 28 (12) (2022) 4344–4359.doi:10.1109/TVCG.2021.3086414
-
[28]
Kruskal,J.M
J.B. Kruskal,J.M. Landwehr,Icicleplots: Betterdisplaysfor hierar- chical clustering, The American Statistician 37 (2) (1983) 162–168
1983
-
[29]
Johnson, B
B. Johnson, B. Shneiderman, Tree-maps: A space filling approach to the visualization of hierarchical information structures, Tech. rep. (1998)
1998
-
[30]
57–65.doi:10.1109/INFVIS.2000.885091
J.Stasko,E.Zhang,Focus+contextdisplayandnavigationtechniques for enhancing radial, space-filling hierarchy visualizations, in: IEEE SymposiumonInformationVisualization2000.INFOVIS2000.Pro- ceedings, 2000, pp. 57–65.doi:10.1109/INFVIS.2000.885091
-
[31]
K. Rodden, Applying a sunburst visualization to summarize user navigation sequences, IEEE Computer Graphics and Applications 34 (5) (2014) 36–40.doi:10.1109/MCG.2014.63
-
[32]
832–836.doi:10.1109/BMEI.2015.7401618
C.Liu,P.Wang,Asunburst-basedhierarchicalinformationvisualiza- tionmethodanditsapplicationinpublicopinionanalysis,in:20158th InternationalConferenceonBiomedicalEngineeringandInformatics (BMEI), 2015, pp. 832–836.doi:10.1109/BMEI.2015.7401618
-
[33]
N. Médoc, H. Bourgoin, P. Pinheiro, M. Ghoniem, Using a multi- level and multi-resolution visual analytics software to understand the aftermath of a catastrophe, in: 2019 IEEE Conference on Visual Analytics Science and Technology (VAST), 2019, pp. 138–139.doi: 10.1109/VAST47406.2019.8986957
-
[34]
S. Liu, D. Maljovec, B. Wang, P.-T. Bremer, V. Pascucci, Visualizing high-dimensional data: Advances in the past decade, IEEE Transac- tions on Visualization and Computer Graphics 23 (3) (2017) 1249– 1268.doi:10.1109/TVCG.2016.2640960
-
[35]
L.Zhou,D.Weiskopf,Multivariatevisualizationofparticledata,The European Physical Journal Special Topics 227 (2019) 1741–1755
2019
-
[36]
C. Nobre, N. Gehlenborg, H. Coon, A. Lex, Lineage: Visualizing multivariate clinical data in genealogy graphs, IEEE Transactions on Visualization and Computer Graphics 25 (3) (2019) 1543–1558. doi:10.1109/TVCG.2018.2811488
-
[37]
A. Inselberg, B. Dimsdale, Parallel coordinates: a tool for visualiz- ing multi-dimensional geometry, in: Proceedings of the First IEEE Conference on Visualization: Visualization ‘90, 1990, pp. 361–378. doi:10.1109/VISUAL.1990.146402
-
[38]
C. Viau, M. J. McGuffin, Y. Chiricota, I. Jurisica, The flowvizmenu and parallel scatterplot matrix: Hybrid multidimensional visualiza- tions for network exploration, IEEE Transactions on Visualization andComputerGraphics16(6)(2010)1100–1108.doi:10.1109/TVCG. 2010.205
-
[39]
A. Tyagi, T. Estro, G. Kuenning, E. Zadok, K. Mueller, Pc-expo: A metrics-based interactive axes reordering method for parallel coor- dinate displays, IEEE Transactions on Visualization and Computer Graphics 29 (1) (2023) 712–722.doi:10.1109/TVCG.2022.3209392
-
[40]
T.-L. Fung, J.-K. Chou, K.-L. Ma, A design study of personal biblio- graphic data visualization, in: 2016 IEEE Pacific Visualization Sym- posium (PacificVis), 2016, pp. 244–248.doi:10.1109/PACIFICVIS. 2016.7465279
-
[41]
A. Lex, M. Streit, E. Kruijff, D. Schmalstieg, Caleydo: Design and evaluation of a visual analysis framework for gene expression data in itsbiologicalcontext,in:2010IEEEPacificVisualizationSymposium (PacificVis), 2010, pp. 57–64.doi:10.1109/PACIFICVIS.2010.5429609
-
[42]
A. Lhuillier, C. Hurter, A. Telea, Ffteb: Edge bundling of huge graphs by the fast fourier transform, in: 2017 IEEE Pacific Visual- ization Symposium (PacificVis), 2017, pp. 190–199.doi:10.1109/ PACIFICVIS.2017.8031594
-
[43]
Q. W. Bouts, B. Speckmann, Clustered edge routing, in: 2015 IEEE PacificVisualizationSymposium(PacificVis),2015,pp.55–62.doi: 10.1109/PACIFICVIS.2015.7156356
-
[44]
J. Yoon, J. Jordon, M. Schaar, Gain: Missing data imputation using generative adversarial nets, in: International conference on machine learning, PMLR, 2018, pp. 5689–5698
2018
-
[45]
B. S. Van, H. C. Boshuizen, K. D. L, Multiple imputation of missing blood pressure covariates in survival analysis, Statistics in medicine 18 (6) (1999) 681–694
1999
-
[46]
D. T. Neves, M. G. Naik, A. Proença, Sgain, wsgain-cp and wsgain- gp: Novel gan methods for missing data imputation, in: International Conference on Computational Science, 2021, pp. 98–113
2021
-
[47]
T. N. Diogo, A. João, G. N. Marcel, J. P. Alberto, P. Fabian, From missingdataimputationtodatageneration,JournalofComputational Science 61 (2022) 101640
2022
-
[48]
<Siyi Li et al.>:Preprint submitted to ElsevierPage 11 of 13 <TWVis>
N.Park,M.Mohammadi,K.Gorde,S.Jajodia,H.Park,Y.Kim,Data synthesis based on generative adversarial networks, Proceedings of the VLDB Endowment (2018). <Siyi Li et al.>:Preprint submitted to ElsevierPage 11 of 13 <TWVis>
2018
-
[49]
N. V. Chawla, K. W. Bowyer, L. O. Hall, W. P. Kegelmeyer, Smote: syntheticminorityover-samplingtechnique,Journalofartificialintel- ligence research 16 (2002) 321–357
2002
-
[50]
Mohamed, E
E. Mohamed, E. Omar, A.-M. Somaya, T. Hamid, Image generation: A review, Neural Processing Letters 54 (5) (2022) 4609–4646
2022
-
[51]
Breiman, Random forests, Machine learning 45 (2001) 5–32
L. Breiman, Random forests, Machine learning 45 (2001) 5–32. <Siyi Li et al.>:Preprint submitted to ElsevierPage 12 of 13 <TWVis> Supplementary Materials Figure A1: The military formation in Pit No. 1. <Siyi Li et al.>:Preprint submitted to ElsevierPage 13 of 13
2001
discussion (0)
Sign in with ORCID, Apple, or X to comment. Anyone can read and Pith papers without signing in.