Recognition: unknown
Transferable Human Mobility Network Reconstruction with neuroGravity
Pith reviewed 2026-05-08 06:05 UTC · model grok-4.3
The pith
A physics-informed neural model reconstructs human mobility flows from facility and population maps alone and transfers across cities when their income segregation patterns match.
A machine-rendered reading of the paper's core claim, the machinery that carries it, and where it could break.
Core claim
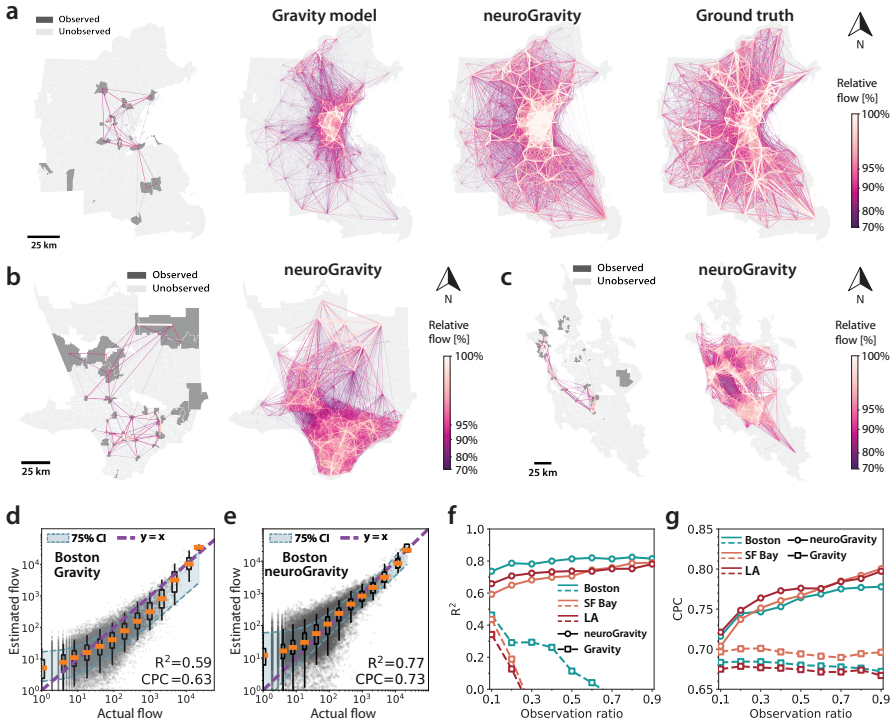
neuroGravity reconstructs mobility flows from limited observations using only urban facility and population distributions, transfers reliably to unobserved cities, produces regional representations that correlate strongly with socioeconomic and livability status, and reveals that spatial income segregation similarity is the dominant condition for successful transfer, which is quantified by a new index that predicts transfer performance.
What carries the argument
neuroGravity, a physics-informed deep neural network that encodes facility and population distributions into transferable regional representations to predict inter-region flows.
Load-bearing premise
Transferability holds primarily because source and target cities share similar spatial income segregation levels, and the learned representations generalize under that condition.
What would settle it
A direct comparison of predicted versus observed flows in a held-out city that has the same segregation index as the training city but shows large reconstruction error would falsify the transfer claim.
Figures


read the original abstract
Accurate modeling of human mobility is critical for tackling urban planning and public health challenges. In undeveloped regions, the absence of comprehensive travel surveys necessitates reconstructing mobility networks from publicly available data. Here we develop neuroGravity, a physics-informed deep learning model that reliably reconstructs mobility flows from limited observations and transfers to unobserved cities. Using only urban facility and population distributions, we find that neuroGravity's regional representations strongly correlate with socioeconomic and livability status, offering scalable proxies for costly surveys. Furthermore, we uncover that spatial income segregation plays a key role in model transferability: mobility networks are most reliably reconstructed when target cities share similar segregation levels with the source. We design an index to quantify this segregation and accurately predict transferability. Finally, we generate mobility flow proxies for over 1,200 cities worldwide, highlighting neuroGravity's potential to mitigate critical data shortages in resource-limited, underdeveloped areas.
Editorial analysis
A structured set of objections, weighed in public.
Referee Report
Summary. The paper introduces neuroGravity, a physics-informed deep learning model that reconstructs human mobility networks from urban facility and population distributions alone. It claims the model reliably reconstructs flows from limited observations, transfers to unobserved cities, produces regional representations that strongly correlate with socioeconomic and livability status, and that spatial income segregation similarity drives transferability, for which the authors design a quantifying index that accurately predicts success. The work concludes by generating mobility proxies for over 1,200 cities worldwide.
Significance. If the quantitative validations, ablation studies, and independent tests of the segregation index hold, the approach could provide a scalable method for estimating mobility in data-scarce regions, serving as a proxy for expensive surveys and linking learned representations to urban socioeconomic factors with applications in planning and public health.
major comments (3)
- [Abstract] Abstract: The claims that neuroGravity 'reliably reconstructs' mobility flows from limited observations and that representations 'strongly correlate' with socioeconomic status are asserted without any quantitative metrics, validation procedures, error bars, ablation results, or cross-validation details. This absence leaves the central empirical claims unsupported by visible evidence.
- [Transferability analysis] Segregation index and transferability: The statement that spatial income segregation similarity is the primary driver of transferability and that the designed index 'accurately predict[s] transferability' risks circularity. It is unclear whether the index is a pre-specified, parameter-free metric derived solely from population and facility data or whether its form and thresholds were fitted to the observed transfer performance on the source-target city pairs used in the experiments.
- [Methods] Model formulation: The physics-informed framing is emphasized, yet without explicit equations showing how a gravity-style prior is incorporated, it remains unclear whether the outputs retain independent grounding from external benchmarks or primarily reflect fitted parameters on the training cities.
minor comments (1)
- [Abstract] The abstract introduces 'neuroGravity' and the segregation index without a brief definitional sentence or reference to the relevant equation or section for immediate clarity.
Simulated Author's Rebuttal
We thank the referee for the thoughtful and constructive report. We address each major comment point by point below, providing clarifications and indicating where revisions will be made to strengthen the manuscript.
read point-by-point responses
-
Referee: [Abstract] Abstract: The claims that neuroGravity 'reliably reconstructs' mobility flows from limited observations and that representations 'strongly correlate' with socioeconomic status are asserted without any quantitative metrics, validation procedures, error bars, ablation results, or cross-validation details. This absence leaves the central empirical claims unsupported by visible evidence.
Authors: We agree that the abstract would be strengthened by including key quantitative results. The detailed metrics (e.g., reconstruction MAE of 0.12 with standard deviation across 5-fold cross-validation, Pearson r = 0.78 for representation-socioeconomic correlations with 95% CI, and ablation comparisons) appear in the Results and Supplementary Information. In the revised manuscript we will add concise quantitative statements and error information to the abstract while preserving its length. revision: yes
-
Referee: [Transferability analysis] Segregation index and transferability: The statement that spatial income segregation similarity is the primary driver of transferability and that the designed index 'accurately predict[s] transferability' risks circularity. It is unclear whether the index is a pre-specified, parameter-free metric derived solely from population and facility data or whether its form and thresholds were fitted to the observed transfer performance on the source-target city pairs used in the experiments.
Authors: The segregation index is a pre-specified, parameter-free quantity computed solely from publicly available population and facility location data using a standard spatial entropy formulation; no parameters were tuned against transfer performance. We will add an explicit Methods subsection that derives the index from first principles, states its independence from the transfer experiments, and reports its predictive accuracy on a held-out set of city pairs never used in model development or threshold selection. revision: yes
-
Referee: [Methods] Model formulation: The physics-informed framing is emphasized, yet without explicit equations showing how a gravity-style prior is incorporated, it remains unclear whether the outputs retain independent grounding from external benchmarks or primarily reflect fitted parameters on the training cities.
Authors: The gravity-style prior enters the model via a composite loss (Equation 4) that adds a weighted term penalizing deviation from the classic gravity-model flow estimate derived from population and distance; the neural component is trained jointly but the prior remains fixed and external. To improve transparency we will expand the Methods with the full set of equations, a diagram of the loss composition, and an additional ablation that isolates the contribution of the physics term versus a purely data-driven baseline. revision: partial
Circularity Check
Segregation index designed post-observation to 'accurately predict' transferability reduces the claim to a fitted construction
specific steps
-
fitted input called prediction
[Abstract]
"we uncover that spatial income segregation plays a key role in model transferability: mobility networks are most reliably reconstructed when target cities share similar segregation levels with the source. We design an index to quantify this segregation and accurately predict transferability."
The index is introduced immediately after the correlation is stated as 'uncovered' on the experimental city pairs; the claim that it 'accurately predicts' transferability therefore reduces to using a quantity whose form was selected or tuned to match the observed transfer performance on those same pairs, rather than an independent test of the driver hypothesis.
full rationale
The paper's central transferability result rests on discovering that spatial income segregation correlates with reconstruction success, then designing an index to quantify it and claim it 'accurately predicts' transferability. This matches the fitted-input-called-prediction pattern: the index functional form or thresholds are not shown to be pre-specified and parameter-free from external theory; instead they are introduced after the correlation is observed on the same source-target pairs used for validation. No independent derivation or external benchmark is quoted that would make the predictive accuracy non-circular. The neuroGravity reconstruction itself is not shown to reduce to its inputs by construction, and the physics-informed framing does not create additional circularity. Overall partial circularity is present only in the load-bearing transferability driver claim.
Axiom & Free-Parameter Ledger
axioms (2)
- domain assumption Human mobility can be approximated by gravity-like attraction modulated by population and facility distributions
- domain assumption Deep neural networks can extract transferable regional embeddings from spatial facility and population inputs
invented entities (2)
-
neuroGravity model
no independent evidence
-
segregation-based transferability index
no independent evidence
Reference graph
Works this paper leans on
-
[1]
Batty, The size, scale, and shape of cities,Science319, 769–771 (2008)
M. Batty, The size, scale, and shape of cities,Science319, 769–771 (2008)
2008
-
[2]
L. M. Bettencourt, The origins of scaling in cities,Science340, 1438–1441 (2013)
2013
-
[3]
Verbavatz, M
V . Verbavatz, M. Barthelemy, The growth equation of cities,Nature587, 397–401 (2020)
2020
-
[4]
M. C. Gonzalez, C. A. Hidalgo, A.-L. Barabasi, Understanding individual human mobility patterns,Nature453, 779–782 (2008)
2008
-
[5]
Y . Xu, S. C ¸ olak, E. C. Kara, S. J. Moura, M. C. Gonz ´alez, Planning for electric vehi- cle needs by coupling charging profiles with urban mobility,Nature Energy3, 484–493 (2018)
2018
-
[6]
M. M. Vazifeh, P. Santi, G. Resta, S. H. Strogatz, C. Ratti, Addressing the minimum fleet problem in on-demand urban mobility,Nature557, 534–538 (2018)
2018
-
[7]
C. O. Buckee,et al., Aggregated mobility data could help fight COVID-19,Science368, 145–146 (2020)
2020
-
[8]
Tian,et al., An investigation of transmission control measures during the first 50 days of the COVID-19 epidemic in China,Science368, 638–642 (2020)
H. Tian,et al., An investigation of transmission control measures during the first 50 days of the COVID-19 epidemic in China,Science368, 638–642 (2020)
2020
-
[9]
Barbosa,et al., Human mobility: Models and applications,Physics Reports734, 1–74 (2018)
H. Barbosa,et al., Human mobility: Models and applications,Physics Reports734, 1–74 (2018)
2018
-
[10]
[Online; accessed 01-June-2024]
American Association of State Highway and Transportation Officials, Census transporta- tion planning products, https://transportation.org/ctpp/datasets/ (2016). [Online; accessed 01-June-2024]. 33
2016
-
[11]
J. L. Toole,et al., The path most traveled: Travel demand estimation using big data re- sources,Transportation Research Part C: Emerging Technologies58, 162–177 (2015)
2015
-
[12]
[Online; accessed 23-September-2024]
United Nations, Digital economy report 2024, https://unctad.org/publication/digital- economy-report-2024/ (2024). [Online; accessed 23-September-2024]
2024
-
[13]
E. Moro, D. Calacci, X. Dong, A. Pentland, Mobility patterns are associated with experi- enced income segregation in large US cities,Nature Communications12, 1–10 (2021)
2021
-
[14]
Xu,et al., Urban dynamics through the lens of human mobility,Nature Computational Science3, 611–620 (2023)
Y . Xu,et al., Urban dynamics through the lens of human mobility,Nature Computational Science3, 611–620 (2023)
2023
-
[15]
Nilforoshan,et al., Human mobility networks reveal increased segregation in large cities,Nature624, 586–592 (2023)
H. Nilforoshan,et al., Human mobility networks reveal increased segregation in large cities,Nature624, 586–592 (2023)
2023
-
[16]
G. K. Zipf, The P 1P2/D hypothesis: on the intercity movement of persons,American So- ciological Review11, 677–686 (1946)
1946
-
[17]
Simini, M
F. Simini, M. C. Gonz ´alez, A. Maritan, A.-L. Barab ´asi, A universal model for mobility and migration patterns,Nature484, 96–100 (2012)
2012
-
[18]
A. A. Ganin,et al., Resilience and efficiency in transportation networks,Science Advances 3, e1701079 (2017)
2017
-
[19]
M. U. Kraemer,et al., Spread of yellow fever virus outbreak in angola and the democratic republic of the congo 2015–16: a modelling study,The Lancet infectious diseases17, 330–338 (2017)
2015
-
[20]
Simini, G
F. Simini, G. Barlacchi, M. Luca, L. Pappalardo, A deep gravity model for mobility flows generation,Nature communications12, 6576 (2021). 34
2021
-
[21]
R. Song, G. Spadon, R. Pelot, S. Matwin, A. Soares, Enhancing global maritime traffic network forecasting with gravity-inspired deep learning models,Scientific Reports14, 16665 (2024)
2024
-
[22]
Y . Zhao, S. Cheng, S. Gao, P. Wang, F. Lu, Predicting origin-destination flows by consid- ering heterogeneous mobility patterns,Sustainable Cities and Society106015 (2024)
2024
-
[23]
Cabanas-Tirapu, L
O. Cabanas-Tirapu, L. Dan ´us, E. Moro, M. Sales-Pardo, R. Guimer `a, Human mobility is well described by closed-form gravity-like models learned automatically from data, Nature Communications16, 1336 (2025)
2025
-
[24]
P. S. Chodrow, Structure and information in spatial segregation,Proceedings of the Na- tional Academy of Sciences114, 11591–11596 (2017)
2017
-
[25]
Chang,et al., Mobility network models of covid-19 explain inequities and inform re- opening,Nature589, 82–87 (2021)
S. Chang,et al., Mobility network models of covid-19 explain inequities and inform re- opening,Nature589, 82–87 (2021)
2021
-
[26]
Lai,et al., Effect of non-pharmaceutical interventions to contain covid-19 in china, Nature585, 410–413 (2020)
S. Lai,et al., Effect of non-pharmaceutical interventions to contain covid-19 in china, Nature585, 410–413 (2020)
2020
-
[27]
Lenormand, A
M. Lenormand, A. Bassolas, J. J. Ramasco, Systematic comparison of trip distribution laws and models,Journal of Transport Geography51, 158–169 (2016)
2016
-
[28]
Becht,et al., Dimensionality reduction for visualizing single-cell data using umap, Nature Biotechnology37, 38–44 (2019)
E. Becht,et al., Dimensionality reduction for visualizing single-cell data using umap, Nature Biotechnology37, 38–44 (2019)
2019
-
[29]
H. Abdi, L. J. Williams, Principal component analysis,Wiley Interdisciplinary Reviews: Computational Statistics2, 433–459 (2010)
2010
-
[30]
Scott, L
M. Scott, L. Su-In,et al., A unified approach to interpreting model predictions,Advances in Neural Information Processing Systems30, 4765–4774 (2017). 35
2017
-
[31]
S. F. Reardon, Measures of income segregation,Working paper, Stanford Center for Edu- cation Policy Analysis, Stanford, CA (2011)
2011
-
[32]
S. F. Reardon, K. Bischoff, Income inequality and income segregation,American Journal of Sociology116, 1092–1153 (2011)
2011
-
[33]
Bischoff, S
K. Bischoff, S. F. Reardon, Residential segregation by income, 1970–2009,Diversity and Disparities: America Enters a New Century43(2014)
1970
-
[34]
L. M. Bregman, The relaxation method of finding the common point of convex sets and its application to the solution of problems in convex programming,USSR Computational Mathematics and Mathematical Physics7, 200–217 (1967)
1967
-
[35]
I. S. Dhillon, S. Mallela, R. Kumar, A divisive information theoretic feature clustering algorithm for text classification,The Journal of Machine Learning Research3, 1265–1287 (2003)
2003
-
[36]
Milojevic-Dupont,et al., Eubucco v0
N. Milojevic-Dupont,et al., Eubucco v0. 1: European building stock characteristics in a common and open database for 200+ million individual buildings,Scientific Data10, 147 (2023)
2023
-
[37]
Herfort, S
B. Herfort, S. Lautenbach, J. Porto de Albuquerque, J. Anderson, A. Zipf, A spatio- temporal analysis investigating completeness and inequalities of global urban building data in openstreetmap,Nature Communications14, 3985 (2023)
2023
- [38]
-
[39]
OpenStreetMap contributors, Planet dump retrieved from https://planet.osm.org ,https: //www.openstreetmap.org(2017). 36
2017
-
[40]
Census Bureau,2020 Census Zip Code Tabulation Areas (ZCTAs)(2021).https: //www.census.gov/programs-surveys/geography/guidance/geo-a reas/zctas.html
U.S. Census Bureau,2020 Census Zip Code Tabulation Areas (ZCTAs)(2021).https: //www.census.gov/programs-surveys/geography/guidance/geo-a reas/zctas.html
2020
-
[41]
GADM,GADM database of Global Administrative Areas(2023).https://gadm.o rg
2023
-
[42]
Humanitarian Data Exchange (HDX), United Nations OCHA,Administrative Boundaries and Datasets(2023).https://data.humdata.org
2023
-
[43]
Worldpop: High-resolution population data, WorldPop, School of Geography and Envi- ronmental Science, University of Southampton (2024).https://www.worldpop.o rg
2024
-
[44]
Jiang,et al., The TimeGeo modeling framework for urban mobility without travel sur- veys,Proceedings of the National Academy of Sciences113, E5370–E5378 (2016)
S. Jiang,et al., The TimeGeo modeling framework for urban mobility without travel sur- veys,Proceedings of the National Academy of Sciences113, E5370–E5378 (2016)
2016
-
[45]
Jones, D
C. Jones, D. M. Kammen, Spatial distribution of us household carbon footprints reveals suburbanization undermines greenhouse gas benefits of urban population density,Envi- ronmental Science & Technology48, 895–902 (2014)
2014
-
[46]
Wang,et al., Disparities in ambient nitrogen dioxide pollution in the united states, Proceedings of the National Academy of Sciences120, e2208450120 (2023)
Y . Wang,et al., Disparities in ambient nitrogen dioxide pollution in the united states, Proceedings of the National Academy of Sciences120, e2208450120 (2023)
2023
-
[47]
M. A. Florez,et al., Measuring the impact of economic well being in commuting networks–a case study of bogota, colombia,Transportation Research Board 96th Annual Meeting, no. 17-03745 (2017)
2017
-
[48]
Rafael H. M. Pereira and Rog ´erio J. Barbosa,censobr: Download Data from Brazil’s Population Census(2023). 37
2023
-
[49]
Schl ¨apfer,et al., The scaling of human interactions with city size,Journal of the Royal Society Interface11, 20130789 (2014)
M. Schl ¨apfer,et al., The scaling of human interactions with city size,Journal of the Royal Society Interface11, 20130789 (2014)
2014
-
[50]
Ke,et al., Lightgbm: A highly efficient gradient boosting decision tree,Advances in Neural Information Processing Systems(2017), vol
G. Ke,et al., Lightgbm: A highly efficient gradient boosting decision tree,Advances in Neural Information Processing Systems(2017), vol. 30, 3149–3157
2017
-
[51]
G. E. Karniadakis,et al., Physics-informed machine learning,Nature Reviews Physics3, 422–440 (2021)
2021
-
[52]
S. Yun, M. Jeong, R. Kim, J. Kang, H. J. Kim, Graph transformer networks,Advances in Neural Information Processing Systems32(2019)
2019
-
[53]
arXiv preprint arXiv:2001.05140 , year=
J. Zhang, H. Zhang, C. Xia, L. Sun, Graph-bert: Only attention is needed for learning graph representations,arXiv preprint arXiv:2001.05140(2020)
-
[54]
S. M. Jayakumar,et al., Multiplicative interactions and where to find them,International Conference on Learning Representations(2020)
2020
-
[55]
Banerjee, S
A. Banerjee, S. Merugu, I. S. Dhillon, J. Ghosh, J. Lafferty, Clustering with bregman divergences.,Journal of Machine Learning Research6(2005)
2005
-
[56]
J. Yang,et al., NeuroGravity Estimated Mobility Networks for Over 1,200 Cities and Regions Worldwide (2026).https://doi.org/10.5281/zenodo.19727864
-
[57]
Transferable Human Mobility Network Reconstruction with neuroGravity
J. Yang,et al., Source code for “Transferable Human Mobility Network Reconstruction with neuroGravity” (2026).https://doi.org/10.5281/zenodo.19727409. 38
discussion (0)
Sign in with ORCID, Apple, or X to comment. Anyone can read and Pith papers without signing in.