Recognition: unknown
Sparse Reduced-rank Regression Methods for Spatially Misaligned Data with Application to Spatial Transcriptomics
Pith reviewed 2026-05-08 04:49 UTC · model grok-4.3
The pith
A kernel-weighted regression with sparse low-rank factorization models plaque size from neighboring cells' transcriptomics while handling spatial misalignment.
A machine-rendered reading of the paper's core claim, the machinery that carries it, and where it could break.
Core claim
The authors develop a kernel-weighted regression framework that models plaque size as a collective effect of the spatial transcriptomics of neighboring cells, automatically integrating across cell types and tissue samples from different disease states, and incorporate a sparse low-rank factorization that enables gene selection while borrowing strength across genes, cell types, and time points, implemented in a fully automated manner with data-driven specification of key model components.
What carries the argument
Kernel-weighted regression model combined with sparse reduced-rank factorization, where kernels assign weights to neighboring cells' gene expressions based on spatial proximity and the factorization enforces sparsity and shared patterns across dimensions.
If this is right
- The framework integrates data from multiple cell types and disease states into a single model without requiring separate analyses.
- Gene selection occurs automatically while information is borrowed across genes and time points to improve stability.
- Simulation results indicate the method maintains good performance even when model specifications vary.
- Application to Alzheimer disease data identifies biologically meaningful gene-plaque associations.
Where Pith is reading between the lines
- The same kernel-plus-low-rank structure could be tested on other spatial omics datasets where misalignment arises from different imaging modalities.
- If the low-rank assumption holds more broadly, the approach might reduce computational burden in high-dimensional spatial analyses beyond transcriptomics.
- Extending the kernels to include temporal information could allow modeling of disease progression trajectories directly from the data.
Load-bearing premise
The chosen kernels correctly capture the true spatial influence of neighboring cells on plaque size, and the low-rank structure accurately reflects shared patterns across genes, cell types, and time points without introducing bias from unmodeled factors.
What would settle it
Generate simulated data where plaque size depends on cell transcriptomics according to a known but non-kernel spatial decay function, then check whether the method recovers the true associations or selects the correct genes at rates no better than unweighted regression.
Figures

read the original abstract
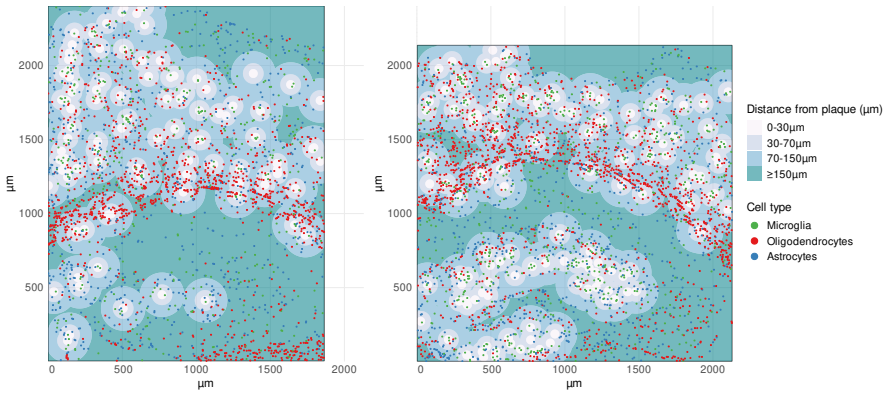
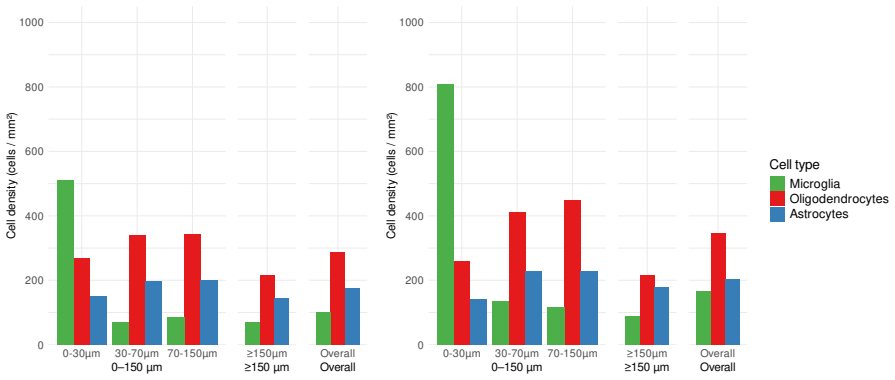
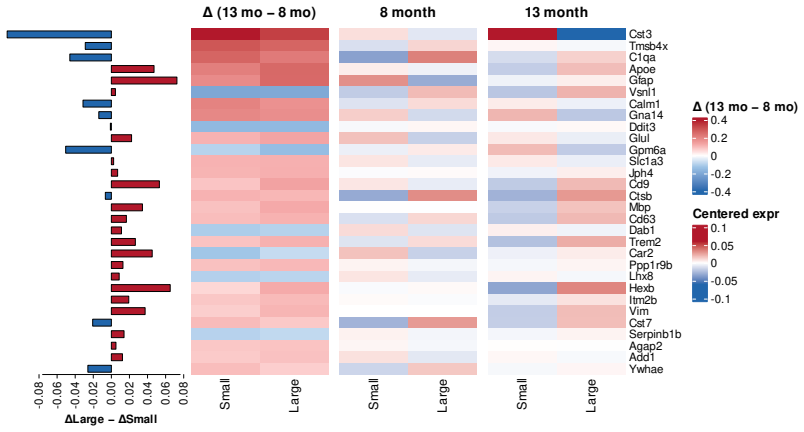
Understanding the spatiotemporal dynamics of disease progression in relation to transcriptomic profiles provides key insights into complex conditions such as Alzheimer disease. To enable such investigations, STARmap PLUS technology offers joint profiling of high-resolution spatial transcriptomics and protein detection within the same tissue section. Motivated by data from Zeng et al. (2023), we develop a novel kernel-weighted regression framework that models plaque size as a collective effect of the spatial transcriptomics of neighboring cells, automatically integrating across cell types and tissue samples from different disease states. To further strengthen interpretability and efficiency, we incorporate a sparse low-rank factorization that enables gene selection while borrowing strength across genes, cell types, and time points. The proposed approach is implemented in a fully automated manner with data-driven specification of key model components. Through simulation studies, we demonstrate the robustness of the proposed method and its superiority across a range of specification scenarios. Applied to Alzheimer disease data, the proposed framework uncovers biologically meaningful associations, highlighting its potential for advancing the understanding of disease mechanisms.
Editorial analysis
A structured set of objections, weighed in public.
Referee Report
Summary. The manuscript develops a kernel-weighted reduced-rank regression framework with sparse low-rank factorization to model plaque size as a collective effect of neighboring cells' spatial transcriptomics in Alzheimer disease data from STARmap PLUS technology. The approach automatically integrates across cell types and samples from different disease states, enables gene selection while borrowing strength across genes/cell types/time points, and is implemented in a fully automated, data-driven manner. Simulations demonstrate robustness and superiority over alternatives under various specification scenarios, while the real-data application uncovers biologically meaningful associations.
Significance. If the kernel weighting and sparse factorization assumptions hold, the method offers a valuable tool for handling spatially misaligned high-dimensional transcriptomics data, enabling interpretable integration across heterogeneous samples and cell types. Strengths include the automated specification, simulation-based validation of robustness, and focus on biological interpretability for disease mechanism studies in Alzheimer disease.
major comments (1)
- [Application to Alzheimer disease data] Application section: The claim that the framework uncovers biologically meaningful associations in the Alzheimer data depends on the kernel-weighted regression accurately capturing true spatial influences without systematic bias from misalignment or unmodeled factors. However, while simulations test robustness under controlled misspecification, the real-data analysis provides no explicit sensitivity checks on kernel form, bandwidth selection, or comparisons to alternative spatial weighting schemes. This is load-bearing for the central claim, as any bias in the weighting would propagate directly into the sparse low-rank estimates and gene selections.
Simulated Author's Rebuttal
We thank the referee for their constructive and insightful comments on our manuscript. We have carefully addressed the major comment regarding the real-data application and provide our response below. We have revised the manuscript to incorporate additional analyses as detailed in our point-by-point reply.
read point-by-point responses
-
Referee: [Application to Alzheimer disease data] Application section: The claim that the framework uncovers biologically meaningful associations in the Alzheimer data depends on the kernel-weighted regression accurately capturing true spatial influences without systematic bias from misalignment or unmodeled factors. However, while simulations test robustness under controlled misspecification, the real-data analysis provides no explicit sensitivity checks on kernel form, bandwidth selection, or comparisons to alternative spatial weighting schemes. This is load-bearing for the central claim, as any bias in the weighting would propagate directly into the sparse low-rank estimates and gene selections.
Authors: We agree that explicit sensitivity checks would further strengthen the real-data claims. In the revised manuscript, we have added Section 5.3 and new Supplementary Figures S8–S10 that report results under alternative kernel functions (Gaussian, Epanechnikov, triangular), bandwidth multipliers (0.5×, 1×, and 2× the data-driven bandwidth), and alternative weighting schemes (k-nearest-neighbor and inverse-distance weighting). The selected genes, low-rank factors, and biological interpretations remain stable across these specifications, indicating that the primary findings are not driven by a particular choice of kernel or bandwidth. These additions directly mitigate the concern about potential propagation of weighting bias into the sparse estimates. revision: yes
Circularity Check
No significant circularity; derivation is self-contained on standard statistical components
full rationale
The paper proposes a kernel-weighted regression model augmented by sparse low-rank factorization for handling spatially misaligned transcriptomics data. All core elements (kernel weighting, reduced-rank structure, sparsity penalties, and data-driven tuning) are introduced as modeling choices with explicit estimation procedures, not as quantities derived from or fitted directly to the target outputs by construction. Simulations test performance under varied conditions, and the Alzheimer application reports discovered associations rather than tautological recovery of inputs. No self-definitional steps, fitted-input predictions, or load-bearing self-citations appear in the provided description or abstract; the framework remains externally falsifiable via alternative spatial models or kernel specifications.
Axiom & Free-Parameter Ledger
Reference graph
Works this paper leans on
-
[1]
Alexeeff, S. E., Carroll, R. J. and Coull, B. (2016), ‘Spatial measurement error and correction by spatial simex in linear regression models when using predicted air pollution exposures’, Biostatistics17(2), 377–389. 29 Anandkumar, A., Ge, R. and Janzamin, M. (2015), ‘Guaranteed Non-Orthogonal Tensor Decomposition via Alternating Rank-1Updates’. arXiv:140...
-
[2]
Eckart-Young
Bassiouni, R., Idowu, M. O., Gibbs, L. D., Robila, V., Grizzard, P. J., Webb, M. G. et al. (2023), ‘Spatial transcriptomic analysis of a diverse patient cohort reveals a conserved architecture in triple-negative breast cancer’,Cancer research83(1), 34–48. Berrocal, V. J., Gelfand, A. E. and Holland, D. M. (2010), ‘A spatio-temporal downscaler for output f...
2023
-
[3]
explanatory
Chen, W.-T., Lu, A., Craessaerts, K., Pavie, B., Sala Frigerio, C., Corthout, N. et al. (2020), ‘Spatial Transcriptomics and In Situ Sequencing to Study Alzheimer’s Disease’,Cell 30 182(4), 976–991.e19. De Strooper, B. and Karran, E. (2016), ‘The cellular phase of alzheimer’s disease’,Cell 164(4), 603–615. Deczkowska, A., Keren-Shaul, H., Weiner, A., Colo...
2020
-
[4]
Keren-Shaul, H., Spinrad, A., Weiner, A., Matcovitch-Natan, O., Dvir-Szternfeld, R., Ulland, T. K. et al. (2017), ‘A unique microglia type associated with restricting development of alzheimer’s disease’,Cell169(7), 1276–1290.e17. Kiers, H. A. L. (2000), ‘Towards a standardized notation and terminology in multiway analysis’,Journal of Chemometrics14(3), 10...
2017
-
[5]
M., Das, S., Rahimzadeh, N., Shabestari, S
Miyoshi, E., Morabito, S., Henningfield, C. M., Das, S., Rahimzadeh, N., Shabestari, S. K. et al. (2024), ‘Spatial and single-nucleus transcriptomic analysis of genetic and sporadic forms of alzheimer’s disease’,Nature Genetics56(12), 2704–2717. Nadaraya, E. A. (1964), ‘On estimating regression’,Theory of Probability & Its Applications 9(1), 141–142. Nasr...
2024
-
[6]
B., Arkin, L
Ni, Z., Prasad, A., Chen, S., Halberg, R. B., Arkin, L. M., Drolet, B. A. et al. (2022), ‘Spot- 33 clean adjusts for spot swapping in spatial transcriptomics data’,Nature Communications 13(1),
2022
-
[7]
M., Li, Z., Kang, W., Wolf, L
Oshan, T. M., Li, Z., Kang, W., Wolf, L. J. and Fotheringham, A. S. (2019), ‘mgwr: A python implementation of multiscale geographically weighted regression for investigating process spatial heterogeneity and scale’,ISPRS International Journal of Geo-Information 8(6),
2019
-
[8]
kneedle
Ribeiro Jr, P. J. and Diggle, P. J. (2025),geoR: Analysis of Geostatistical Data. R package version 1.9-6. Satopaa, V., Albrecht, J., Irwin, D. and Raghavan, B. (2011), Finding a" kneedle" in a haystack: Detecting knee points in system behavior,in‘2011 31st international conference on distributed computing systems workshops’, IEEE, pp. 166–171. Shah, S., ...
2025
-
[9]
J., Dejanovic, B., Zhou, Y
Zeng, H., Huang, J., Zhou, H., Meilandt, W. J., Dejanovic, B., Zhou, Y. et al. (2023), ‘Integrative in situ mapping of single-cell transcriptional states and tissue histopathology in a mouse model of Alzheimer’s disease’,Nature Neuroscience. Zhu, J., Shang, L. and Zhou, X. (2023), ‘Srtsim: spatial pattern preserving simulations for spatially resolved tran...
2023
discussion (0)
Sign in with ORCID, Apple, or X to comment. Anyone can read and Pith papers without signing in.