Recognition: unknown
Assessing Y-Axis Influence: Bias in Multimodal Language Models on Chart-to-Table Translation
Pith reviewed 2026-05-08 03:20 UTC · model grok-4.3
The pith
Y-axis variations in tick length, count, range and format introduce significant biases in multimodal models translating charts to tables.
A machine-rendered reading of the paper's core claim, the machinery that carries it, and where it could break.
Core claim
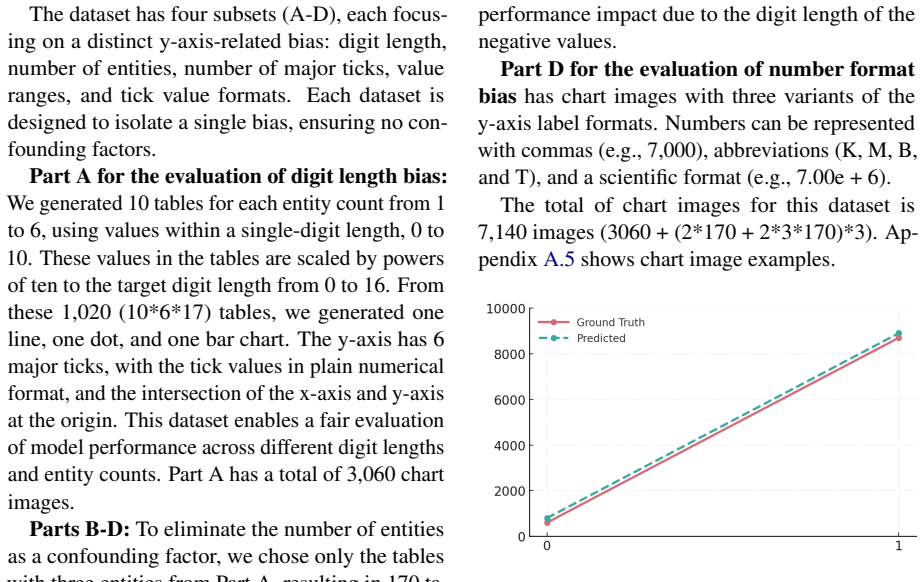
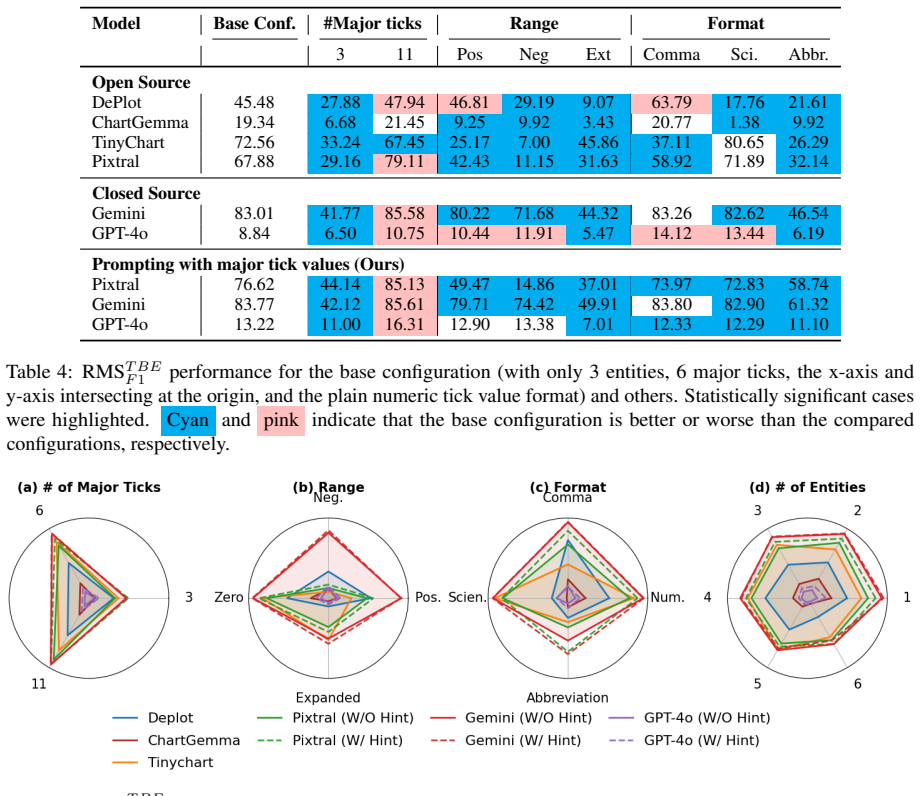
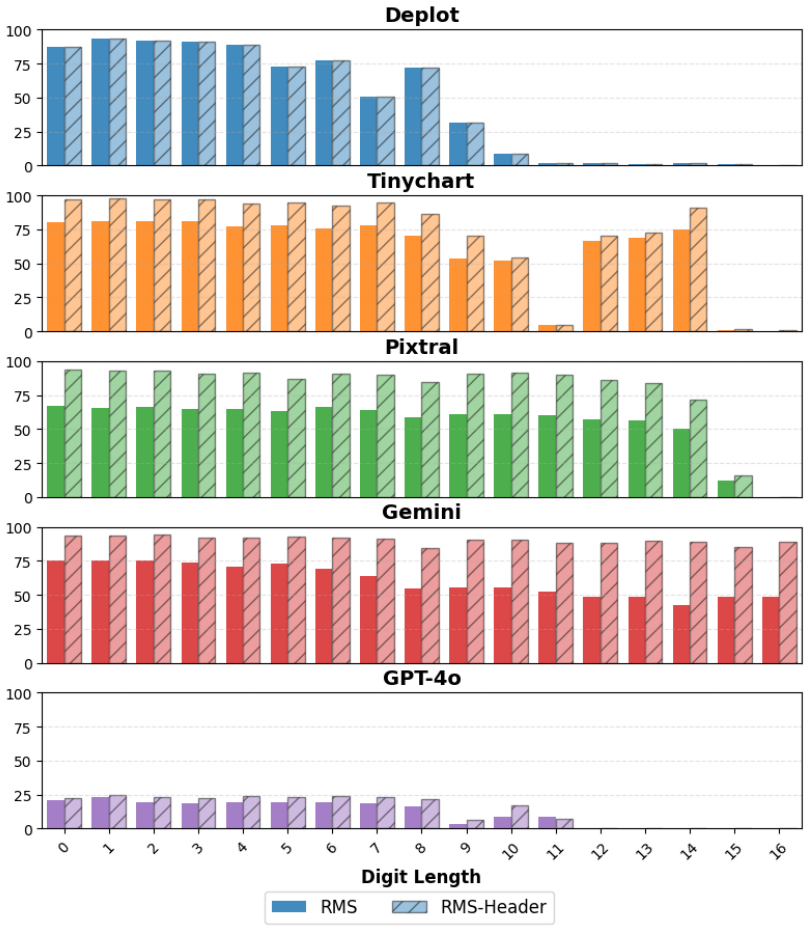
Y-axis information creates measurable biases during chart-to-table translation by multimodal language models, with accuracy varying systematically according to the digit length of major tick values, the number of major ticks, the value range, and the tick value format, as shown by systematic testing in the FairChart2Table framework.
What carries the argument
FairChart2Table, a framework that generates controlled variations of chart images to isolate y-axis properties and quantify their impact on model translation accuracy.
Load-bearing premise
That the performance differences across y-axis changes arise mainly from imbalances in public chart datasets rather than from model architectures or other training and evaluation factors.
What would settle it
Retrain one of the tested models on a version of the data where y-axis digit lengths, tick counts, ranges, and formats are balanced, then check whether the accuracy gaps for those features disappear.
Figures


read the original abstract
Chart-to-table translation converts chart images into structured tabular data. Accurate translation is crucial for Multimodal Language Model (MLM) to answer complex queries. We observe imbalances in the number of images across different aspects of the y-axis information in public chart datasets. Such imbalances can introduce unintended biases, causing uneven MLM performance. Previous works have not systematically examined these biases. To address this gap, we propose a new framework, FairChart2Table, for analyzing y-axis-related bias on five state-of-the-art models. Key Findings: (1) There are significant y-axis biases related to the digit length of the major tick values, the number of major ticks, the range of values, and the tick value format (e.g., abbreviation or scientific format). (2) The number of legends/entities in chart images impacts MLM performance. (3) Prompting MLM with y-axis information can significantly enhance the performance for some MLMs.
Editorial analysis
A structured set of objections, weighed in public.
Referee Report
Summary. The paper claims that public chart datasets exhibit imbalances in y-axis information (digit length of major ticks, number of major ticks, value ranges, and tick formats), which introduce biases in multimodal language models (MLMs) performing chart-to-table translation. It introduces the FairChart2Table framework to systematically evaluate these biases across five state-of-the-art MLMs, additionally reporting that the number of legends/entities affects performance and that y-axis-aware prompting improves results for some models.
Significance. If the central empirical claims hold after addressing controls, the work is significant for surfacing actionable biases in MLMs for visual data extraction, a growing application area. The FairChart2Table framework provides a reusable structure for bias auditing in multimodal tasks, and the prompting result offers a practical mitigation path. These elements strengthen the contribution beyond pure observation.
major comments (2)
- [Abstract] Abstract: the key findings on y-axis biases and prompting effects are stated without methodology details, sample sizes, statistical tests, error bars, or dataset specifics, preventing verification of whether the data supports the claims as stated.
- [FairChart2Table framework] FairChart2Table framework (experimental design): the evaluation tests five MLMs but does not hold model architecture, pre-training corpus, or prompt formatting fixed while only varying y-axis properties, nor report per-model training-data statistics for the tested chart styles; thus performance differences cannot be cleanly attributed to the claimed y-axis feature imbalances rather than architecture-by-feature interactions or evaluation artifacts.
minor comments (1)
- [Abstract] Abstract: consider adding one sentence on the scale of the chart corpus and the exact metrics used (e.g., exact-match accuracy or F1) to give readers immediate context for the reported biases.
Simulated Author's Rebuttal
We thank the referee for the careful review and constructive comments. We address each major point below, indicating planned revisions to strengthen the manuscript while clarifying the scope of our observational study on existing MLMs.
read point-by-point responses
-
Referee: [Abstract] Abstract: the key findings on y-axis biases and prompting effects are stated without methodology details, sample sizes, statistical tests, error bars, or dataset specifics, preventing verification of whether the data supports the claims as stated.
Authors: We agree that the abstract, as a high-level summary, omits granular details to meet length limits. The full manuscript (Sections 3 and 4) specifies the five MLMs evaluated, the public chart datasets analyzed for imbalances, the FairChart2Table evaluation protocol, and quantitative results. To improve verifiability, we will revise the abstract to include brief references to the evaluation scale, the use of standard metrics with reported variance, and the statistical significance of observed biases. revision: yes
-
Referee: [FairChart2Table framework] FairChart2Table framework (experimental design): the evaluation tests five MLMs but does not hold model architecture, pre-training corpus, or prompt formatting fixed while only varying y-axis properties, nor report per-model training-data statistics for the tested chart styles; thus performance differences cannot be cleanly attributed to the claimed y-axis feature imbalances rather than architecture-by-feature interactions or evaluation artifacts.
Authors: Our framework is designed to audit biases in deployed state-of-the-art MLMs rather than to isolate causal effects through controlled ablations on identical architectures or corpora, which would require training new models from scratch. We report per-model performance breakdowns and will expand the discussion to explicitly address potential architecture-by-feature interactions and prompt sensitivity as limitations. Publicly available information on pre-training data for chart styles is limited, but we will incorporate any disclosed details and add a dedicated limitations subsection on this point. revision: partial
- Detailed per-model training-data statistics specific to chart styles are not publicly disclosed by the developers of the five evaluated MLMs, limiting our ability to fully quantify exposure.
Circularity Check
No circularity: purely empirical observational study with no derivations or fitted predictions
full rationale
The paper conducts direct experiments on five MLMs using the FairChart2Table framework to measure performance differences across controlled y-axis variations in chart images. All key findings (biases related to digit length, tick count, range, format, and legend count; benefits of y-axis prompting) rest on observed accuracy metrics from model testing rather than any equations, parameter fitting, predictions derived from inputs, or self-citation chains. No derivation chain exists that reduces to its own inputs by construction, satisfying the criteria for a self-contained empirical analysis.
Axiom & Free-Parameter Ledger
axioms (1)
- domain assumption Performance differences in model outputs across y-axis variations indicate bias caused by dataset imbalances
Reference graph
Works this paper leans on
-
[1]
Pravesh Agrawal, Szymon Antoniak, Emma Bou Hanna, Baptiste Bout, Devendra Chaplot, Jessica Chudnovsky, Diogo Costa, Baudouin De Monicault, Saurabh Garg, Theophile Gervet, et al. 2024. Pixtral 12b. arXiv preprint arXiv:2410.07073
work page internal anchor Pith review arXiv 2024
-
[2]
Mubashara Akhtar, Oana Cocarascu, and Elena Simperl. 2023. https://doi.org/10.18653/v1/2023.findings-eacl.30 Reading and reasoning over chart images for evidence-based automated fact-checking . In Findings of the Association for Computational Linguistics: EACL 2023, pages 399--414, Dubrovnik, Croatia. Association for Computational Linguistics
-
[3]
Ritwick Chaudhry, Sumit Shekhar, Utkarsh Gupta, Pranav Maneriker, Prann Bansal, and Ajay Joshi. 2020. https://doi.org/10.1109/WACV45572.2020.9093269 Leaf-qa: Locate, encode & attend for figure question answering . In 2020 IEEE Winter Conference on Applications of Computer Vision (WACV), pages 3501--3510
-
[4]
Ashim Gupta, Vivek Gupta, Shuo Zhang, Yujie He, Ning Zhang, and Shalin Shah. 2024. https://doi.org/10.18653/v1/2024.blackboxnlp-1.11 Enhancing question answering on charts through effective pre-training tasks . In Proceedings of the 7th BlackboxNLP Workshop: Analyzing and Interpreting Neural Networks for NLP, pages 185--192, Miami, Florida, US. Associatio...
-
[5]
Aaron Hurst, Adam Lerer, Adam P Goucher, Adam Perelman, Aditya Ramesh, Aidan Clark, AJ Ostrow, Akila Welihinda, Alan Hayes, Alec Radford, et al. 2024. Gpt-4o system card. arXiv preprint arXiv:2410.21276
work page internal anchor Pith review arXiv 2024
-
[6]
Mohammed Saidul Islam, Raian Rahman, Ahmed Masry, Md Tahmid Rahman Laskar, Mir Tafseer Nayeem, and Enamul Hoque. 2024. https://doi.org/10.18653/v1/2024.findings-emnlp.191 Are large vision language models up to the challenge of chart comprehension and reasoning . In Findings of the Association for Computational Linguistics: EMNLP 2024, pages 3334--3368, Mi...
-
[7]
Kushal Kafle, Brian Price, Scott Cohen, and Christopher Kanan. 2018. https://doi.org/10.1109/CVPR.2018.00592 Dvqa: Understanding data visualizations via question answering . In 2018 IEEE/CVF Conference on Computer Vision and Pattern Recognition, pages 5648--5656
-
[8]
Samira Ebrahimi Kahou, Vincent Michalski, Adam Atkinson, \'A kos K \'a d \'a r, Adam Trischler, and Yoshua Bengio. 2017. https://doi.org/10.48550/arXiv.1710.07300 Figureqa: An annotated figure dataset for visual reasoning . arXiv preprint arXiv:1710.07300
-
[9]
Shankar Kantharaj, Rixie Tiffany Leong, Xiang Lin, Ahmed Masry, Megh Thakkar, Enamul Hoque, and Shafiq Joty. 2022. https://doi.org/10.18653/v1/2022.acl-long.277 Chart-to-text: A large-scale benchmark for chart summarization . In Proceedings of the 60th Annual Meeting of the Association for Computational Linguistics (Volume 1: Long Papers), pages 4005--402...
-
[10]
Wonjoong Kim, Sangwu Park, Yeonjun In, Seokwon Han, and Chanyoung Park. 2025. Simplot: Enhancing chart question answering by distilling essentials. In Findings of the Association for Computational Linguistics: NAACL 2025, pages 573--593
2025
-
[11]
Fangyu Liu, Julian Eisenschlos, Francesco Piccinno, Syrine Krichene, Chenxi Pang, Kenton Lee, Mandar Joshi, Wenhu Chen, Nigel Collier, and Yasemin Altun. 2023 a . Deplot: One-shot visual language reasoning by plot-to-table translation. In Findings of the Association for Computational Linguistics: ACL 2023, pages 10381--10399
2023
-
[12]
Fangyu Liu, Francesco Piccinno, Syrine Krichene, Chenxi Pang, Kenton Lee, Mandar Joshi, Yasemin Altun, Nigel Collier, and Julian Eisenschlos. 2023 b . Matcha: Enhancing visual language pretraining with math reasoning and chart derendering. In Proceedings of the 61st Annual Meeting of the Association for Computational Linguistics (Volume 1: Long Papers), p...
2023
-
[13]
Fuxiao Liu, Xiaoyang Wang, Wenlin Yao, Jianshu Chen, Kaiqiang Song, Sangwoo Cho, Yaser Yacoob, and Dong Yu. 2024. https://doi.org/10.18653/v1/2024.naacl-long.70 MMC : Advancing multimodal chart understanding with large-scale instruction tuning . In Proceedings of the 2024 Conference of the North American Chapter of the Association for Computational Lingui...
-
[14]
Ahmed Masry, Xuan Long Do, Jia Qing Tan, Shafiq Joty, and Enamul Hoque. 2022. Chartqa: A benchmark for question answering about charts with visual and logical reasoning. In Findings of the association for computational linguistics: ACL 2022, pages 2263--2279
2022
-
[15]
Ahmed Masry, Parsa Kavehzadeh, Xuan Long Do, Enamul Hoque, and Shafiq Joty. 2023. Unichart: A universal vision-language pretrained model for chart comprehension and reasoning. In Proceedings of the 2023 conference on empirical methods in natural language processing, pages 14662--14684
2023
-
[16]
Ahmed Masry, Mehrad Shahmohammadi, Md Rizwan Parvez, Enamul Hoque, and Shafiq Joty. 2024. https://doi.org/10.18653/v1/2024.findings-acl.619 C hart I nstruct: Instruction tuning for chart comprehension and reasoning . In Findings of the Association for Computational Linguistics: ACL 2024, pages 10387--10409, Bangkok, Thailand. Association for Computational...
-
[17]
Ahmed Masry, Megh Thakkar, Aayush Bajaj, Aaryaman Kartha, Enamul Hoque, and Shafiq Joty. 2025. https://aclanthology.org/2025.coling-industry.54/ C hart G emma: Visual instruction-tuning for chart reasoning in the wild . In Proceedings of the 31st International Conference on Computational Linguistics: Industry Track, pages 625--643, Abu Dhabi, UAE. Associa...
2025
-
[18]
Fanqing Meng, Wenqi Shao, Quanfeng Lu, Peng Gao, Kaipeng Zhang, Yu Qiao, and Ping Luo. 2024. Chartassistant: A universal chart multimodal language model via chart-to-table pre-training and multitask instruction tuning. In Findings of the Association for Computational Linguistics: ACL 2024, pages 7775--7803
2024
-
[19]
Nitesh Methani, Pritha Ganguly, Mitesh M Khapra, and Pratyush Kumar. 2020. Plotqa: Reasoning over scientific plots. In Proceedings of the IEEE/CVF Winter Conference on Applications of Computer Vision, pages 1527--1536
2020
-
[20]
Srija Mukhopadhyay, Adnan Qidwai, Aparna Garimella, Pritika Ramu, Vivek Gupta, and Dan Roth. 2024. https://doi.org/10.18653/v1/2024.findings-emnlp.973 Unraveling the truth: Do VLM s really understand charts? a deep dive into consistency and robustness . In Findings of the Association for Computational Linguistics: EMNLP 2024, pages 16696--16717, Miami, Fl...
-
[21]
Karl Pearson. 1896. Vii. mathematical contributions to the theory of evolution.—iii. regression, heredity, and panmixia. Philosophical Transactions of the Royal Society of London. Series A, containing papers of a mathematical or physical character, (187):253--318
-
[22]
Shraman Pramanick, Rama Chellappa, and Subhashini Venugopalan. 2024. Spiqa: A dataset for multimodal question answering on scientific papers. Advances in Neural Information Processing Systems, 37:118807--118833
2024
-
[23]
Liang Zhang, Anwen Hu, Haiyang Xu, Ming Yan, Yichen Xu, Qin Jin, Ji Zhang, and Fei Huang. 2024. https://doi.org/10.18653/v1/2024.emnlp-main.112 T iny C hart: Efficient chart understanding with program-of-thoughts learning and visual token merging . In Proceedings of the 2024 Conference on Empirical Methods in Natural Language Processing, pages 1882--1898,...
-
[24]
Zifeng Zhu, Mengzhao Jia, Zhihan Zhang, Lang Li, and Meng Jiang. 2025. Multichartqa: Benchmarking vision-language models on multi-chart problems. In Proceedings of the 2025 Conference of the Nations of the Americas Chapter of the Association for Computational Linguistics: Human Language Technologies (Volume 1: Long Papers), pages 11341--11359
2025
-
[25]
online" 'onlinestring :=
ENTRY address archivePrefix author booktitle chapter edition editor eid eprint eprinttype howpublished institution journal key month note number organization pages publisher school series title type volume year doi pubmed url lastchecked label extra.label sort.label short.list INTEGERS output.state before.all mid.sentence after.sentence after.block STRING...
-
[26]
write newline
" write newline "" before.all 'output.state := FUNCTION n.dashify 't := "" t empty not t #1 #1 substring "-" = t #1 #2 substring "--" = not "--" * t #2 global.max substring 't := t #1 #1 substring "-" = "-" * t #2 global.max substring 't := while if t #1 #1 substring * t #2 global.max substring 't := if while FUNCTION word.in bbl.in capitalize " " * FUNCT...
discussion (0)
Sign in with ORCID, Apple, or X to comment. Anyone can read and Pith papers without signing in.