Recognition: unknown
Evaluating local climate in global storm-resolving models with the K\"oppen-Geiger classification
Pith reviewed 2026-05-07 14:12 UTC · model grok-4.3
The pith
Storm-resolving models reproduce global climate zone patterns but show regional biases driven mainly by precipitation errors.
A machine-rendered reading of the paper's core claim, the machinery that carries it, and where it could break.
Core claim
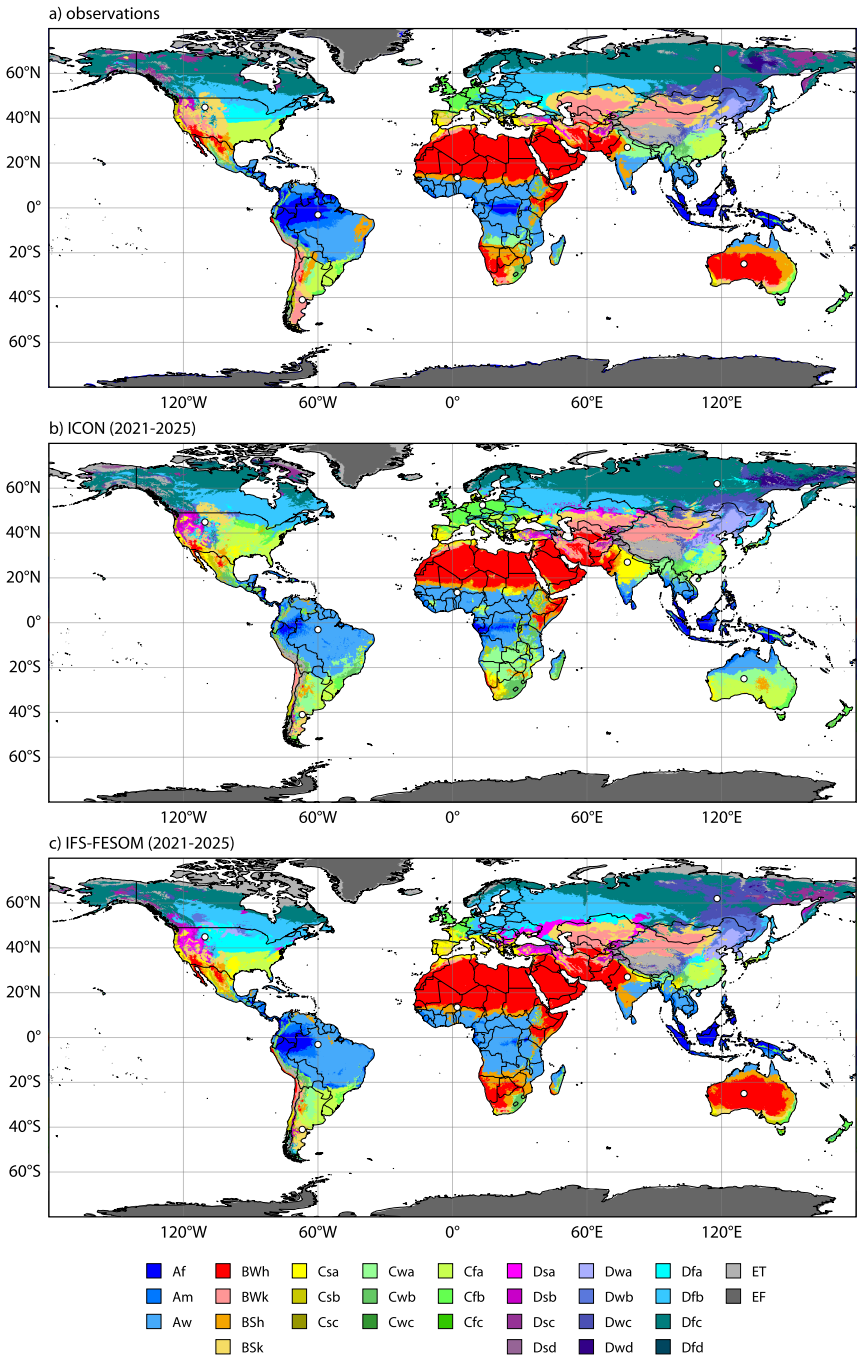
Both ICON and IFS-FESOM capture the global distribution of the five main Köppen-Geiger climate categories in 30-year simulations at 9 km resolution under the SSP3-7.0 scenario. Substantial regional biases remain, including underestimation of tropical rainforest extent due to insufficient dry-month precipitation in Amazonia and equatorial Africa, near-elimination of hot arid desert in Australia by ICON through excess precipitation, and opposing biases along the temperate-continental boundary. Precipitation errors dominate misclassifications while temperature biases play a secondary role at mid-latitude zone edges. The two models agree with CMIP6 projections on the direction of future climateゾ
What carries the argument
The Köppen-Geiger classification system, which assigns climate zones such as tropical rainforest (Af) or hot desert (BWh) using monthly temperature and precipitation thresholds, applied to diagnose accuracy of local climate information in storm-resolving model output.
If this is right
- The two models and CMIP6 projections agree on the direction of climate zone shifts under warming, including expansion of tropical savanna and hot desert at the expense of subarctic, tundra, and ice cap zones.
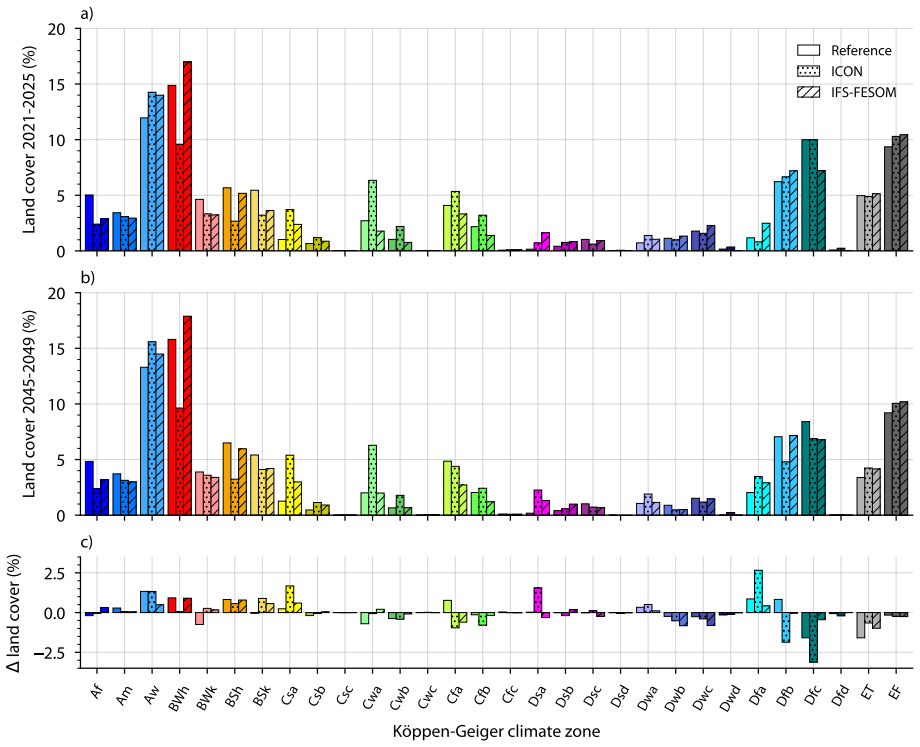
- Inter-model differences in present-day climate exceed the 30-year climate change signal for many zones, calling for caution in regional projections.
- Precipitation errors are the primary driver of climate zone misclassifications, while temperature biases are secondary and limited to mid-latitude boundaries.
- Substituting observed fields shows that ICON produces excessive precipitation over Australia while IFS-FESOM matches the desert zone there more closely.
Where Pith is reading between the lines
- Routine use of Köppen-Geiger classification could provide a simple, standardized benchmark to monitor improvements as storm-resolving models increase resolution or refine their physics.
- The dominance of precipitation biases suggests targeted development on convective and land-surface processes in tropical and arid regions would yield the largest gains in classification accuracy.
- Because present-day model spread exceeds the climate change signal, multi-model ensembles may be required before relying on these simulations for specific regional adaptation decisions.
Load-bearing premise
The Köppen-Geiger thresholds based solely on monthly temperature and precipitation are sufficient and unbiased for judging whether the models deliver accurate local-scale climate information.
What would settle it
Comparison of model output against high-resolution observational temperature and precipitation records in the Amazon, Australia, and western Europe to check whether the models' assigned climate zones match the observed classifications in regions of disagreement.
Figures


read the original abstract
Global storm-resolving models aspire to become digital twins of the Earth, delivering information at the local scale at which humans experience climate. We evaluated how well two such models, ICON and IFS-FESOM, reproduce the climate as classified by the K\"oppen-Geiger system, using 30-year (2020-2049) simulations from the nextGEMS project at 9~km global resolution under SSP3-7.0 scenario. Both models capture the global distribution of the five main climate categories, encouraging given the infancy of storm-resolving climate modelling. Substantial regional biases nonetheless remain. Both underestimate tropical rainforest (Af) extent due to insufficient dry-month precipitation in Amazonia and equatorial Africa. ICON almost eliminates hot arid desert (BWh) across Australia through excessive precipitation, while IFS-FESOM reproduces it well. The two models show opposing biases along the temperate--continental boundary: IFS-FESOM winters are too cold in western Europe, ICON winters too warm. Substituting observed temperature or precipitation into the model fields reveals that precipitation errors dominate misclassification, while temperature biases play a secondary role confined to mid-latitude climate zone boundaries. Under climate change, the two models and CMIP6 projections agree on the direction of climate zone shifts: expansion of tropical savanna and hot desert at the expense of subarctic, tundra, and ice cap zones. However, inter-model differences in present-day climate exceed the 30-year climate change signal for many zones, calling for caution in regional projections and adaptation planning. Our results expose where local-scale climate representation still falls short of the digital twin ambition, while confirming that storm-resolving models already perform well across many regions. We propose K\"oppen-Geiger classification as a standard diagnostic to help track further progress.
Editorial analysis
A structured set of objections, weighed in public.
Referee Report
Summary. The manuscript evaluates two global storm-resolving models (ICON and IFS-FESOM) at 9 km resolution from the nextGEMS project. Using 30-year (2020-2049) simulations under SSP3-7.0, it applies the Köppen-Geiger classification to assess reproduction of observed climate zones. Both models capture the global distribution of the five main categories, with precipitation errors dominating misclassifications (e.g., underestimation of Af in Amazonia/Africa and ICON's over-precipitation eliminating BWh in Australia). Opposing biases appear at temperate-continental boundaries. Models agree with CMIP6 on future zone shifts (expansion of savanna/desert at expense of subarctic/tundra/ice), but present-day inter-model differences exceed the 30-year change signal. The classification is proposed as a standard diagnostic.
Significance. If the results hold, this provides a useful early benchmark for local climate representation in storm-resolving models, which are still in their infancy for climate applications. Strengths include the substitution tests isolating precipitation vs. temperature errors and the explicit comparison to CMIP6, which contextualizes the findings. The work identifies concrete regional biases that can guide development and offers a practical, parameter-free diagnostic to track progress toward digital-twin ambitions.
major comments (2)
- [Abstract and §2] Abstract and §2 (Methods): The central claim that the models deliver 'information at the local scale' rests on agreement with Köppen-Geiger classes. However, the scheme applies fixed thresholds to 30-year monthly-mean T and P fields only. This averages out the high-frequency and small-scale variability that 9 km storm-resolving models are designed to resolve. The substitution test (replacing model T or P with observations) confirms precipitation dominance but remains inside the monthly-mean framework and does not test sensitivity to the processes the models target at local scales.
- [§2] §2 (Methods): Exact observational datasets for the reference classification, precise processing steps to obtain monthly means from the native 9 km output, and any uncertainty quantification (e.g., sensitivity to threshold definitions or internal variability) are not fully specified. These omissions affect reproducibility of the reported biases and the robustness of the conclusion that precipitation errors dominate.
minor comments (2)
- [Figure 1] Figure 1 and associated text: The global maps would benefit from an inset or supplementary panel showing the reference observational classification for direct visual comparison.
- [§4] §4 (Discussion): The statement that present-day inter-model differences exceed the climate-change signal is important; adding a table or quantitative metric (e.g., area fractions per zone) would make the claim more precise and easier to evaluate.
Simulated Author's Rebuttal
We thank the referee for the constructive comments and the recommendation for minor revision. We address each major comment point by point below.
read point-by-point responses
-
Referee: [Abstract and §2] The central claim that the models deliver 'information at the local scale' rests on agreement with Köppen-Geiger classes. However, the scheme applies fixed thresholds to 30-year monthly-mean T and P fields only. This averages out the high-frequency and small-scale variability that 9 km storm-resolving models are designed to resolve. The substitution test (replacing model T or P with observations) confirms precipitation dominance but remains inside the monthly-mean framework and does not test sensitivity to the processes the models target at local scales.
Authors: We agree that the Köppen-Geiger classification relies exclusively on 30-year monthly means and therefore does not directly assess the high-frequency and small-scale variability resolved at 9 km. Our substitution tests were performed within this monthly-mean framework to isolate precipitation versus temperature contributions to zone misclassifications. We have revised the abstract and added a clarifying paragraph in Section 2 that explicitly states the scope and limitations of the analysis with respect to sub-monthly processes. We maintain that the classification remains a useful, parameter-free diagnostic for the fidelity of simulated climate zones, while acknowledging it does not substitute for metrics targeting the resolved variability. revision: partial
-
Referee: [§2] Exact observational datasets for the reference classification, precise processing steps to obtain monthly means from the native 9 km output, and any uncertainty quantification (e.g., sensitivity to threshold definitions or internal variability) are not fully specified. These omissions affect reproducibility of the reported biases and the robustness of the conclusion that precipitation errors dominate.
Authors: We thank the referee for identifying these gaps in the Methods section. In the revised manuscript we have expanded §2 to specify the exact observational datasets (CRU TS v4.07 for temperature and GPCC v2022 for precipitation, following the Beck et al. 2018 reference classification), the precise workflow for computing 30-year monthly means from native 9 km output (including temporal averaging, any required regridding, and handling of land-sea masks), and an uncertainty quantification subsection. The latter includes sensitivity tests to threshold perturbations and an assessment of internal variability using the available simulation segments. These additions directly support the reproducibility and robustness of the precipitation-dominance conclusion. revision: yes
Circularity Check
No circularity: direct application of external classification to model outputs
full rationale
The paper performs an empirical evaluation by applying the fixed, externally defined Köppen-Geiger thresholds (based on long-term monthly T and P) to 30-year model fields and observations. No parameters are fitted, no predictions are derived from the models themselves, and no self-citations serve as load-bearing premises for the central claims. The substitution tests and climate-change comparisons operate within the same external scheme without reducing the results to the inputs by construction. The derivation chain is therefore self-contained against independent benchmarks.
Axiom & Free-Parameter Ledger
axioms (1)
- domain assumption The Köppen-Geiger classification system provides a meaningful representation of local climate zones experienced by humans.
Reference graph
Works this paper leans on
-
[1]
Global cloud-resolving models,
Masaki Satoh et al. “Global Cloud-Resolving Models”. In:Current Climate Change Reports5 (2019), pp. 172–184.doi:10.1007/s40641-019-00131-0
-
[2]
DYAMOND: the DYnamics of the Atmospheric general circulation Modeled On Non- hydrostatic Domains
Bjorn Stevens et al. “DYAMOND: the DYnamics of the Atmospheric general circulation Modeled On Non- hydrostatic Domains”. In:Progress in Earth and Planetary Science6 (2019), p. 61.doi:10.1186/s40645- 019-0304-z
-
[3]
Aaron S. Donahue et al. “To Exascale and Beyond—The Simple Cloud-Resolving E3SM Atmosphere Model (SCREAM), a Performance Portable Global Atmosphere Model for Cloud-Resolving Scales”. In: Journal of Advances in Modeling Earth Systems16 (2024), e2024MS004314.doi:10.1029/2024MS004314. 14
-
[4]
Weaker land–atmosphere coupling in global storm-resolving simu- lation
Junhong Lee and Cathy Hohenegger. “Weaker land–atmosphere coupling in global storm-resolving simu- lation”. In:Proceedings of the National Academy of Sciences121.12 (2024), e2314265121.doi:10.1073/ pnas.2314265121
2024
-
[5]
nextGEMS: entering the era of kilometer-scale Earth system modeling
H. Segura et al. “nextGEMS: entering the era of kilometer-scale Earth system modeling”. In:EGUsphere 2025 (2025), pp. 1–39.doi:10.5194/egusphere-2025-509
-
[6]
Junhong Lee et al. “Spatial and Temporal Preferences for Afternoon Precipitation over Morning Soil Moisture in Global Storm-Resolving Simulations”. In:Geoscience Letters13.1 (Feb. 24, 2026), p. 13.issn: 2196-4092.doi:10.1186/s40562-026-00461-6
-
[7]
Jonathan D. Wille et al. “Extreme Precipitation Depiction in Convection-Permitting Earth System Mod- els Within the nextGEMS Project”. In:Journal of Advances in Modeling Earth Systems17 (2025), e2024MS004840.doi:10.1029/2024MS004840
-
[8]
Multi-year simulations at kilometre scale with the Integrated Forecasting System coupled to FESOM2.5 and NEMOv3.4
T. Rackow et al. “Multi-year simulations at kilometre scale with the Integrated Forecasting System coupled to FESOM2.5 and NEMOv3.4”. In:Geoscientific Model Development18.1 (2025), pp. 33–69.doi:10. 5194/gmd-18-33-2025.url:https://gmd.copernicus.org/articles/18/33/2025/
2025
-
[9]
The Impact of Horizontal Resolution on Surface Irradiance Over Land in km-Scale Earth System Models
M. A. Veerman and C. C. van Heerwaarden. “The Impact of Horizontal Resolution on Surface Irradiance Over Land in km-Scale Earth System Models”. In:Journal of Geophysical Research: Atmospheres131.3 (2026), e2025JD044845.doi:https://doi.org/10.1029/2025JD044845
-
[10]
Unlocking Urban Climate Change Analysis in Global Kilometre-Scale Climate Simulations
Xabier Pedruzo-Bagazgoitia et al. “Unlocking Urban Climate Change Analysis in Global Kilometre-Scale Climate Simulations”. In:ESS Open Archive [preprint](2025). Preprint, under review at Geophysical Research Letters
2025
-
[11]
A global perspective on the spatial representation of climate extremes from km-scale models
Lukas Brunner et al. “A global perspective on the spatial representation of climate extremes from km-scale models”. In:Environmental Research Letters20.7 (2025), p. 074054.doi:10.1088/1748-9326/ade1ef
-
[12]
Storm-Resolving Models Advance Atmospheric Block- ing Simulations and Climate Change Insights
E. Dolores-Tesillos, O. Martius, and S. Pfahl. “Storm-Resolving Models Advance Atmospheric Block- ing Simulations and Climate Change Insights”. In:EGUsphere2025 (2025), pp. 1–45.doi:10 . 5194 / egusphere - 2025 - 4969.url:https : / / egusphere . copernicus . org / preprints / 2025 / egusphere - 2025-4969/
2025
-
[13]
The Destination Earth digital twin for climate change adaptation
Francisco J. Doblas-Reyes et al. “The Destination Earth digital twin for climate change adaptation”. EGUsphere preprint, under review for Geoscientific Model Development. 2025.doi:10.5194/egusphere- 2025-2198
-
[14]
Des lignes isothermes et de la distribution de la chaleur sur le globe
Alexander von Humboldt. “Des lignes isothermes et de la distribution de la chaleur sur le globe”. In: M´ emoires de Physique et de Chimie de la Soci´ et´ e d’Arcueil3 (1817), pp. 462–602
-
[15]
The Evolution of Climate Ideas and Knowledge
Matthias Heymann. “The Evolution of Climate Ideas and Knowledge”. en. In:WIREs Climate Change 1.4 (July 2010), pp. 581–597.issn: 1757-7780, 1757-7799.doi:10.1002/wcc.61
-
[16]
Stuttgart: J
Julius Hann.Handbuch der Klimatologie. Stuttgart: J. Engelhorn, 1883. 15
-
[17]
Die W¨ armezonen der Erde, nach der Dauer der heissen, gem¨ assigten und kalten Zeit und nach der Wirkung der W¨ arme auf die organische Welt betrachtet
Wladimir K¨ oppen. “Die W¨ armezonen der Erde, nach der Dauer der heissen, gem¨ assigten und kalten Zeit und nach der Wirkung der W¨ arme auf die organische Welt betrachtet”. In:Meteorologische Zeitschrift1 (1884), pp. 215–226
-
[18]
Updated world map of the K¨ oppen- Geiger climate classification
Murray C. Peel, Brian L. Finlayson, and Thomas A. McMahon. “Updated world map of the K¨ oppen- Geiger climate classification”. In:Hydrology and Earth System Sciences11.5 (2007), pp. 1633–1644.doi: 10.5194/hess-11-1633-2007
-
[19]
Hylke E. Beck et al. “Present and future K¨ oppen-Geiger climate classification maps at 1-km resolution”. In:Scientific Data5 (2018), p. 180214.doi:10.1038/sdata.2018.214
-
[20]
High-resolution (1 km) K¨ oppen-Geiger maps for 1901–2099 based on constrained CMIP6 projections
Hylke E. Beck et al. “High-resolution (1 km) K¨ oppen-Geiger maps for 1901–2099 based on constrained CMIP6 projections”. In:Scientific Data10 (2023), p. 724.doi:10.1038/s41597-023-02549-6
-
[21]
Climate Calculations with a Combined Ocean-Atmosphere Model
Syukuro Manabe and Kirk Bryan. “Climate Calculations with a Combined Ocean-Atmosphere Model”. In: Journal of the Atmospheric Sciences26 (1969), pp. 786–789.doi:10.1175/1520-0469(1969)026<0786: CCWACO>2.0.CO;2
-
[22]
Thermal Equilibrium of the Atmosphere with a Given Distribution of Relative Humidity
Syukuro Manabe and Richard T. Wetherald. “Thermal Equilibrium of the Atmosphere with a Given Distribution of Relative Humidity”. In:Journal of the Atmospheric Sciences24 (1967), pp. 241–259.doi: 10.1175/1520-0469(1967)024<0241:TEOTAW>2.0.CO;2
-
[23]
Climate Impact of Increasing Atmospheric Carbon Dioxide
J. Hansen et al. “Climate Impact of Increasing Atmospheric Carbon Dioxide”. In:Science213 (1981), pp. 957–966.doi:10.1126/science.213.4511.957
-
[24]
The Climate Change Dilemma: Big Science, the Globalizing of Climate and the Loss of the Human Scale
Matthias Heymann. “The Climate Change Dilemma: Big Science, the Globalizing of Climate and the Loss of the Human Scale”. en. In:Regional Environmental Change19.6 (Aug. 2019), pp. 1549–1560.issn: 1436-3798, 1436-378X.doi:10.1007/s10113-018-1373-z
-
[25]
WCRP COordinated Regional Downscaling EXperiment (CORDEX): a diag- nostic MIP for CMIP6
W. J. Gutowski Jr. et al. “WCRP COordinated Regional Downscaling EXperiment (CORDEX): a diag- nostic MIP for CMIP6”. In:Geoscientific Model Development9 (2016), pp. 4087–4095.doi:10.5194/gmd- 9-4087-2016
-
[26]
Earth Virtualization Engines (EVE)
Bjorn Stevens et al. “Earth Virtualization Engines (EVE)”. English. In:Earth System Science Data16.4 (Apr. 2024), pp. 2113–2122.issn: 1866-3508.doi:10.5194/essd-16-2113-2024
-
[27]
Karl-Hermann Wieners et al.nextGEMS: output of the production simulations for ICON and IFS. 2024. url:https://www.wdc-climate.de/ui/entry?acronym=nextGEMS%5C_prod
2024
-
[28]
IFS Documentation CY48R1 - Part IV: Physical Processes
ECMWF. “IFS Documentation CY48R1 - Part IV: Physical Processes”. In: 4. ECMWF, 2023.doi: 10.21957/02054f0fbf
-
[29]
2023.doi:10.5281/zenodo.10225420
Thomas Rackow et al.FESOM2.5 source code used in nextGEMS Cycle 3 simulations with IFS-FESOM. 2023.doi:10.5281/zenodo.10225420
-
[30]
C. Hohenegger et al. “ICON-Sapphire: simulating the components of the Earth system and their interac- tions at kilometer and subkilometer scales”. In:Geoscientific Model Development16.2 (2023), pp. 779– 811.doi:10.5194/gmd-16-779-2023. 16
-
[31]
The Scenario Model Intercomparison Project (ScenarioMIP) for CMIP6
B. C. O’Neill et al. “The Scenario Model Intercomparison Project (ScenarioMIP) for CMIP6”. In:Geo- scientific Model Development9.9 (2016), pp. 3461–3482.doi:10.5194/gmd-9-3461-2016
-
[32]
K. M. G´ orski et al. “HEALPix: A Framework for High-Resolution Discretization and Fast Analysis of Data Distributed on the Sphere”. In:The Astrophysical Journal622.2 (Apr. 2005), p. 759.doi:10.1086/427976
work page internal anchor Pith review doi:10.1086/427976 2005
-
[33]
CMIP6 GCMs Projected Future K¨ oppen-Geiger Climate Zones on a Global Scale
Yong-Sang Song, You-Joung Kim, and Jin-Young Kim. “CMIP6 GCMs Projected Future K¨ oppen-Geiger Climate Zones on a Global Scale”. In:Earth’s Future13.1 (2025), e2023EF004401.doi:10 . 1029 / 2023EF004401
2025
-
[34]
CMIP6 Earth System Models Project Greater Acceleration of Climate Zone Change Due To Stronger Warming Rates
Aslı S. Bayar et al. “CMIP6 Earth System Models Project Greater Acceleration of Climate Zone Change Due To Stronger Warming Rates”. In:Earth’s Future11.3 (2023), e2022EF002972.doi:10 . 1029 / 2022EF002972
2023
-
[35]
The Impacts of Global Warming on Climate Zone Changes Over Asia Based on CMIP6 Projections
You-Joung Kim et al. “The Impacts of Global Warming on Climate Zone Changes Over Asia Based on CMIP6 Projections”. In:Earth and Space Science8.9 (2021), e2021EA001701.doi:10.1029/2021EA001701
-
[36]
Three decades of simulating global temperature patterns with coupled global climate models
Lukas Brunner et al. “Three decades of simulating global temperature patterns with coupled global climate models”. In:Communications Earth & Environment(2026).doi:10.1038/s43247-026-03497-w
-
[37]
A protocol and analysis of year-long simulations of global storm-resolving models and beyond
Daisuke Takasuka et al. “A protocol and analysis of year-long simulations of global storm-resolving models and beyond”. In:Progress in Earth and Planetary Science11 (2024), p. 64.doi:10.1186/s40645-024- 00668-1. 17 Symbol Meaning MAP mean annual precipitation MAT mean annual temperature Pth precipitation threshold (see below) Tcold temperature of coldest ...
discussion (0)
Sign in with ORCID, Apple, or X to comment. Anyone can read and Pith papers without signing in.