Recognition: unknown
Sources of Inequality at Birth: The Interplay Between Genes and Parental Socioeconomic Status
Pith reviewed 2026-05-07 13:57 UTC · model grok-4.3
The pith
Polygenic indexes and parental socioeconomic status independently predict adult traits with no sizable gene-environment interactions.
A machine-rendered reading of the paper's core claim, the machinery that carries it, and where it could break.
Core claim
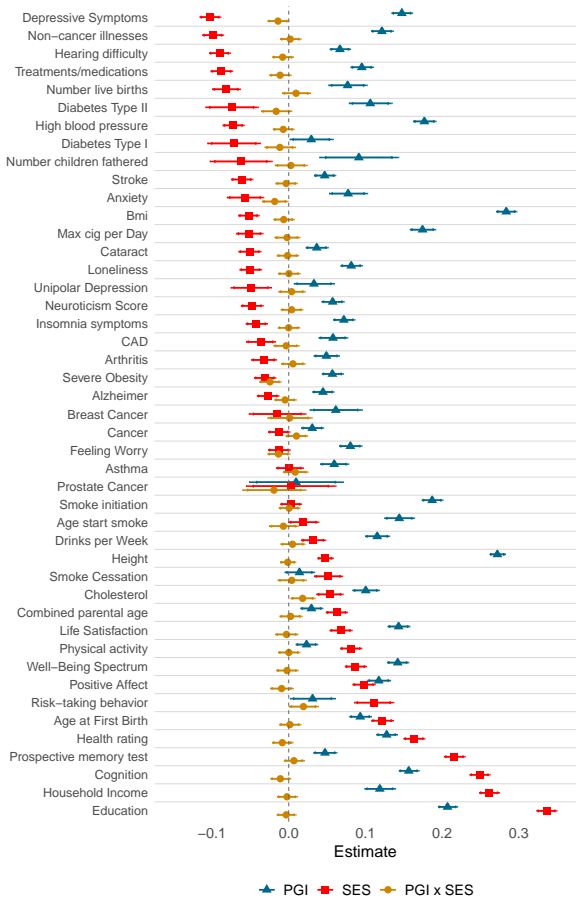
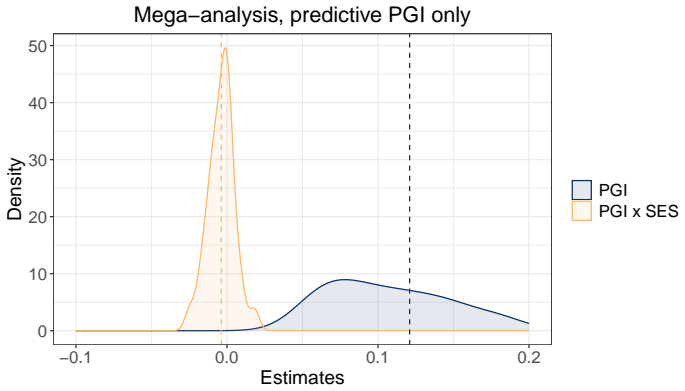
The authors find that an individual's genotype, proxied by polygenic indexes, and the socioeconomic status of their family, measured by a latent factor of parental education and father's occupational status, each show strong associations with a wide range of adult phenotypes, but there is no evidence of sizable interactions between these genetic and environmental factors.
What carries the argument
Polygenic indexes as proxies for genetic predisposition and a latent parental SES factor, entered together with their interaction term in regressions predicting forty-five later-life traits.
Load-bearing premise
The polygenic indexes accurately capture the relevant genetic variation without substantial bias from population stratification or measurement error, and the latent parental SES factor fully represents the relevant family environment.
What would settle it
Finding statistically significant and sizable positive or negative interaction terms between polygenic indexes and the parental SES factor in the regressions for many of the forty-five traits would contradict the central claim.
Figures


read the original abstract
The start of a human's life can be characterized by two lotteries: that of your genes (nature) and the family you were born into (nurture). These set in motion a trajectory, from birth onward, in health and human capital. Leveraging three longitudinal social-science data sets, we systematically analyze the relationship between an individual's genotype, the socioeconomic status (SES) of the families they grew up in, and their realized traits in adulthood. We proxy an individual's genetic predisposition by polygenic indexes (PGIs) and family SES by a latent factor of parental education and father's (former) occupational status. We then investigate how PGIs, parental SES, and their interaction contribute to later-life outcomes across a range of forty-five socioeconomic, anthropometric, health, behavioral, and personality traits. We find strong genetic and socioeconomic associations with these phenotypes, but no evidence of sizable gene-environment interactions.
Editorial analysis
A structured set of objections, weighed in public.
Referee Report
Summary. The paper uses three longitudinal datasets to estimate associations of polygenic indexes (PGIs) and a latent parental SES factor (from parental education and father's occupation) with 45 adult traits spanning socioeconomic, anthropometric, health, behavioral, and personality domains. It reports strong main effects of both PGIs and parental SES but finds no evidence of sizable gene-environment interactions.
Significance. If the null result on interactions is robust, the paper offers valuable evidence that genetic and socioeconomic influences on inequality from birth operate largely additively across a wide range of traits. The multi-dataset design and broad trait coverage enhance generalizability, and the purely empirical approach with direct estimation from data is a methodological strength.
major comments (2)
- The central claim of 'no evidence of sizable gene-environment interactions' (abstract and results) is load-bearing for the paper's contribution, yet the manuscript provides no statistical power calculations for the interaction terms, no reported magnitudes or confidence intervals for the PGI × SES coefficients, and no explicit multiple-testing correction across 45 traits. These omissions make it difficult to evaluate whether the null reflects true absence of sizable effects or insufficient power/uncorrected testing.
- Methods section: The latent parental SES factor relies on only two indicators. The paper should explicitly test and discuss whether this measure fully captures the relevant family environment (e.g., via sensitivity checks adding income or wealth) or whether measurement incompleteness could differentially attenuate interaction estimates relative to main effects, as flagged by the weakest assumption in the analysis.
minor comments (2)
- The abstract refers to 'three longitudinal social-science data sets' without naming them; specifying the datasets (and sample sizes) early would improve transparency and allow readers to assess generalizability.
- A supplementary table listing standardized main-effect and interaction coefficients (with SEs) for all 45 traits would help readers judge what counts as 'sizable' and assess consistency across domains.
Simulated Author's Rebuttal
We thank the referee for the constructive comments, which help clarify the statistical robustness and measurement assumptions underlying our findings on gene-environment interactions. We address each major point below and describe the revisions we will make.
read point-by-point responses
-
Referee: The central claim of 'no evidence of sizable gene-environment interactions' (abstract and results) is load-bearing for the paper's contribution, yet the manuscript provides no statistical power calculations for the interaction terms, no reported magnitudes or confidence intervals for the PGI × SES coefficients, and no explicit multiple-testing correction across 45 traits. These omissions make it difficult to evaluate whether the null reflects true absence of sizable effects or insufficient power/uncorrected testing.
Authors: We agree that explicit power calculations, full reporting of interaction coefficient magnitudes with confidence intervals, and multiple-testing adjustments strengthen interpretation of the null results. In the revised manuscript we will add power analyses for interaction effects of plausible sizes (e.g., 0.05–0.20 SD), include an appendix table reporting all PGI × SES coefficients together with 95% confidence intervals, and apply a false-discovery-rate correction across the 45 traits while discussing how this affects the conclusion of no sizable interactions. These changes will make the statistical basis for the central claim fully transparent. revision: yes
-
Referee: Methods section: The latent parental SES factor relies on only two indicators. The paper should explicitly test and discuss whether this measure fully captures the relevant family environment (e.g., via sensitivity checks adding income or wealth) or whether measurement incompleteness could differentially attenuate interaction estimates relative to main effects, as flagged by the weakest assumption in the analysis.
Authors: We concur that reliance on two indicators is a limitation of the latent SES factor. In the revision we will conduct and report sensitivity analyses that incorporate additional family-environment measures (parental income or wealth) in the datasets where these variables are available. We will also add a discussion of how classical measurement error in the SES factor could attenuate interaction coefficients more than main effects, referencing the relevant econometric literature on this issue. These checks will directly address the concern about incomplete capture of the family environment. revision: yes
Circularity Check
No circularity: purely empirical estimation of associations
full rationale
The manuscript performs direct statistical estimation via linear regressions of 45 traits on child polygenic indexes (PGIs), a latent parental SES factor derived from two indicators, and their interaction term, using three longitudinal datasets. No derivations, first-principles results, or predictions are claimed; the reported associations and lack of sizable GxE interactions are outputs of ordinary least-squares fits to the observed data. No self-citations serve as load-bearing premises, no parameters are fitted to subsets and then renamed as predictions, and no ansatzes or uniqueness theorems are invoked. The analysis is therefore self-contained against external benchmarks and exhibits no reduction of outputs to inputs by construction.
Axiom & Free-Parameter Ledger
axioms (2)
- domain assumption Polygenic indexes constructed from GWAS summary statistics accurately proxy genetic predisposition for the studied traits.
- domain assumption The latent factor from parental education and father's occupational status adequately captures family socioeconomic environment.
Reference graph
Works this paper leans on
-
[1]
Blau, P. M. & Duncan, O. D.The American Occupational Structure(Wiley, New York, 1967)
1967
-
[2]
Inequality: A reassessment of the effect of family and schooling in America (Basic Books, New York, 1972)
Jencks, C.et al. Inequality: A reassessment of the effect of family and schooling in America (Basic Books, New York, 1972)
1972
-
[3]
& Passeron, J.-C.Reproduction in Education, Society and Culture(Sage, 1977)
Bourdieu, P. & Passeron, J.-C.Reproduction in Education, Society and Culture(Sage, 1977)
1977
- [4]
-
[5]
Black, S. E., Devereux, P. J. & Salvanes, K. G. Why the apple doesn’t fall far: Understanding intergenerational transmission of human capital.American Economic Review95, 437–449 (2005). URLhttp://pubs.aeaweb.org/doi/10.1257/0002828053828635
-
[6]
Mare, R. D. A multigenerational view of inequality.Demography48, 1–23 (2011)
2011
-
[7]
Intergenerational income mobility in the united states.American Economic Review 82, 393–408 (1992)
Solon, G. Intergenerational income mobility in the united states.American Economic Review 82, 393–408 (1992)
1992
-
[8]
Shonkoff, J. P. & Phillips, D. A.From neurons to neighborhoods: The science of early childhood development(National Academy Press, Washington, DC, 2000)
2000
-
[9]
Heckman, J. J. Skill formation and the economics of investing in disadvantaged children. Science312, 1900–1902 (2006)
1900
-
[10]
Income inequality, equality of opportunity, and intergenerational mobility.Journal of Economic Perspectives27, 79–102 (2013)
Corak, M. Income inequality, equality of opportunity, and intergenerational mobility.Journal of Economic Perspectives27, 79–102 (2013)
2013
-
[11]
N., Saez, E., Turner, N
Chetty, R., Friedman, J. N., Saez, E., Turner, N. & Yagan, D. Income segregation and inter- generational mobility across colleges in the united states.Quarterly Journal of Economics135, 1567–1633 (2020). URLhttps://academic.oup.com/qje/article/135/3/1567/5741707
2020
-
[12]
P.The genetic lottery: Why DNA matters for social equality(Princeton University Press, 2021)
Harden, K. P.The genetic lottery: Why DNA matters for social equality(Princeton University Press, 2021)
2021
-
[13]
A., Ronda, V
Houmark, M. A., Ronda, V. & Rosholm, M. The nurture of nature and the nature of nurture: How genes and investments interact in the formation of skills.American Economic Review 114, 385–425 (2024). 16
2024
-
[14]
J.et al.Meta-analysis of the heritability of human traits based on fifty years of twin studies.Nature Genetics47, 702–709 (2015)
Polderman, T. J.et al.Meta-analysis of the heritability of human traits based on fifty years of twin studies.Nature Genetics47, 702–709 (2015)
2015
-
[15]
J.et al.Fetal nutrition and cardiovascular disease in adult life.Lancet341, 938–941 (1993)
Barker, D. J.et al.Fetal nutrition and cardiovascular disease in adult life.Lancet341, 938–941 (1993)
1993
-
[16]
Galobardes, B., Lynch, J. W. & Smith, G. D. Is the association between childhood socioeco- nomic circumstances and cause-specific mortality established? update of a systematic review. Journal of Epidemiology & Community Health62, 387–390 (2008)
2008
-
[17]
J., Lochner, L
Cunha, F., Heckman, J. J., Lochner, L. & Masterov, D. V. Interpreting the evidence on life cycle skill formation. InHandbook of the Economics of Education, vol. 1, 697–812 (Elsevier, 2006)
2006
-
[18]
& Currie, J
Almond, D. & Currie, J. Human capital development before age five. In Ashenfelter, O. & Card, D. (eds.)Handbook of Labor Economics, vol. 4B, 1315–1486 (Elsevier, 2011)
2011
-
[19]
& Currie, J
Aizer, A. & Currie, J. The intergenerational transmission of inequality: Maternal disadvantage and health at birth.Science344, 856–861 (2014)
2014
-
[20]
& Duque, V
Almond, D., Currie, J. & Duque, V. Childhood circumstances and adult outcomes: Act ii. Journal of Economic Literature56, 1360–1446 (2018)
2018
- [21]
-
[22]
Plomin, R., DeFries, J. C. & Loehlin, J. C. Genotype-environment interaction and correlation in the analysis of human behavior.Psychological Bulletin84, 309 (1977)
1977
-
[23]
McAllister, K.et al.Current challenges and new opportunities for gene-environment interaction studies of complex diseases.American Journal of Epidemiology186, 753–761 (2017)
2017
-
[24]
Biroli, P.et al.The economics and econometrics of gene–environment interplay.Review of Economic Studies93, 144–180 (2025)
2025
-
[25]
Race, social class, and iq.Science174, 1285–1295 (1971)
Scarr-Salapatek, S. Race, social class, and iq.Science174, 1285–1295 (1971). 17
1971
-
[26]
C., Jacobson, K
Rowe, D. C., Jacobson, K. C. & Van den Oord, E. J. Genetic and environmental influences on vocabulary iq: Parental education level as moderator.Child development70, 1151–1162 (1999)
1999
-
[27]
N., Haley, A., Waldron, M., D’Onofrio, B
Turkheimer, E. N., Haley, A., Waldron, M., D’Onofrio, B. M. & Gottesman, I. I. Socioeconomic status modifies heritability of IQ in young children.Psychological Science14, 623–628 (2003). URLhttp://pss.sagepub.com/content/14/6/623.full
2003
-
[28]
P., Turkheimer, E
Harden, K. P., Turkheimer, E. & Loehlin, J. C. Genotype by environment interaction in adolescents’ cognitive aptitude.Behavior Genetics37, 273–283 (2007)
2007
-
[29]
Hanscombe, K. B.et al.Socioeconomic status (ses) and children’s intelligence (iq): In a uk-representative sample ses moderates the environmental, not genetic, effect on iq.PLoS ONE7, e30320 (2012)
2012
-
[30]
Tucker-Drob, E. M. & Bates, T. C. Large cross-national differences in gene× socioeconomic status interaction on intelligence.Psychological science27, 138–149 (2016)
2016
-
[31]
W., Trejo, S., Armstrong-Carter, E
Domingue, B. W., Trejo, S., Armstrong-Carter, E. & Tucker-Drob, E. M. Interactions between polygenic scores and environments: Methodological and conceptual challenges.Sociological Science7, 465–486 (2020). URLhttp://dx.doi.org/10.15195/v7.a19
-
[32]
D.et al.Molecular genetic contributions to social deprivation and household income in uk biobank.Current Biology26, 3083–3089 (2016)
Hill, W. D.et al.Molecular genetic contributions to social deprivation and household income in uk biobank.Current Biology26, 3083–3089 (2016)
2016
-
[33]
J.et al.Gene discovery and polygenic prediction from a genome-wide association study of educational attainment in 1.1 million individuals.Nature Genetics50, 1112–1121 (2018)
Lee, J. J.et al.Gene discovery and polygenic prediction from a genome-wide association study of educational attainment in 1.1 million individuals.Nature Genetics50, 1112–1121 (2018)
2018
-
[34]
Yengo, L.et al.Meta-analysis of genome-wide association studies for height and body mass index in ˜700000 individuals of european ancestry.Human Molecular Genetics27, 3641–3649 (2018)
2018
-
[35]
Abdellaoui, A., Yengo, L., Verweij, K. J. H. & Visscher, P. M. 15 years of GWAS discovery: Realizing the promise.American Journal of Human Genetics110, 179–194 (2023)
2023
-
[36]
Nature Genetics47, 1236–1241 (2015)
Bulik-Sullivan, B.et al.An atlas of genetic correlations across human diseases and traits. Nature Genetics47, 1236–1241 (2015). 18
2015
-
[37]
Becker, J.et al.Resource profile and user guide of the polygenic index repository.Nature Human Behaviour5, 1744–1758 (2021)
2021
-
[38]
Meyers, J. L.et al.Interaction between polygenic risk for cigarette use and environmen- tal exposures in the Detroit neighborhood health study.Translational Psychiatry3, e290 (2013). URL http://dx.doi.org/10.1038/tp.2013.63http://www.nature.com/doifinder/ 10.1038/tp.2013.63
work page doi:10.1038/tp.2013.63http://www.nature.com/doifinder/ 2013
-
[39]
H., Carvalho, L
Barcellos, S. H., Carvalho, L. S. & Turley, P. Education can reduce health differences related to genetic risk of obesity.Proceedings of the National Academy of Sciences115, E9765–E9772 (2018)
2018
-
[40]
W., Conley, D., Fletcher, J
Domingue, B. W., Conley, D., Fletcher, J. & Boardman, J. D. Cohort effects in the genetic influence on smoking.Behavior Genetics46, 31–42 (2016)
2016
-
[41]
Fletcher, J. M. Why have tobacco control policies stalled? Using genetic moderation to examine policy impacts.PloS ONE7, e50576 (2012). URL http://www.pubmedcentral.nih. gov/articlerender.fcgi?artid=3515624{&}tool=pmcentrez{&}rendertype=abstract
2012
-
[42]
Schmitz, L. & Conley, D. The long-term consequences of Vietnam-era conscription and genotype on smoking behavior and health.Behavior Genetics46, 43–58 (2016). URL http://link.springer.com/10.1007/s10519-015-9739-1
-
[43]
L.et al.Testing familial transmission of smoking with two different research designs
Treur, J. L.et al.Testing familial transmission of smoking with two different research designs. Nicotine and Tobacco Research20, 836–842 (2018)
2018
-
[44]
Bierut, L., Biroli, P., Galama, T. J. & Thom, K. Challenges in studying the interplay of genes and environment. a study of childhood financial distress moderating genetic predisposition for peak smoking.Journal of Economic Psychology98, 102636 (2023)
2023
-
[45]
A., Verweij, K
Pasman, J. A., Verweij, K. J. & Vink, J. M. Systematic review of polygenic gene–environment interaction in tobacco, alcohol, and cannabis use.Behavior Genetics49, 349–365 (2019)
2019
-
[46]
P., Keers, R
Assary, E., Vincent, J. P., Keers, R. & Pluess, M. Gene-environment interaction and psychiatric disorders: Review and future directions. InSeminars in cell & developmental biology, vol. 77, 133–143 (Elsevier, 2018). 19
2018
-
[47]
Tyrrell, J.et al.Gene-obesogenic environment interactions in the UK Biobank study.Inter- national Journal of Epidemiology46, 559–575 (2017). URLhttps://doi.org/10.1093/ije/ dyw337.https://academic.oup.com/ije/article-pdf/46/2/559/24172372/dyw337.pdf
-
[48]
Amin, V.et al.Gene-environment interactions between education and body mass: Evidence from the UK and Finland.Social Science & Medicine195, 12–16 (2017)
2017
-
[49]
T., Amin, V., Behrman, J
Hoang, C. T., Amin, V., Behrman, J. R., Kohler, H.-P. & Kohler, I. V. Heterogenous trajectories in physical, mental and cognitive health among older americans: Roles of genetics and life course contextual factors.SSM-Population Health23, 101448 (2023)
2023
-
[50]
Papageorge, N. W. & Thom, K. Genes, education, and labor market outcomes: evidence from the health and retirement study.Journal of the European Economic Association18, 1351–1399 (2020)
2020
-
[51]
J., Bernardi, F., van Bergen, E
Ghirardi, G., Gil-Hernández, C. J., Bernardi, F., van Bergen, E. & Demange, P. Interaction of family SES with children’s genetic propensity for cognitive and noncognitive skills: No evidence of the Scarr-Rowe hypothesis for educational outcomes.Research in Social Stratification and Mobility92, 100960 (2024)
2024
-
[52]
& Bernardi, F
Ghirardi, G. & Bernardi, F. Compensating or boosting genetic propensities? Gene-family socioeconomic status interactions by educational outcome selectivity.Social Science Research 129, 103174 (2025)
2025
-
[53]
Sonnega, A.et al.Cohort profile: the Health and Retirement Study (HRS).Interna- tional Journal of Epidemiology43, 576–585 (2014). URL http://www.ncbi.nlm.nih. gov/pubmed/24671021http://www.pubmedcentral.nih.gov/articlerender.fcgi?artid= PMC3997380https://academic.oup.com/ije/article-lookup/doi/10.1093/ije/dyu067
-
[54]
& Roan, C
Herd, P., Carr, D. & Roan, C. Cohort profile: Wisconsin longitudinal study (wls).International Journal of Epidemiology43, 34–41 (2014)
2014
-
[55]
Steptoe, A., Breeze, E., Banks, J. & Nazroo, J. Cohort profile: The English Longitudinal Study of Ageing.International Journal of Epidemiology42, 1640–1648 (2013). URLhttps: //academic.oup.com/ije/article-lookup/doi/10.1093/ije/dys168. 20
-
[56]
A.et al.Social and genetic associations with educational performance in a scandinavian welfare state.Proceedings of the National Academy of Sciences119, e2201869119 (2022)
Isungset, M. A.et al.Social and genetic associations with educational performance in a scandinavian welfare state.Proceedings of the National Academy of Sciences119, e2201869119 (2022)
2022
-
[57]
Sterling, T. D. Publication decisions and their possible effects on inferences drawn from tests of significance—or vice versa.Journal of the American statistical association54, 30–34 (1959)
1959
-
[58]
& Simonovits, G
Franco, A., Malhotra, N. & Simonovits, G. Publication bias in the social sciences: Unlocking the file drawer.Science345, 1502–1505 (2014)
2014
-
[59]
Social sciences suffer from severe publication bias.Nature10(2014)
Peplow, M. Social sciences suffer from severe publication bias.Nature10(2014)
2014
-
[60]
Three laws of behavior genetics and what they mean.Current Directions in Psychological Science9, 160–164 (2000)
Turkheimer, E. Three laws of behavior genetics and what they mean.Current Directions in Psychological Science9, 160–164 (2000)
2000
-
[61]
& Manza, J
Hout, M., Brooks, C. & Manza, J. The persistence of classes in post-industrial societies. International Sociology8, 259–277 (1993)
1993
-
[62]
M., Ahonen, R
Siponen, S. M., Ahonen, R. S., Savolainen, P. H. & Hämeen-Anttila, K. P. Children’s health and parental socioeconomic factors: a population-based survey in finland.BMC Public Health 11, 1–8 (2011)
2011
-
[63]
Nature Communications14, 4473 (2023)
Van Kippersluis, H.et al.Overcoming attenuation bias in regressions using polygenic indices. Nature Communications14, 4473 (2023)
2023
-
[64]
E.et al.The long-term health consequences of child physical abuse, emotional abuse, and neglect: A systematic review and meta-analysis.PLoS Medicine9, e1001349 (2012)
Norman, R. E.et al.The long-term health consequences of child physical abuse, emotional abuse, and neglect: A systematic review and meta-analysis.PLoS Medicine9, e1001349 (2012)
2012
-
[65]
J., Thomas, H
Gardner, M. J., Thomas, H. J. & Erskine, H. E. The association between five forms of child maltreatment and depressive and anxiety disorders: A systematic review and meta-analysis. Child Abuse & Neglect96, 104082 (2019)
2019
-
[66]
D’arcy-Bewick, S.et al.Childhood abuse and neglect, and mortality risk in adulthood: A systematic review and meta-analysis.Child Abuse & Neglect134, 105922 (2022)
2022
-
[67]
H., Samson, J
Teicher, M. H., Samson, J. A., Anderson, C. M. & Ohashi, K. The effects of childhood maltreatment on brain structure, function and connectivity.Nature Reviews Neuroscience17, 652–666 (2016). 21
2016
-
[68]
A., Cicchetti, D., Rogosch, F
Cowell, R. A., Cicchetti, D., Rogosch, F. A. & Toth, S. L. Childhood maltreatment and its effect on neurocognitive functioning: Timing and chronicity matter.Development and Psychopathology27, 521–533 (2015)
2015
-
[69]
Teicher, M. H. & Samson, J. A. Annual research review: Enduring neurobiological effects of childhood abuse and neglect.Journal of Child Psychology and Psychiatry57, 241–266 (2016)
2016
-
[70]
& Conley, D
Johnson, R., Sotoudeh, R. & Conley, D. Polygenic scores for plasticity: a new tool for studying gene–environment interplay.Demography59, 1045–1070 (2022)
2022
-
[71]
L., Goodwin, J., Miao, J., Lu, Q
Schmitz, L. L., Goodwin, J., Miao, J., Lu, Q. & Conley, D. The impact of late-career job loss and genetic risk on body mass index: Evidence from variance polygenic scores.Scientific Reports11, 1–15 (2021)
2021
-
[72]
Miao, J.et al.Pigeon: a statistical framework for estimating gene–environment interaction for polygenic traits.Nature human behaviour9, 1654–1668 (2025)
2025
-
[73]
URLhttps://doi.org/10.1093/nar/gkt1229
Welter, D.et al.The NHGRI GWAS Catalog, a curated resource of SNP-trait associations.Nu- cleic Acids Research42, D1001–D1006 (2013). URLhttps://doi.org/10.1093/nar/gkt1229. https://academic.oup.com/nar/article-pdf/42/D1/D1001/3646160/gkt1229.pdf
-
[74]
Nature Genetics51, 1339–1348 (2019)
Watanabe, K.et al.A global overview of pleiotropy and genetic architecture in complex traits. Nature Genetics51, 1339–1348 (2019)
2019
-
[75]
Buniello, A.et al.The nhgri-ebi gwas catalog of published genome-wide association studies, targeted arrays and summary statistics 2019.Nucleic Acids Research47, D1005–D1012 (2019)
2019
-
[76]
T.et al.A tutorial on conducting genome-wide association studies: Quality control and statistical analysis.International Journal of Methods in Psychiatric Research27, e1608 (2018)
Marees, A. T.et al.A tutorial on conducting genome-wide association studies: Quality control and statistical analysis.International Journal of Methods in Psychiatric Research27, e1608 (2018)
2018
-
[77]
K.et al.Ld score regression distinguishes confounding from polygenicity in genome-wide association studies.Nature Genetics47, 291–295 (2015)
Bulik-Sullivan, B. K.et al.Ld score regression distinguishes confounding from polygenicity in genome-wide association studies.Nature Genetics47, 291–295 (2015)
2015
-
[78]
M.et al.Multivariate genome-wide analyses of the well-being spectrum.Nature genetics51, 445–451 (2019)
Baselmans, B. M.et al.Multivariate genome-wide analyses of the well-being spectrum.Nature genetics51, 445–451 (2019)
2019
-
[79]
R.et al.Genome-wide association analyses identify 44 risk variants and refine the genetic architecture of major depression.Nature genetics50, 668–681 (2018)
Wray, N. R.et al.Genome-wide association analyses identify 44 risk variants and refine the genetic architecture of major depression.Nature genetics50, 668–681 (2018). 22
2018
-
[80]
Howard, D. M.et al.Genome-wide meta-analysis of depression identifies 102 independent variants and highlights the importance of the prefrontal brain regions.Nature Neuroscience 22, 343–352 (2019)
2019
discussion (0)
Sign in with ORCID, Apple, or X to comment. Anyone can read and Pith papers without signing in.