Recognition: unknown
Control of relaxation properties of a macroscopic nuclear spin ensemble
Pith reviewed 2026-05-07 13:45 UTC · model grok-4.3
The pith
Laser illumination reduces the 207Pb nuclear T1 relaxation time by a factor of two in ferroelectric crystals.
A machine-rendered reading of the paper's core claim, the machinery that carries it, and where it could break.
Core claim
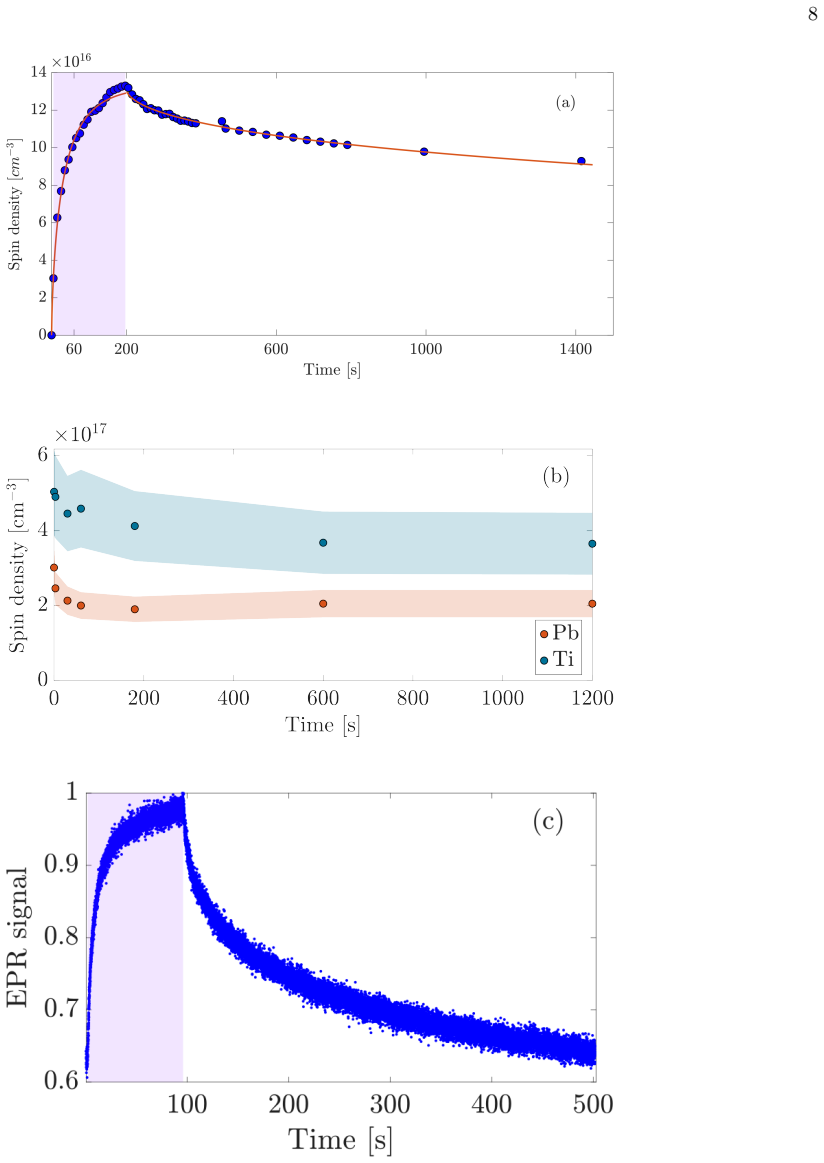
Using saturation-recovery nuclear magnetic resonance, laser illumination reduces the 207Pb nuclear T1 by approximately a factor of two, from (17 plus or minus 2) s to (7 plus or minus 1) s at 4.6 MHz and from (1550 plus or minus 40) s to (850 plus or minus 70) s at 40 MHz. X-band EPR at 10 K shows that 405 nm light creates Pb3+ centers in PbTiO3 and both Pb3+ and Ti3+ centers in PMN-PT, with measured spin densities on the order of 10^17 per cubic centimeter. Power-dependent EPR data and a model relating nuclear relaxation rate to photoinduced center density establish the causal link between the optically generated paramagnets and the observed shortening of T1.
What carries the argument
Photoinduced paramagnetic centers (Pb3+ and Ti3+) generated by 405 nm laser light, whose density sets the nuclear relaxation rate through hyperfine coupling to nearby 207Pb nuclei.
Where Pith is reading between the lines
- The same optical generation of paramagnetic centers could be tested in other solids that host nuclei with prohibitively long T1 times at low temperature.
- Rapid on-off switching of the laser could enable pulsed control of relaxation rates during an NMR acquisition sequence.
- The approach supplies an independent control knob that might be combined with existing methods for dynamic nuclear polarization.
Load-bearing premise
The observed reduction in nuclear T1 is caused primarily by the photoinduced paramagnetic centers whose density is measured by EPR, with negligible contributions from heating or other light-induced effects.
What would settle it
An experiment in which laser illumination creates the expected density of paramagnetic centers (confirmed by EPR) yet produces no measurable change in nuclear T1 would falsify the claimed mechanism.
Figures


read the original abstract
Macroscopic spin ensembles in solids are powerful platforms for quantum sensing and precision metrology. A key challenge is controlling the nuclear spin population relaxation time $T_1$, which can become prohibitively long at cryogenic temperatures due to phonon freeze-out. We demonstrate optical control of the $T_1$ relaxation time of the $^{207}$Pb nuclear spin ensemble in lead-containing ferroelectric crystals PbTiO$_3$ (PT) and (PbMg$_{1/3}$Nb$_{2/3}$O$_3$)$_{2/3}$-(PbTiO$_3$)$_{1/3}$ (PMN-PT). Using X-band electron paramagnetic resonance (EPR) spectroscopy at 10 K, we characterize light-induced paramagnetic centers created by 405 nm laser illumination. In PT, we observe paramagnetic Pb$^{3+}$ centers and their hyperfine interaction with nearby nuclear spins. In PMN-PT, we identify two populations: isotropic Pb$^{3+}$ centers and anisotropic Ti$^{3+}$ centers occupying $d$-orbitals, with spin number densities of $(2.5 \pm 1.0) \times 10^{17}$ cm$^{-3}$ and $(4.1 \pm 1.7) \times 10^{17}$ cm$^{-3}$, respectively. Power-dependent EPR measurements enable extraction of spin relaxation times. We investigate the ionization and recombination dynamics of these transient paramagnetic centers. Using saturation-recovery nuclear magnetic resonance, we demonstrate that laser illumination reduces the $^{207}$Pb nuclear $T_1$ by approximately a factor of two, from $(17 \pm 2)$ s to $(7 \pm 1)$ s at 4.6 MHz, and from $(1550 \pm 40)$ s to $(850 \pm 70)$ s at 40 MHz. We develop a model relating the nuclear relaxation rate to the density of photoinduced paramagnetic centers. This optical control of nuclear spin relaxation provides a pathway toward accelerated thermal polarization and dynamic nuclear polarization in solid-state NMR-based precision measurements, including searches for axion-like dark matter.
Editorial analysis
A structured set of objections, weighed in public.
Referee Report
Summary. The manuscript demonstrates optical control of the 207Pb nuclear spin T1 relaxation time in PbTiO3 and PMN-PT ferroelectric crystals. X-band EPR at 10 K characterizes 405 nm laser-induced paramagnetic centers (Pb3+ in PT; isotropic Pb3+ and anisotropic Ti3+ in PMN-PT) with measured spin densities of order 10^17 cm^{-3}. Saturation-recovery NMR shows laser illumination reduces T1 by a factor of ~2, from (17±2) s to (7±1) s at 4.6 MHz and from (1550±40) s to (850±70) s at 40 MHz. A model is developed relating the nuclear relaxation rate to the density of these photoinduced centers, with controls for temperature and non-paramagnetic optical effects.
Significance. If the attribution holds, the result supplies a concrete route to shorten long cryogenic nuclear T1 times via optical generation of paramagnetic centers, enabling faster thermal polarization and DNP in solid-state NMR. The use of independent EPR density measurements and NMR T1 data, plus explicit checks against heating, provides a falsifiable link between center density and relaxation rate that could be tested in other host lattices.
major comments (2)
- [model section (post-EPR and NMR results)] The model relating nuclear relaxation rate to photoinduced center density is described only as 'developed' in the abstract and sketched in the text; no explicit formula, derivation, or quantitative prediction of the observed factor-of-two reduction from the reported EPR densities ((2.5±1.0)×10^17 cm^{-3} and (4.1±1.7)×10^17 cm^{-3}) is provided. This link is load-bearing for the claim that the T1 shortening is caused primarily by the centers rather than other light-induced effects.
- [NMR results and methods] The saturation-recovery NMR data at the two frequencies are presented with error bars, but the manuscript does not show the raw recovery curves or detail how the fitting accounts for possible multi-exponential behavior or residual light-induced heating gradients that could mimic a factor-of-two change.
minor comments (2)
- [abstract and NMR section] The abstract states T1 values at '4.6 MHz' and '40 MHz' without specifying the corresponding static magnetic fields or confirming that both frequencies probe the same 207Pb ensemble in the same sample orientation.
- [EPR characterization] Power-dependent EPR data are mentioned for extracting spin relaxation times, but the resulting T1e or T2e values are not tabulated or compared to the nuclear T1 reduction.
Simulated Author's Rebuttal
We thank the referee for their careful reading of the manuscript and constructive comments. We address each major point below and will revise the manuscript to incorporate the requested details.
read point-by-point responses
-
Referee: The model relating nuclear relaxation rate to photoinduced center density is described only as 'developed' in the abstract and sketched in the text; no explicit formula, derivation, or quantitative prediction of the observed factor-of-two reduction from the reported EPR densities ((2.5±1.0)×10^17 cm^{-3} and (4.1±1.7)×10^17 cm^{-3}) is provided. This link is load-bearing for the claim that the T1 shortening is caused primarily by the centers rather than other light-induced effects.
Authors: We agree that the model section requires expansion for clarity and rigor. In the revised manuscript, we will present the explicit formula for the paramagnetic-center-induced nuclear relaxation rate (1/T1 ∝ n * (dipolar coupling strength)^2 * spectral density at the nuclear Larmor frequency), include a step-by-step derivation from standard relaxation theory, and provide a quantitative estimate using the measured EPR densities to show consistency with the observed factor-of-two T1 reduction. This will strengthen the causal link and address alternative explanations. revision: yes
-
Referee: The saturation-recovery NMR data at the two frequencies are presented with error bars, but the manuscript does not show the raw recovery curves or detail how the fitting accounts for possible multi-exponential behavior or residual light-induced heating gradients that could mimic a factor-of-two change.
Authors: We will add the raw saturation-recovery curves (with and without illumination) to the revised manuscript or as supplementary figures. We will also expand the methods section to detail the single-exponential fitting procedure, explicit checks for multi-exponential components (e.g., via residual analysis), and controls for heating (temperature monitoring during illumination, power-dependence studies, and comparison to non-paramagnetic optical effects) confirming that gradients do not account for the observed T1 change. revision: yes
Circularity Check
No significant circularity in derivation chain
full rationale
The paper's central claims rest on two independent experimental observables: nuclear T1 measured directly via saturation-recovery NMR (at 4.6 MHz and 40 MHz) and photoinduced paramagnetic center densities measured via separate X-band EPR spectroscopy. The model relating nuclear relaxation rate to center density is presented as a theoretical connection between these distinct data sets rather than a fit of one quantity to itself. No self-definitional steps, fitted inputs renamed as predictions, load-bearing self-citations, uniqueness theorems, or ansatz smuggling are present in the provided text. The derivation chain is self-contained against external benchmarks.
Axiom & Free-Parameter Ledger
free parameters (1)
- photoinduced center densities =
(2.5 ± 1.0) × 10^17 and (4.1 ± 1.7) × 10^17 cm^{-3}
axioms (1)
- domain assumption Interaction with photoinduced paramagnetic centers is the dominant mechanism controlling the observed change in nuclear T1
Reference graph
Works this paper leans on
-
[1]
The termγ2B2 1τ1τ2 is responsible for spin saturation by the microwave drive
The homogeneous lineshape The homogeneous spin absorption lineshape is given by the Lorenzian function: h(ω−ω′) = 1 π τ2 1 +γ2B2 1τ1τ2 + (ω−ω′)2τ2 2 ,(B1) whereω′is the spin resonance angular frequency,τ1 is the spin population relaxation time, andτ2 is the spin coherence relaxation time. The termγ2B2 1τ1τ2 is responsible for spin saturation by the microw...
-
[2]
The overall lineshape The overall absorption lineshapeL(ω)is given by the convolution (A8) of the inhomogeneousf(ω′)with the homogeneous lineshapeh(ω−ω′), given by eq. (B1). We estimate the width of the homogeneous line from the experimental results obtained with PbTiO3 sample. The EPR absorption linewidths measured for PMN-PT are significantly broader, t...
-
[3]
The electronic g-tensor in the materials we study can be accurately approximated to be uniaxial [20]
Inhomogeneous broadening due to g-factor anisotropy The dominant static term in the electron spin Hamiltonian is the Zeeman interaction: HZ =µB ∑ αβ gαβBαSβ (B6) whereµB is the Bohr magneton,Bis the bias magnetic field,gis the g-tensor,Sis the electronic spin operator, and the sum is over Cartesian componentsα,β∈{x,y,z}. The electronic g-tensor in the mat...
-
[4]
Inhomogeneous broadening due to unresolved isotropic hyperfine interaction The PMN-PT crystal lattice has a high density of nuclear spins, dominated by93Nb (I= 9/2, 100% abundance, gyromagnetic ratio2π×10 MHz/T, nuclear quadrupole moment -0.32barn). Due to the large number of nuclear spins that interact with any given paramagnetic center, the individual h...
-
[5]
The electron spins localized on the Pb3+ ions have isotropic g-factors, because the electrons occupy symmetric s-orbitals [20]
Overall lineshapes in PMN-PT EPR In this study we model two populations of light-induced paramagnetic centers: localized on the Pb3+ and on the Ti3+ ions. The electron spins localized on the Pb3+ ions have isotropic g-factors, because the electrons occupy symmetric s-orbitals [20]. The dominant source of inhomogeneous broadening is the unresolved hyperfin...
-
[6]
The microwave power dependence In this section, we consider how the EPR spectrum depends on the microwave power. This will allow us to use our data to extract the spin densities and the product ofτ1τ2, and therefore estimate the contribution of electrons to the nuclearT 1 time in separate NMR experiments. The voltage detected by an EPR spectrometer is [27...
-
[7]
Extracting sample spin densities and relaxation times We modeled the measured EPR spectra using Eq. (C8). The fit parameters were the weightsAPb,ATi, the Pb3+ linewidth∆ Pb, and line centerB Pb (which we expressed in terms of the g-factorgPb =ℏω0/µBBPb), the Ti3+ linewidth∆ Ti, and Ti anisotropy parametersB∥,B⊥(which we expressed in terms of the g-factors...
-
[8]
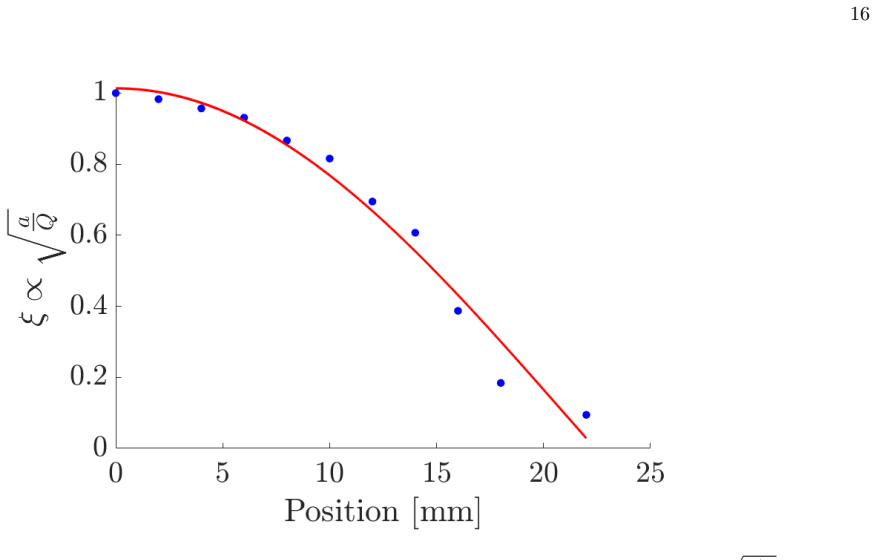
Therefore the sample was placed15 mmaway from the center of the cavity, where the microwave field was smaller and the cavity loss was tolerable
Calibration ofΛandξ(x) Dielectric losses in the PMT-PT sample prevented us from being able to tune the cavity if the sample was placed at the cavity center. Therefore the sample was placed15 mmaway from the center of the cavity, where the microwave field was smaller and the cavity loss was tolerable. In order to estimate the number of spins and relaxation...
- [9]
-
[10]
M. S. Safronova, D. Budker, D. Demille, D. F. Kimball, A. Derevianko, and C. W. Clark, Reviews of Modern Physics90, 025008 (2018), arXiv:1710.01833
work page Pith review arXiv 2018
-
[11]
S. E. Kuenstner, D. W. Smith, A. J. Winter, E. Ozdemir, T. Marić, A. Matthews, and A. O. Sushkov, Nature Physics , https://doi.org/10.1038/s41567 (2026)
-
[12]
Abragam,The Principles of Nuclear Magnetism(Oxford University Press, 1961)
A. Abragam,The Principles of Nuclear Magnetism(Oxford University Press, 1961)
1961
-
[13]
Bloembergen, E
N. Bloembergen, E. M. Purcell, and R. V. Pound, Physical Review73, 679 (1948)
1948
-
[14]
A. Bienfait, J. J. Pla, Y. Kubo, X. Zhou, M. Stern, C. C. Lo, C. D. Weis, T. Schenkel, D. Vion, D. Esteve, J. J. Morton, and P. Bertet, Nature531, 74 (2016), arXiv:1508.06148
-
[15]
R. R. Ernst, G. Bodenhausen, and A. Wokaun,Principles of Nuclear Magnetic Resonance in One and Two Dimensions (Oxford University Press, 1990)
1990
-
[16]
Levitt,Spin Dynamics: Basics of Nuclear Magnetic Resonance(Wiley, 2008)
M. Levitt,Spin Dynamics: Basics of Nuclear Magnetic Resonance(Wiley, 2008)
2008
-
[17]
Albanese, S
B. Albanese, S. Probst, V. Ranjan, C. W. Zollitsch, M. Pechal, A. Wallraff, J. J. L. Morton, D. Vion, D. Esteve, E. Flurin, and P. Bertet, Nature Physics16, 751 (2020)
2020
-
[18]
Goldman, Physical Review138, A1675 (1965)
M. Goldman, Physical Review138, A1675 (1965)
1965
-
[19]
H. W. van Kesteren, W. Th. Wenckebach, and J. Schmidt, Physical Review Letters55, 1642 (1985)
1985
-
[20]
Diller, S
A. Diller, S. Prakash, A. Alia, P. Gast, J. Matysik, and G. Jeschke, The Journal of Physical Chemistry B111, 10606 (2007)
2007
-
[21]
Dommaschk, M
M. Dommaschk, M. Peters, F. Gutzeit, C. Schütt, C. Näther, F. D. Sönnichsen, S. Tiwari, C. Riedel, S. Boretius, and R. Herges, Journal of the American Chemical Society137, 7552 (2015)
2015
-
[22]
D. J. Michalak, S. Xu, T. J. Lowery, C. W. Crawford, M. Ledbetter, L.-S. Bouchard, D. E. Wemmer, D. Budker, and A. Pines, Magnetic Resonance in Medicine66, 603 (2011)
2011
-
[23]
Budker, P
D. Budker, P. W. Graham, M. Ledbetter, S. Rajendran, and A. O. Sushkov, Physical Review X4, 021030 (2014)
2014
-
[24]
D. Aybas, J. Adam, E. Blumenthal, A. V. Gramolin, D. Johnson, A. Kleyheeg, S. Afach, J. W. Blanchard, G. P. Centers, A. Garcon, M. Engler, N. L. Figueroa, M. G. Sendra, A. Wickenbrock, M. Lawson, T. Wang, T. Wu, H. Luo, H. Mani, P. Mauskopf, P. W. Graham, S. Rajendran, D. F. Kimball, D. Budker, and A. O. Sushkov, Physical Review Letters126, 141802 (2021),...
- [25]
-
[26]
V. V. Laguta, M. D. Glinchuk, A. M. Slipenyuk, and I. P. Bykov, Physics of the Solid State42, 2258 (2000)
2000
-
[27]
Warren and J
W. Warren and J. Robertson, Physical Review B - Condensed Matter and Materials Physics53, 3080 (1996)
1996
-
[28]
W. L. Warren, B. A. Tuttle, P. J. McWhorter, F. C. Rong, and E. H. Poindexter, Applied Physics Letters62, 482 (1993)
1993
-
[29]
W. L. Warren, C. H. Seager, D. Dimos, and E. J. Friebele, Applied Physics Letters61, 2530 (1992)
1992
-
[30]
Gómez-Vidales, G
V. Gómez-Vidales, G. Granados-Oliveros, A. Nieto-Camacho, M. Reyes-Solís, and M. Jiménez-Estrada, RSC Advances4, 1371 (2013)
2013
-
[31]
D. R. Cooper, N. M. Dimitrijevic, and J. L. Nadeau, Nanoscale2, 114 (2010)
2010
-
[32]
R. H. Sands, Physical Review99, 1222 (1955)
1955
-
[33]
A "missing" family of classical orthogonal polynomials
A. Abragam and B. Bleaney,Electron Paramagnetic Resonance of Transition Ions(Clarendon P., 1970) arXiv:1011.1669v3
work page Pith review arXiv 1970
-
[34]
B. L. Bales, M. Peric, and M. T. Lamy-Freund, Journal of Magnetic Resonance132, 279 (1998)
1998
-
[35]
G. R. Eaton, S. S. Eaton, D. P. Barr, and R. T. Weber,Quantitative EPR(Springer, Vienna, 2010)
2010
-
[36]
Bairavarasu, M
S. Bairavarasu, M. E. Edwards, M. D. Sastry, F. Kochary, D. Lianos, and M. D. Aggarwal, inPhotorefractive Fiber and Crystal Devices: Materials, Optical Properties, and Applications XII, Vol. 6314 (SPIE, 2006) pp. 42–48
2006
-
[37]
J. S. Waugh and C. P. Slichter, Physical Review B37, 4337 (1988)
1988
-
[38]
G. R. Khutsishvili, Physics-Uspekhi11, 802 (1969)
1969
-
[39]
P. M. Henrichs, M. L. Cofield, R. H. Young, and J. Michael Hewitt, Journal of Magnetic Resonance (1969)58, 85 (1984)
1969
-
[40]
Adam,Search for Axion Dark Matter Using Solid State Nuclear Magnetic Resonance and Superconducting Magnetome- ters, Ph.D
J. Adam,Search for Axion Dark Matter Using Solid State Nuclear Magnetic Resonance and Superconducting Magnetome- ters, Ph.D. thesis, ProQuest Dissertations & Theses (2023)
2023
- [41]
-
[42]
Budker, S
D. Budker, S. K. Lamoreaux, A. O. Sushkov, and O. P. Sushkov, Physical Review A73, 022107 (2006). 19
2006
-
[43]
DeMille, J
D. DeMille, J. M. Doyle, and A. O. Sushkov, Science357, 990 (2017)
2017
- [44]
- [45]
- [46]
-
[47]
A. O. Sushkov, O. P. Sushkov, and A. Yaresko, Physical Review A107, 062823 (2023)
2023
-
[48]
A. M. Portis, Physical Review91, 1071 (1953)
1953
-
[49]
Y. Wang, Z. Wang, W. Ge, C. Luo, J. Li, D. Viehland, J. Chen, and H. Luo, Physical Review B90, 134107 (2014)
2014
-
[50]
K. M. More, G. R. Eaton, and S. S. Eaton, Journal of Magnetic Resonance (1969)60, 54 (1984)
1969
-
[51]
D. P. Dalal, S. S. Eaton, and G. R. Eaton, Journal of Magnetic Resonance (1969)44, 415 (1981)
1969
-
[52]
J. W. H. Schreurs and G. K. Fraenkel, The Journal of Chemical Physics34, 756 (1961)
1961
discussion (0)
Sign in with ORCID, Apple, or X to comment. Anyone can read and Pith papers without signing in.