Recognition: unknown
Correcting Performance Estimation Bias in Imbalanced Classification with Minority Subconcepts
Pith reviewed 2026-05-07 16:17 UTC · model grok-4.3
The pith
Predicted subconcept posteriors yield a utility-weighted accuracy metric that corrects bias in imbalanced classification.
A machine-rendered reading of the paper's core claim, the machinery that carries it, and where it could break.
Core claim
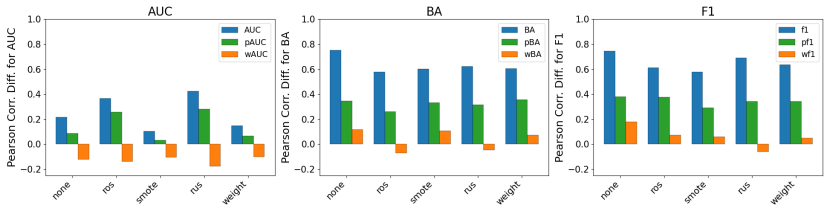
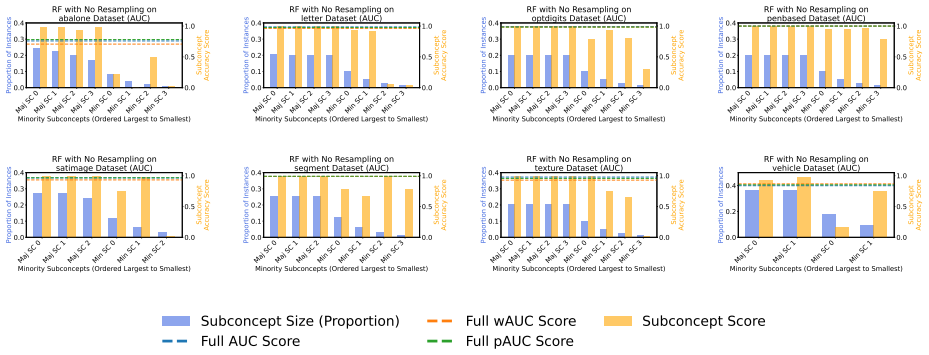
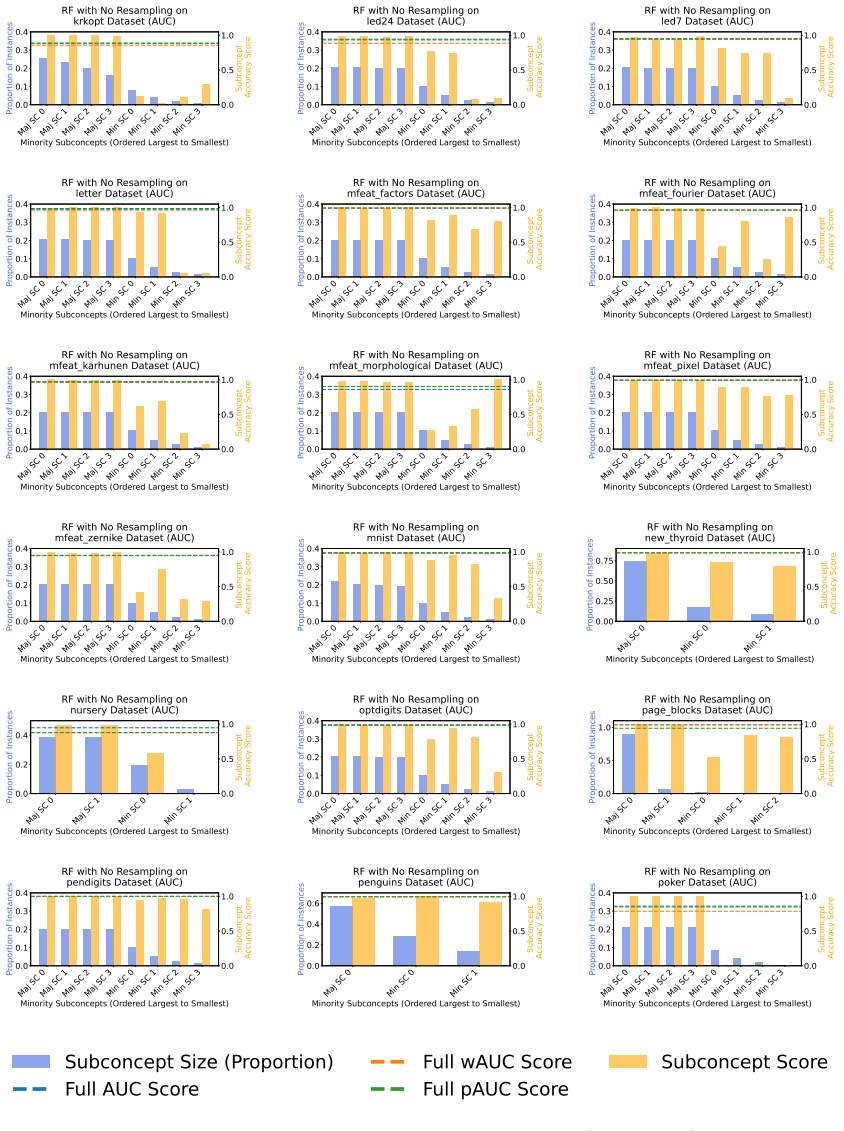
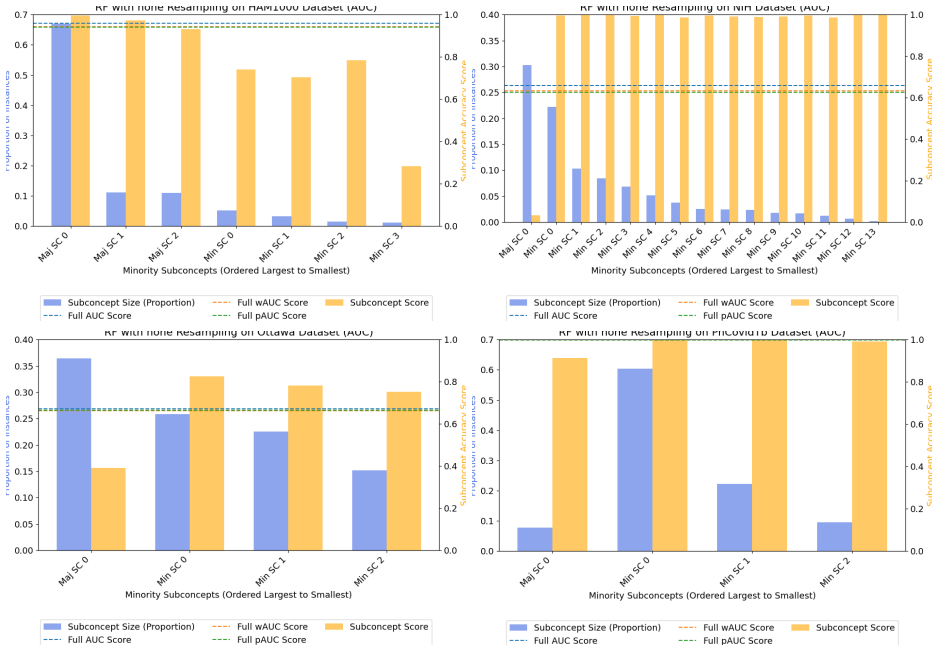
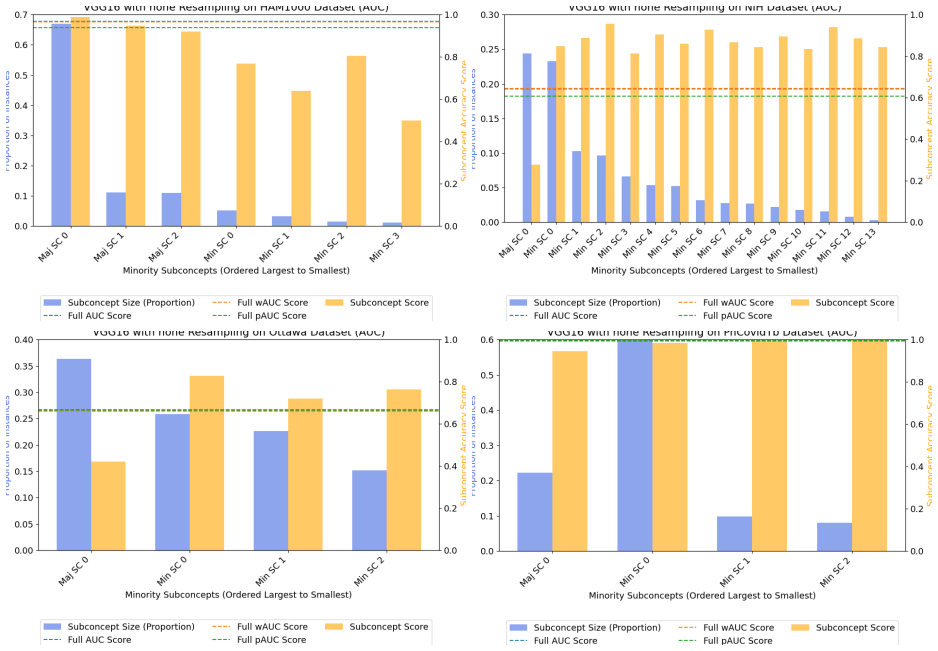
Class-level evaluation conceals substantial performance disparities across subconcepts within the same class. Common measures for imbalanced classification are biased toward larger minority subconcepts, but utility-based reweighting that uses predicted posterior probabilities from a multiclass subconcept model in place of true labels produces a practical, uncertainty-aware metric called predicted-weighted balanced accuracy (pBA).
What carries the argument
predicted-weighted balanced accuracy (pBA), which sets evaluation weights to the expected utility under the posterior distribution returned by a multiclass subconcept model rather than requiring true subconcept labels at test time.
If this is right
- Unweighted scores become misleading once subconcept distributions inside a class are uneven.
- pBA supplies more stable and interpretable performance numbers under the same conditions.
- The correction works without access to true subconcept labels during evaluation.
- Utility reweighting based on posteriors reduces the bias that standard metrics exhibit toward larger subconcepts.
Where Pith is reading between the lines
- If pBA tracks the oracle utility-weighted score closely on labeled test sets, it could replace standard metrics in production monitoring pipelines.
- Widespread use of pBA might push training objectives to balance performance across subconcepts instead of optimizing only for class-level averages.
- The same posterior-based weighting could be applied to other metrics such as F1 or AUC without changing the underlying subconcept model.
Load-bearing premise
The multiclass subconcept model supplies posterior probabilities accurate enough to compute expected utilities without introducing new biases.
What would settle it
On datasets that retain true subconcept labels at test time, compute both pBA and the oracle utility-weighted balanced accuracy and check whether their difference shrinks compared with the gap between unweighted balanced accuracy and the oracle.
Figures


read the original abstract
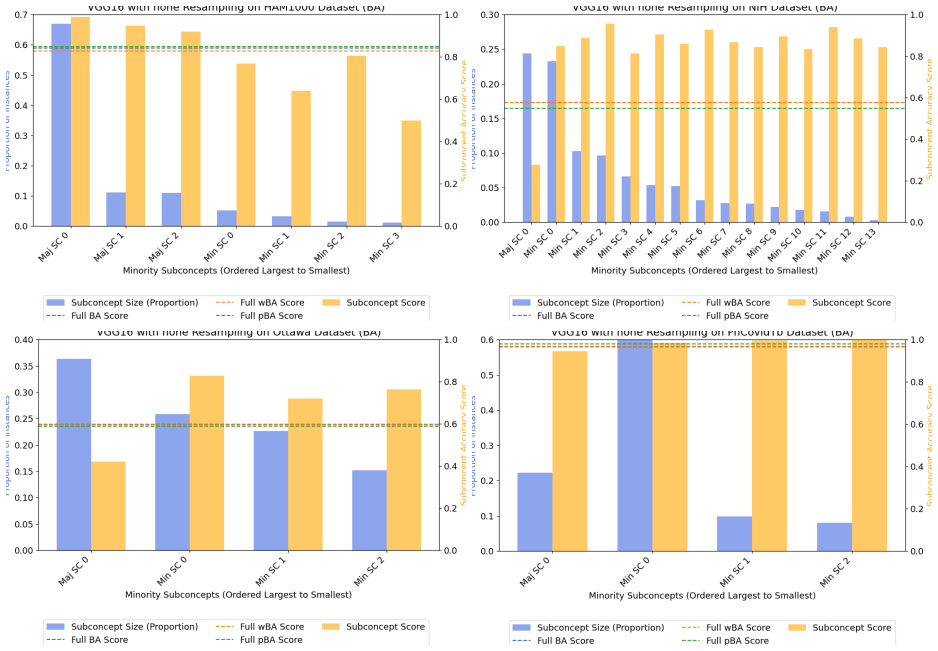
Class-level evaluation can conceal substantial performance disparities across subconcepts within the same class, causing models that perform well on average to fail on specific subpopulations. Prior work has shown that common evaluation measures for imbalanced classification are biased toward larger minority subconcepts and that utility-based reweighting using true subconcept labels can mitigate this bias; however, such labels are rarely available at test time. We introduce a practical utility-weighted evaluation that replaces unavailable subconcept labels with predicted posterior probabilities from a multiclass subconcept model. Evaluation weights are defined as the expected utility under this posterior, yielding a soft, uncertainty-aware metric we call predicted-weighted balanced accuracy (pBA). Experiments on tabular benchmarks as well as medical-imaging and text datasets show that unweighted scores can be misleading under within-class heterogeneity, while pBA provides more stable and interpretable assessments when subconcept distributions are uneven but not pathological. Our code is available at: https://anonymous.4open.science/r/correcting-bias-imbalance-9C6C/.
Editorial analysis
A structured set of objections, weighed in public.
Referee Report
Summary. The paper claims that standard evaluation metrics for imbalanced classification (e.g., balanced accuracy) are biased toward larger minority subconcepts when within-class heterogeneity exists, and introduces predicted-weighted balanced accuracy (pBA) as a practical alternative. pBA replaces unavailable true subconcept labels with expected utilities computed from posterior probabilities of a separate multiclass subconcept model, yielding a soft-weighted metric. Experiments on tabular benchmarks plus medical-imaging and text datasets are said to demonstrate that unweighted scores can be misleading while pBA provides more stable, interpretable assessments when subconcept distributions are uneven but not pathological.
Significance. If the central claim holds after addressing robustness concerns, the work offers a pragmatic tool for fairer performance estimation in heterogeneous classes without requiring test-time subconcept labels. This is relevant for safety-critical domains like medical imaging. The anonymous code link supports reproducibility, but the significance is tempered by the unexamined dependence on subconcept-model quality.
major comments (2)
- [Abstract] Abstract and experimental description: The claim that pBA corrects bias and yields more stable assessments rests on the multiclass subconcept model supplying accurate, calibrated posteriors for expected-utility weighting. No details are given on subconcept-model training, calibration diagnostics, or sensitivity to posterior error (e.g., overlapping subconcepts or limited subconcept labels), which directly undermines the load-bearing assumption that soft weights faithfully represent the true subconcept distribution.
- [Method] Method section (pBA definition): The utility weights for subconcepts are listed as free parameters; the paper must clarify how these are chosen or estimated and demonstrate that the resulting metric remains stable under reasonable perturbations of the weight vector, otherwise the correction may simply trade one form of bias for another.
minor comments (2)
- [Abstract] The anonymous code repository link should be replaced with a permanent archive (e.g., Zenodo) in the camera-ready version to ensure long-term reproducibility.
- [Throughout] Ensure consistent notation for posterior probabilities and expected utilities across equations and text; define pBA explicitly on first use.
Simulated Author's Rebuttal
We thank the referee for the constructive feedback. We agree that the manuscript requires additional details on the subconcept model and clarification on utility weights to fully support the claims. We address each major comment below and will incorporate revisions in the next version.
read point-by-point responses
-
Referee: [Abstract] Abstract and experimental description: The claim that pBA corrects bias and yields more stable assessments rests on the multiclass subconcept model supplying accurate, calibrated posteriors for expected-utility weighting. No details are given on subconcept-model training, calibration diagnostics, or sensitivity to posterior error (e.g., overlapping subconcepts or limited subconcept labels), which directly undermines the load-bearing assumption that soft weights faithfully represent the true subconcept distribution.
Authors: We agree that the reliability of pBA depends critically on the subconcept posterior quality. The revised manuscript will expand the Methods section with a new subsection describing subconcept model training (using available subconcept labels from the training set, architecture choices, and optimization), calibration procedures (e.g., temperature scaling with reported ECE values), and explicit sensitivity experiments. These will include controlled perturbations to posteriors, simulated overlapping subconcepts, and reduced label regimes on the benchmark datasets to empirically validate that pBA remains informative under realistic error levels. revision: yes
-
Referee: [Method] Method section (pBA definition): The utility weights for subconcepts are listed as free parameters; the paper must clarify how these are chosen or estimated and demonstrate that the resulting metric remains stable under reasonable perturbations of the weight vector, otherwise the correction may simply trade one form of bias for another.
Authors: The utility weights are domain-informed parameters that encode relative importance. In the original work they were set either uniformly or inversely to observed subconcept frequencies in the training data to emphasize rarer subconcepts; this choice will now be stated explicitly in the Methods. We will add both a clear default recommendation and an ablation study that perturbs the weight vector by ±25% around the chosen values, reporting that pBA values and model rankings remain stable across all tabular, imaging, and text benchmarks. This directly addresses the risk of trading one bias for another. revision: yes
Circularity Check
No significant circularity in pBA definition or claims
full rationale
The paper defines pBA directly as expected utility computed from a separate multiclass subconcept model's predicted posteriors, replacing unavailable true labels. This is an explicit definitional construction presented as a practical alternative, not derived from or reducing to the experimental results or fitted parameters. Experiments on tabular, imaging, and text data are offered as independent validation showing stability under uneven subconcept distributions. No equations, self-citations, or uniqueness theorems are invoked that would force the central claims back to the inputs by construction. The assumption of sufficiently accurate posteriors is stated as a modeling choice rather than a self-referential loop.
Axiom & Free-Parameter Ledger
free parameters (1)
- utility weights for subconcepts
axioms (1)
- domain assumption A multiclass subconcept model can be trained to produce reliable posterior probabilities over subconcepts within the minority class.
Reference graph
Works this paper leans on
-
[1]
Bellinger, R
C. Bellinger, R. Corizzo, and N. Japkowicz , Performance estimation bias in class imbalance with minority subconcepts , in Proceedings of the Fifth International Workshop on Learning with Imbalanced Domains: Theory and Applications, N. Moniz, P. Branco, L. Torgo, N. Japkowicz, M. Wozniak, and S. Wang, eds., vol. 241 of Proceedings of Machine Learning Rese...
2024
-
[2]
Branco, L
P. Branco, L. Torgo, and R. P. Ribeiro , A survey of predictive modeling on imbalanced domains , ACM Computing Surveys (CSUR), 49 (2016), pp. 1 -- 50
2016
-
[3]
K. Cao, C. Wei, A. Gaidon, N. Ar \'e chiga, and T. Ma , Learning imbalanced datasets with label-distribution-aware margin loss , in Advances in Neural Information Processing Systems, 2019, pp. 1565--1576, https://dblp.org/rec/conf/nips/CaoWGAM19
2019
-
[4]
W. Chen, K. Yang, Z. Yu, Y. Shi, and C. L. P. Chen , A survey on imbalanced learning: latest research, applications and future directions , Artificial Intelligence Review, 57 (2024), p. 137, https://doi.org/10.1007/S10462-024-10759-6, https://dblp.org/rec/journals/air/ChenYYSC24
-
[5]
Y. Cui, M. Jia, T.-Y. Lin, Y. Song, and S. J. Belongie , Class-balanced loss based on effective number of samples , in IEEE/CVF Conference on Computer Vision and Pattern Recognition, 2019, pp. 9268--9277, https://doi.org/10.1109/CVPR.2019.00949, https://dblp.org/rec/conf/cvpr/CuiJLSB19
-
[6]
R. Gomez, J. Gibert, L. G \'o mez, and D. Karatzas , Exploring hate speech detection in multimodal publications , in IEEE/CVF Winter Conference on Applications of Computer Vision, 2020, pp. 1459--1467, https://doi.org/10.1109/WACV45572.2020.9093414, https://dblp.org/rec/conf/wacv/GomezGGK20
-
[7]
He and E
H. He and E. A. Garcia , Learning from imbalanced data , IEEE Transactions on Knowledge and Data Engineering, 21 (2009), pp. 1263--1284
2009
-
[8]
N. Japkowicz , Concept-learning in the presence of between-class and within-class imbalances , in Proceedings of the 14th Conference of the Canadian Society for Computational Studies of Intelligence, 2001, pp. 67--77, https://doi.org/10.1007/3-540-45153-6_7, https://dblp.org/rec/conf/ai/Japkowicz01
-
[9]
Japkowicz and S
N. Japkowicz and S. Stephen , The class imbalance problem: A systematic study , Intell. Data Anal., 6 (2002), pp. 429--449
2002
-
[10]
Jo and N
T. Jo and N. Japkowicz , Class imbalances versus small disjuncts , SIGKDD Explor., 6 (2004), pp. 40--49
2004
-
[11]
B. Kang, S. Xie, M. Rohrbach, Z. Yan, A. Gordo, J. Feng, and Y. Kalantidis , Decoupling representation and classifier for long-tailed recognition , in International Conference on Learning Representations, 2020, https://dblp.org/rec/conf/iclr/KangXRYGFK20
2020
-
[12]
P. W. Koh, S. Sagawa, H. Marklund, S. M. Xie, M. Zhang, A. Balsubramani, W. Hu, M. Yasunaga, R. L. Phillips, I. Gao, T. Lee, E. David, I. Stavness, W. Guo, B. Earnshaw, I. S. Haque, S. M. Beery, J. Leskovec, A. Kundaje, E. Pierson, S. Levine, C. Finn, and P. Liang , Wilds: A benchmark of in-the-wild distribution shifts , in Proceedings of the 38th Interna...
2021
-
[13]
B. Krawczyk , Learning from imbalanced data: open challenges and future directions , Progress in Artificial Intelligence, 5 (2016), pp. 221--232, https://doi.org/10.1007/S13748-016-0094-0, https://dblp.org/rec/journals/pai/Krawczyk16
-
[14]
Kub \'a t, R
M. Kub \'a t, R. C. Holte, and S. Matwin , Machine learning for the detection of oil spills in satellite radar images , Machine Learning, 30 (1998), pp. 195--215
1998
-
[15]
C. X. Ling and C. Li , Data mining for direct marketing: Problems and solutions , in Knowledge Discovery and Data Mining, 1998
1998
-
[16]
E. Z. Liu, B. Haghgoo, A. S. Chen, A. Raghunathan, P. W. Koh, S. Sagawa, P. Liang, and C. Finn , Just train twice: Improving group robustness without training group information , in Proceedings of the 38th International Conference on Machine Learning, 2021, pp. 6781--6792, https://dblp.org/rec/conf/icml/LiuHCRKSLF21
2021
-
[17]
V. L \'o pez, A. Fern \'a ndez, S. Garc \'i a, V. Palade, and F. Herrera , An insight into classification with imbalanced data: Empirical results and current trends on using data intrinsic characteristics , Information Sciences, 250 (2013), pp. 113--141, https://doi.org/10.1016/J.INS.2013.07.007, https://dblp.org/rec/journals/isci/LopezFGPH13
-
[18]
L. Oakden-Rayner, J. Dunnmon, G. Carneiro, and C. R \'e , Hidden stratification causes clinically meaningful failures in machine learning for medical imaging , in Proceedings of the ACM Conference on Health, Inference, and Learning, 2020, pp. 151--159, https://doi.org/10.1145/3368555.3384468, https://dblp.org/rec/conf/chil/Oakden-RaynerDC20
-
[19]
R. S. Olson, W. La Cava, P. Orzechowski, R. J. Urbanowicz, and J. H. Moore , Pmlb: a large benchmark suite for machine learning evaluation and comparison , BioData Mining, 10 (2017), pp. 1--13
2017
-
[20]
R. C. Prati, G. E. A. P. A. Batista, and M. C. Monard , Class imbalances versus class overlapping: An analysis of a learning system behavior , in Mexican International Conference on Artificial Intelligence, 2004
2004
-
[21]
J. Ren, C. Yu, S. Sheng, X. Ma, H. Zhao, S. Yi, and H. Li , Balanced meta-softmax for long-tailed visual recognition , in Advances in Neural Information Processing Systems, 2020, https://dblp.org/rec/conf/nips/RenYSMZYL20
2020
-
[22]
S. Sagawa, P. W. Koh, T. B. Hashimoto, and P. Liang , Distributionally robust neural networks for group shifts: On the importance of regularization for worst-case generalization , CoRR, abs/1911.08731 (2019), https://dblp.org/rec/journals/corr/abs-1911-08731
work page internal anchor Pith review arXiv 1911
-
[23]
Scientific Data5(1), 180161 (Aug 2018)
P. Tschandl, C. Rosendahl, and H. Kittler , The HAM10000 dataset, a large collection of multi-source dermatoscopic images of common pigmented skin lesions , Scientific Data, 5 (2018), p. 180161, https://doi.org/10.1038/sdata.2018.161, https://www.nature.com/articles/sdata2018161
-
[24]
X. Wang, Y. Peng, L. Lu, Z. Lu, M. Bagheri, and R. M. Summers , Chestx-ray8: Hospital-scale chest x-ray database and benchmarks on weakly-supervised classification and localization of common thorax diseases , in IEEE Conference on Computer Vision and Pattern Recognition, 2017, pp. 2097--2106, https://doi.org/10.1109/CVPR.2017.369, https://openaccess.thecv...
-
[25]
write newline
" write newline "" before.all 'output.state := FUNCTION fin.entry add.period write newline FUNCTION new.block output.state before.all = 'skip after.block 'output.state := if FUNCTION not #0 #1 if FUNCTION and 'skip pop #0 if FUNCTION or pop #1 'skip if FUNCTION new.block.checka empty 'skip 'new.block if FUNCTION field.or.null duplicate empty pop "" 'skip ...
discussion (0)
Sign in with ORCID, Apple, or X to comment. Anyone can read and Pith papers without signing in.